báo cáo khoa học: " Patient complexity in quality comparisons for glycemic control: An observational study" docx
Bạn đang xem bản rút gọn của tài liệu. Xem và tải ngay bản đầy đủ của tài liệu tại đây (619.34 KB, 8 trang )
BioMed Central
Page 1 of 8
(page number not for citation purposes)
Implementation Science
Open Access
Research article
Patient complexity in quality comparisons for glycemic control: An
observational study
Monika M Safford*
1
, Michael Brimacombe
2,3
, Quanwu Zhang
2
,
Mangala Rajan
2
, Minge Xie
2,4
, Wesley Thompson
2,4
, John Kolassa
2,4
,
Miriam Maney
2
and Leonard Pogach
2
Address:
1
Deep South Center on Effectiveness at Birmingham VA Medical Center and University of Alabama at Birmingham, Birmingham, AL,
USA,
2
VA New Jersey Healthcare System, East Orange, NJ, USA,
3
University of Medicine and Dentistry of New Jersey-New Jersey Medical School,
Newark, NJ, USA and
4
Rutgers University, Piscataway, NJ, USA
Email: Monika M Safford* - ; Michael Brimacombe - ; Quanwu Zhang - ;
Mangala Rajan - ; Minge Xie - ; Wesley Thompson - ;
John Kolassa - ; Miriam Maney - ; Leonard Pogach -
* Corresponding author
Abstract
Background: Patient complexity is not incorporated into quality of care comparisons for glycemic
control. We developed a method to adjust hemoglobin A1c levels for patient characteristics that
reflect complexity, and examined the effect of using adjusted A1c values on quality comparisons.
Methods: This cross-sectional observational study used 1999 national VA (US Department of
Veterans Affairs) pharmacy, inpatient and outpatient utilization, and laboratory data on diabetic
veterans. We adjusted individual A1c levels for available domains of complexity: age, social support
(marital status), comorbid illnesses, and severity of disease (insulin use). We used adjusted A1c
values to generate VA medical center level performance measures, and compared medical center
ranks using adjusted versus unadjusted A1c levels across several thresholds of A1c (8.0%, 8.5%,
9.0%, and 9.5%).
Results: The adjustment model had R
2
= 8.3% with stable parameter estimates on thirty random
50% resamples. Adjustment for patient complexity resulted in the greatest rank differences in the
best and worst performing deciles, with similar patterns across all tested thresholds.
Conclusion: Adjustment for complexity resulted in large differences in identified best and worst
performers at all tested thresholds. Current performance measures of glycemic control may not
be reliably identifying quality problems, and tying reimbursements to such measures may
compromise the care of complex patients.
Background
Patient complexity has recently been raised as an impor-
tant issue in patient care and quality assessment [1-4].
While complexity from multiple medical conditions has
been increasingly discussed [1-4], there are important
additional sources of complexity that directly impact
patient care. For example, patients' behavior and availa-
bility of psychosocial support mechanisms may directly
Published: 6 January 2009
Implementation Science 2009, 4:2 doi:10.1186/1748-5908-4-2
Received: 19 December 2006
Accepted: 6 January 2009
This article is available from: />© 2009 Safford et al; licensee BioMed Central Ltd.
This is an Open Access article distributed under the terms of the Creative Commons Attribution License ( />),
which permits unrestricted use, distribution, and reproduction in any medium, provided the original work is properly cited.
Implementation Science 2009, 4:2 />Page 2 of 8
(page number not for citation purposes)
impact clinical decision-making. The Vector Model of
Complexity proposes that a patient's complexity arises out
of interactions between six domains: biology/genetics,
socioeconomics, culture, environment/ecology, behavior,
and the medical system [5]. Currently, the only aspect of
patient complexity included in quality assessments is
patient age, because most performance measures for
accountability exclude older individuals.
The influence of complexity on patient outcomes is well-
demonstrated in diabetes, which has a number of
accountability performance measures. Many diabetes
patients have multiple medical problems, contributing to
complexity along the Vector Model's biological vector.
Additional challenges along this axis are imposed by dis-
ease severity, because diabetes can be easier to control
early in its course. Complexity is also introduced along the
behavioral axis, because diabetes imposes considerable
self-care demands [6]. These self-care demands can be
especially difficult for patients who lack social support,
contributing complexity along the socioeconomic vector
[7-9]. In the U.S. Department of Veterans Affairs (VA),
married diabetic men have better glycemic control than
unmarried diabetic men [10], demonstrating the impor-
tance of social support in men with diabetes. All of these
sources of complexity alone or in combination call for
clinical trade-off decisions, possibly deviating from 'ideal
care.' When the Institute of Medicine recommended that
the ideal health care system deliver care is 'driven by
shared decision-making and based on continuous, heal-
ing relationships' [11], it acknowledged that for some
patients, especially those that are complex, 'good care' will
not necessarily lead to ideal performance measures.
None of these aspects of patient complexity is currently
reflected in performance measures widely used for public
reporting, and, more recently, to 'pay for performance'
(P4P) [12-14]. While public reporting of the quality of
healthcare has had measurable effects on improving pop-
ulation health [15-17], the fact that currently imple-
mented performance measures do not account for patient
complexity has raised concerns [1-4]. For diabetes, the
public accountability measure has been an assessment of
poor glycemic control as reflected by hemoglobin A1c
>9.0%, with plans to set this threshold at lower levels
[18]. This performance measure is based on well-estab-
lished evidence that glycemic control is associated with
diabetes outcomes [19]. However, it is unclear how
patient complexity influences the assessment of quality of
care provided by health care plans.
One issue that has prevented accounting for complexity in
quality assessments is the lack of methods to do so. We
studied how incorporating several readily available char-
acteristics that reflect patient complexity along the biolog-
ical vector (age, comorbidity, severity of diabetes as
reflected in insulin use), and the socioeconomic vector (as
reflected by marital status) affected assessments of quality
of care. We conducted this study in the nation's largest
integrated health system, the Veterans Health Administra-
tion (VHA).
Methods
Data
We used data from the VHA's Healthcare Data Analysis
Information Group (Milwaukee, WI) for pharmacy data
and A1c values, and the National Patient Clinical Dataset
from the Veterans Integrated Service Network Support
Center (Austin, TX) for inpatient and outpatient adminis-
trative utilization data with associated International Clas-
sifications of Diseases, 9
th
edition (ICD-9) codes and
demographic information. To identify diabetes, we
selected veterans who used the VHA in 1998, were alive at
the end of 1999, and in 1999 received either a diabetes
medication or had an ICD-9 code 250.xx (diabetes) asso-
ciated with more than one outpatient encounter or any
inpatient encounter at one of the VHA's 145 medical cent-
ers [20].
When multiple values for A1c were present for an individ-
ual for 1999, we used the last available value. Values that
fell above the physiologic range were excluded (>18.0%).
Several VA medical centers could not be included because
of A1c lab assay methodology. Precision and bias prob-
lems with A1c laboratory assays to measure A1c levels
have been reported [21-23], and a national effort to stand-
ardize A1c test methods is underway. Because standardi-
zation of A1c methodology was not mandated in the VHA
until late in 1999, we contacted the laboratory director at
each medical center to determine which A1c lab method
was utilized at their medical center that year. Only the 66
medical centers using exclusively National Glycohemo-
globin Standardization Project-certified methods were
included in this study [24].
Variables used to reflect patient complexity
According to the Vector Model of Complexity, patient
complexity can arise along vectors represented by the
major determinants of health: socioeconomic, cultural,
biological, environmental, and behavioral [25]. Not all of
these influences can be readily assessed using administra-
tive data. Because our goal was to use existing data, we
examined variables that were available in the VA data-
bases. They included a variable along the socioeconomic
vector (married status) and several variables along the
biological vector, including age, comorbid illnesses and
severity of diabetes approximated by insulin treatment. In
type 2 diabetes, insulin treatment signals failure of oral
therapies and reflects more advanced disease. Patients are
Implementation Science 2009, 4:2 />Page 3 of 8
(page number not for citation purposes)
often reticent to initiate treatment requiring needles and
more intense monitoring, therefore insulin treatment in
type 2 patients is an approximate indicator of disease
severity [19]. To represent comorbid illnesses, we used
Selim's Comorbidity Score, a validated method developed
among veterans that sums the presence of any of 30 com-
mon chronic illnesses into a single unweighted score [26].
Selim's Comorbidity Score correlates with the physical
component summary score of the SF-36 [27]. Both inpa-
tient and outpatient utilization data and associated ICD-9
codes were used to construct the comorbidity score. We
also tested the more widely used Deyo modification of the
Charlson Comorbidity Index to represent comorbid con-
ditions [28,29], and found similar results; therefore we
present results only using Selim's Comorbidity Score.
Modeling
We used linear regression models to complexity-adjust
individual A1c levels as a continuous measure. Covariates
included age, marital status, insulin treatment, and
comorbidity score. Because an essential feature of the Vec-
tor Model is the interrelatedness of components of com-
plexity, we considered interactions between age and the
comorbidity score, and between age and diabetes treat-
ment. We retained only variables that were significant at
the p < 0.05 level in the final model.
We evaluated the model's performance by examining R
2
and by dividing the adjusted A1c values into deciles, then
examining the proportion of the unadjusted above-
threshold values in each decile [30]. We evaluated model
stability by drawing 30 random 50% subsamples and
examining their ranges of the regression coefficients and
R
2
.
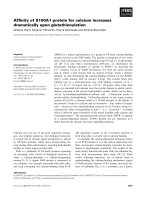
Profiling
To evaluate the effect of complexity-adjustment on profil-
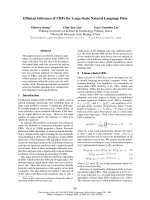
ing (rank order), we proceeded in three steps (see Figure
1). In step one, we created 'observed,' or unadjusted ranks.
We first created proportions for each VAMC consisting of
the number of individuals with observed A1c at or above
threshold divided by the total number of diabetes patients
Steps used to examine results of using unadjusted vs. adjusted A1c to rank VA Medical Centers on glycemic controlFigure 1
Steps used to examine results of using unadjusted vs. adjusted A1c to rank VA Medical Centers on glycemic
control.
Implementation Science 2009, 4:2 />Page 4 of 8
(page number not for citation purposes)
at that VAMC. We then ranked VAMC on these propor-
tions.
In step two, we created 'observed-to-expected,' or
adjusted, ranks. We first determined the entire national
study population's (all 66 VA medical centers) proportion
of observed uncontrolled patients (the national observed
uncontrolled proportion). Then, we flagged individuals
with adjusted A1c's at or above the corresponding
national observed uncontrolled proportion for each
threshold (the 'expected' uncontrolled). For example,
15.6% of patients at the 66 medical centers overall had
unadjusted A1c >9.5%; we therefore identified all sample
members with the 15.6% highest adjusted A1c values.
Next, we counted the number of individuals at each
VAMC who were flagged as being in the national observed
uncontrolled proportion. We then used this number of
'expected' uncontrolled to create the 'observed-to-
expected' ratio for each VAMC. Last, we ranked VAMC on
these 'observed-to-expected' ratios.
In step three, we compared the results with ranks obtained
in step two (adjusted ranks) with those obtained in step
one (unadjusted ranks). We repeated this process for each
of the tested thresholds of A1c: 8.0%, 8.5%, 9.0%, and
9.5%.
All statistical analyses were performed using STATA (Ver-
sion 7.0, Stata Corporation, 2001) and SAS (Version 9.0,
Cary, NC). The VA New Jersey Healthcare System institu-
tional review board approved the study.
Results
The patients in the study sample (n = 118,167) were sim-
ilar to the overall VHA diabetes population (Table 1), with
a mean age of 64 years (SD 11) and 63% married. Patients
in the study sample had on average 1.7 more comorbid
medical conditions than the population of veterans with
diabetes. Thirty-nine percent were on insulin, either alone
or in combination with oral agents. The 66 sample VA
medical centers cared for a mean number of 1,790
patients with diabetes (range 328 to 5192) and 15.6% of
the study sample had A1c >9.5% (range 4.9 to 25.2%),
21.7% >9.0% (6.7 to 32.1%), 29.6% >8.5% (11.9 to
42.3%), and 39.7% >8.0% (21.2 to 54.5%).
Medical Center ranks differed modestly simply by using a
different A1c thresholds, without any adjustment. Com-
pared with ranks obtained using the 9.0% threshold, 51%
of ranks obtained using 8.0% were within five ranks. For
the best quartile of performance, 76% of ranks for the
8.0% threshold were within five ranks of those obtained
using 9.0%.
Modeling results
All variables and the age * comorbidity score interaction
contributed significantly to variation in A1c and were
retained in the final model (Table 2). This model's R
2
was
8.3%. The resampled coefficient means were very close to
the original model with narrow ranges (Table 2), reflect-
ing model stability.
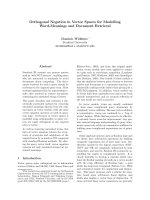
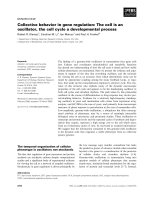
Decile of risk tables [30] indicated that each decile of
adjusted A1c had successively more above-threshold
observed values, as expected (Figure 2). Trends were sim-
ilar for each threshold. The considerable change in the
proportion of unadjusted above-threshold values across
the deciles indicated that assessments based on unad-
justed values were quite different from those based on
adjusted values.
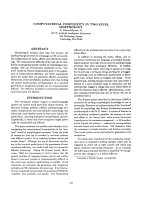
Effect of complexity-adjusted A1c on VA medical center
profiling
The effects of adjusting for complexity on profiling were
substantial. Figure 3 demonstrates that the greatest
changes in rank occurred in the extreme deciles that are
the focus of quality assessment. These changes were simi-
lar across all the thresholds tested. For medical centers in
the best decile of performance, the average change in rank
was 25, with similar magnitude of change for medical
centers within the worst decile of performance. Table 3
depicts the actual rank changes experienced by the top
and bottom ten performers. Between zero and two medi-
cal centers remained in the top ten after complexity-
adjustment, and one to two medical centers remained in
the bottom ten, depending on the threshold. Remarkably,
two to three medical centers in the bottom ten became top
ten performers with complexity-adjustment, regardless of
the threshold chosen.
Discussion
Using A1c values adjusted for only a few domains of
patient complexity as proposed in the Vector Model of
Complexity caused substantial differences in which VA
Table 1: Patient characteristics* of all VHA patients with
diabetes and the study sample.
Patient characteristic Veterans with diabetes Study sample
N 552,128 118,167
Age in years, mean ± SD 64.2 ± 11.1 64.1 ± 11.1
Married, % 61.9 62.7
Diabetes treatment, %
No VHA meds 3.3 3.2
Oral agents only 57.7 57.9
Insulin only 21.9 22.7
Insulin + oral agent(s) 17.2 16.2
Comorbidity score ± SD 3.4 ± 2.6 5.1 ± 3.0
*p-values not shown due to large sample and small differences
reaching statistical significance. 98% of the sample was male.
Implementation Science 2009, 4:2 />Page 5 of 8
(page number not for citation purposes)
Table 2: Complexity-adjustment model for A1c with model coefficients and coefficients of thirty random 50% subsamples (with
resampling).
Variable Model
Coefficients ± SE
Mean of Resampled
Coefficients [Range]
Age group (years)
<55 vs. >75 0.92 ± 0.03 0.92 [0.84, 0.99]
55 – 65 vs. >75 0.49 ± 0.03 0.49 [0.39, 0.56]
65 – 75 vs. >75 0.21 ± 0.03 0.20 [0.14, 0.26]
Married vs. not 0.07 ± 0.01 0.07 [0.05, 0.10]
Insulin vs. no insulin -0.75 ± 0.01 -0.75 [-0.78, -0.72]
Comorbidity score -0.02 ± 0.00 -0.03 [-0.04, -0.02]
Age group * Comorbidity score
<55 vs. >75 -0.05 ± 0.01 -0.05 [-0.07, -0.04]
55 – 65 vs. >75 -0.02 ± 0.01 -0.02 [-0.03, 0.00]
65 – 75 vs. >75 -0.01 ± 0.01 -0.01 [-0.02, -0.00]
Intercept 8.16 ± 0.02 8.16 [8.10, 8.23]
Model R
2
0.083 0.084 [0.078, 0.089]
Deciles of adjusted A1c with contribution of above-threshold unadjusted A1cFigure 2
Deciles of adjusted A1c with contribution of above-threshold unadjusted A1c.
Implementation Science 2009, 4:2 />Page 6 of 8
(page number not for citation purposes)
medical centers were identified as best and worst perform-
ers. Depending on the threshold, 20–30% of the ten best
performers among these 66 medical centers using
adjusted values would have been identified as among the
ten worst performers without adjustment. Our findings
suggest that patient complexity has a major impact on
quality assessment using unadjusted A1c in the glycemic
control performance measure. This finding calls into
questions whether currently used methodology should be
tied to reimbursement [13]; one of the indicators cur-
rently included in the Bridges to Excellence diabetes pro-
gram for physicians and providers includes the
proportion of people with diabetes who had poorly con-
trolled A1c levels at last measure.
Adjustment for complexity had a similar impact across all
tested thresholds of A1c. Although our study focuses on
thresholds in place at the time of the study (A1c >9.0%),
our findings have implications for the recent decision to
lower the threshold for glycemic control by National
Committee on Quality Assurance, since the plans are to
use unadjusted A1c levels [18].
We were unable to include important aspects of patient
complexity, along the behavioral, cultural, and environ-
mental vectors. We only had one element along the soci-
oeconomic vector, and even along the biological vector,
the elements were not comprehensive. For example, we
examined the role of specific illnesses, including mental
health conditions, on quality of care assessments, and
found that the relationship between achieving optimal
glycemic control and specific comorbid illness patterns is
heterogeneous [31]. In addition, ICD-9 codes cannot
reflect the severity of conditions. Some quality assess-
ments currently rely on patient surveys, and we have
shown that survey-derived data captures important addi-
tional dimensions with profound impact on quality of
care assessments [32]. Surveys are not without their draw-
backs, including biases and cost [33]. It is clear that
thoughtful approaches to capturing the full picture of
patient complexity are needed.
Nevertheless, our study's findings of large differences in
identified best and worst performing medical centers
underscores the urgency in incorporating complexity,
even in rudimentary form, into quality comparisons.
Table 3: Rank changes* with adjustment among the top ten and bottom ten performers among 66 VA medical centers
Adjusted rank
8.0% 8.5% 9.0% 9.5%
Top ten performers, unadjusted rank
1 30 7329
2 11 33 31 20
3 40 40 30 11
4 56 34 48 3
5 36 56 9 56
6 29 17 35 38
7 39 23 28 46
8 51 42 50 33
9 22 41 32 37
10 37 48 43 28
Number among top ten performers, unadjusted, who would be ranked as top ten performers with adjustment 0 1 2 1
Bottom ten performers, unadjusted rank
57 50 58 5 34
58 4 50 12 21
59 3 60 57 60
60 58 51 59 10
61 52 53 53 5
62 57 3 56 55
63 8 55 42
64 20 16 23 26
65 38 6 44 27
66 54 49 6 44
Number among bottom ten performers, unadjusted, who would be ranked as top ten performers with adjustment 2 2 3 3
*Emboldened numbers indicate adjusted ranks in the top ten.
Implementation Science 2009, 4:2 />Page 7 of 8
(page number not for citation purposes)
Because of the inevitable trade-off decisions required in
the care of complex patients, their care may not be
assessed as 'guideline concordant.' Tying guideline con-
cordant care to reimbursement creates a tension for treat-
ing physicians: should they 'treat for performance' or treat
the patient? Both may not be possible; P4P could poten-
tially pose a threat to the overall quality of care received
by complex patients, as perverse incentives encourage the
clinician to spend less time engaging the patient in elicit-
ing preferences and developing congruence on a tailored
treatment plan.
The rudimentary variables we did include in our adjust-
ment model are widely available, which could be
abstracted from medical records during annual data col-
lection for performance measures. The model demon-
strated explanatory value in a range typical for so-called
case-mix adjustment models [30], the deciles of adjusted
values had the expected increasing contribution of above-
threshold unadjusted values, and the parameter estimates
were stable with repeated sampling. Further, the simplic-
ity of our approach makes it feasible in various settings.
Our study was conducted in the VA, which includes
largely older men who may be more debilitated than the
general population. Our findings should be examined in
other populations. In addition, while the components of
complexity changed assessed performance, our study was
not designed to assign 'appropriateness' to elements of
complexity for quality of comparisons, an area of ongoing
clinical debate.
Conclusion
Adjusting A1c levels for readily available characteristics
that reflect some aspects of patient complexity resulted in
large differences in identifying best or worst performers,
most pronounced at the extremes of performance that are
the focus of quality assessment. These findings were simi-
lar across all tested thresholds of A1c, suggesting that both
domains of patient complexity included in this study were
important influences at all levels of glycemic control. It is
not clear to what extent current practices for assessing gly-
cemic control as a quality of care indicator may be identi-
fying differences in the populations the health systems
serve, or differences in the quality of care they provide.
Tying such measures to reimbursement may not be in the
Mean decile change in rank with adjustment for 66 VA medical centersFigure 3
Mean decile change in rank with adjustment for 66 VA medical centers. Decile 1 includes the 'top' performers
among these 66 VA medical centers. For each threshold of A1c, VA medical centers in Decile 1 experienced an average change
in rank of 25.
Implementation Science 2009, 4:2 />Page 8 of 8
(page number not for citation purposes)
best interest of patients until a measure more convinc-
ingly reflective of quality of care can be proposed.
Competing interests
The authors declare that they have no competing interests.
Authors' contributions
MS conceived of the paper, interpreted data, drafted the
manuscript and procured funding. MB provided concep-
tion and design input, conducted the analyses and partic-
ipated in providing critical revisions to the draft. QZ
provided conception and design input, as well as critical
revisions to the draft. MR provided conception and design
input, and acquired data. MX, WT, and JK provided con-
ception and design input, and provided critical revisions
to the draft. MM conducted analyses and provided critical
revisions to the draft. LP provided input into conception
of the paper, interpreted data, critical revisions to the
manuscript and procured funding.
Acknowledgements
We thank Arlene Ash for her helpful suggestions. A very early version of
this paper was presented at the American Diabetes Association, San Fran-
cisco, CA June 17, 2002. Supported by a generous grant from the American
Diabetes Association (Dr. Safford, PI) and VA Health Services Research &
Development Investigator Initiated Research award 00-072-1 (Dr. Pogach,
PI)
References
1. Boyd CM, Darer J, Boult C, Fried LP, Boult L, Wu AW: Clinical
practice guidelines and quality of care for older patients with
multiple comorbid diseases: implications for pay for per-
formance. JAMA 2005, 294:716-724.
2. Brown AF, Mangione CM, Saliba D, Sarkisian CA: Guidelines for
improving the care of the older person with diabetes melli-
tus. J Am Geriatr Soc 2003, 51:S265-280.
3. Durso SC: Using clinical guidelines designed for older adults
with diabetes mellitus and complex health status. JAMA 2006,
295:1935-1940.
4. Tinetti ME, Bogardus ST Jr, Agostini JV: Potential pitfalls of dis-
ease-specific guidelines for patients with multiple conditions.
N Engl J Med 2004, 351:2870-2874.
5. Safford MM, Allison JJ, Kiefe CI: Patient Complexity: More Than
Comorbidity. The Vector Model of Complexity. J Gen Intern
Med 2007, 22(Suppl 3):382-390.
6. Russell LB, Suh DC, Safford MA: Time requirements for diabetes
self-management: too much for many? J Fam Pract 2005,
54:52-56.
7. Anderson BJ, Cullen K, McKay S: Quality of life, family behavior,
and health outcomes in children with type 2 diabetes. Pediatr
Ann 2005, 34:722-729.
8. Tomaka J, Thompson S, Palacios R: The relation of social isola-
tion, loneliness, and social support to disease outcomes
among the elderly. J Aging Health 2006, 18:359-384.
9. van Dam HA, Horst FG van der, Knoops L, Ryckman RM, Crebolder
HF, Borne BH van den: Social support in diabetes: a systematic
review of controlled intervention studies. Patient Educ Couns
2005, 59:1-12.
10. Zhang Q, Safford M, Ottenweller J, Hawley G, Repke D, Burgess JF Jr,
Dhar S, Cheng H, Naito H, Pogach LM: Performance status of
health care facilities changes with risk adjustment of
HbA1c[comment]. Diabetes Care 2000, 23:919-927.
11. Institute of Medicine, Committee on Quality Health Care in America:
Crossing the quality chasm Washington, DC: National Academy Press;
2001.
12. Bridges to Excellence for Physicians & Providers, NCQA
Diabetes Care Performance Assessment Program
[http:www.bridgestoexcellence.org/Content/
ContentDisplay.aspx?Con tentID=21]
13. Fact sheet: Medicare 'pay for performance (P4P)' initiatives,
January 31, 2005 [ />]
14. Kaisernetwork.org Daily Health Policy Report. Medicare:
Rep. Johnson calls for pay-for-performance Medicare reim-
bursement system for physicians, March 16, 2005 [http://
www.kaisernetwork.org/daily_reports/
rep_index.cfm?hint=3&DR_ID=28742]
15. Hannan EL, Wu C, Walford G, King SB 3rd, Holmes DR Jr, Ambrose
JA, Sharma S, Katz S, Clark LT, Jones RH: Volume-outcome rela-
tionships for percutaneous coronary interventions in the
stent era. Circulation 2005, 112:1171-1179.
16. Jha AK, Perlin JB, Kizer KW, Dudley RA: Effect of the transforma-
tion of the Veterans Affairs Health Care System on the qual-
ity of care. N Engl J Med 2003, 348:2218-2227.
17. Mukamel DB, Weimer DL, Mushlin AI: Referrals to high-quality
cardiac surgeons: patients' race and characteristics of their
physicians. Health Serv Res 2006, 41:1276-1295.
18. Quality Update for April 9, 2004. New NCQA Quality Diabe-
tes Measures Endorsed [ />162_696_4750.cfm#newn]
19. Turner RC, Cull CA, Frighi V, Holman RR: Glycemic control with
diet, sulfonylurea, metformin, or insulin in patients with type
2 diabetes mellitus: progressive requirement for multiple
therapies (UKPDS 49). UK Prospective Diabetes Study
(UKPDS) Group. JAMA 1999, 281:2005-2012.
20. Hebert PL, Geiss LS, Tierney EF, Engelgau MM, Yawn BP, McBean AM:
Identifying persons with diabetes using Medicare claims
data. Am J Med Qual 1999, 14:270-277.
21. Little RR, Wiedmeyer HM, England JD, Naito HK, Goldstein DE:
Interlaboratory comparison of glycohemoglobin results:
College of American Pathologists Survey data. Clin Chem
1991, 37:1725-1729.
22. McKenzie PT, Sugarman JR: Implications for clinical perform-
ance measurement of interlaboratory variability in methods
for glycosylated hemoglobin testing. Am J Med Qual 2000,
15:62-64.
23. Takahashi Y, Noda M, Tsugane S, Kimura S, Akanuma Y, Kuzuya T,
Ohashi Y, Kadowaki T: Importance of standardization of hemo-
globin A1c in the analysis of factors that predict hemoglobin
A1c levels in non-diabetic residents of three distinct areas of
Japan. Diabetes Res Clin Pract 2001, 53:91-97.
24. NGSP [ />]
25. Tarlov AR: Public policy frameworks for improving population
health. Ann N Y Acad Sci 1999, 896:281-293.
26. Selim AJ, Fincke G, Ren XS, Lee A, Rogers WH, Miller DR, Skinner
KM, Linzer M, Kazis LE: Comorbidity assessments based on
patient report: results from the Veterans Health Study. J
Ambul Care Manage 2004, 27:281-295.
27. Selim A, Fincke G, Ren XS: The Comorbidity Index. In Measuring
and Managing Health Care Quality Edited by: Goldfield N, Pine M, Pine
J. New York: Aspen; 2002.
28. Deyo RA, Cherkin DC, Ciol MA: Adapting a clinical comorbidity
index for use with ICD-9-CM administrative databases. Jour-
nal of Clinical Epidemiology 1992, 45:613-619.
29. Charlson ME, Pompei P, Ales KL, McKenzie CR: A new method of
classifying prognostic comorbidity in longitudinal studies:
development and validation. Journal of Chronic Diseases 1987,
40:373-383.
30. Schwartz M, Ash A: Evaluating the performance of risk-adjust-
ment methods: continuous outcomes. In Risk Adjustment for
Measuring Healthcare Outcomes 2nd edition. Edited by: Iezzoni LI. Chi-
cago, IL: Health Administration Press; 1997:391-426.
31. Meduru P, Helmer D, Rajan M, Tseng C-L, Pogach L: Chronic illness
with complexity: implications for performance measure-
ment of optimal glycemic control. Journal of General Internal
Medicine 2007 in press.
32. Maney M, Tseng CL, Safford M, Miller DR, Pogach L: Impact of self-
reported patient characteristics upon assessment of glyc-
emic control in the VHA. Diabetes Care 2007 in press.
33. Polls face growing resistance, but still representative survey
experiment shows [ />play.php3?ReportID=211]