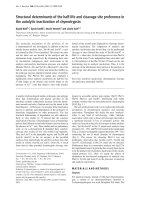
Báo cáo y học: " Systematic monitoring of needs for care and global outcomes in patients with severe mental illness" ppsx
Bạn đang xem bản rút gọn của tài liệu. Xem và tải ngay bản đầy đủ của tài liệu tại đây (686.77 KB, 10 trang )
Drukker et al. BMC Psychiatry 2010, 10:36
/>Open Access
RESEARCH ARTICLE
© 2010 Drukker et al; licensee BioMed Central Ltd. This is an Open Access article distributed under the terms of the Creative Commons
Attribution License ( which permits unrestricted use, distribution, and reproduction in
any medium, provided the original work is properly cited.
Research article
Systematic monitoring of needs for care and global
outcomes in patients with severe mental illness
Marjan Drukker*
1
, Jim van Os
1,2
, Maarten Bak
1,3
, Joost à Campo
3
and Philippe Delespaul
1,3
Abstract
Background: It was hypothesised that the introduction of tools that allow clinicians to assess patients' needs and to
negotiate treatment (Cumulative Needs for Care Monitor; CNCM), would be associated with global outcome
improvements in patients diagnosed with severe mental illness.
Methods: The CNCM was introduced in one region in South Limburg (the Netherlands) in 1998 (REGION-1998) and in
the rest of South Limburg in 2004 (REGION-2004). By comparing these two regions, changes after the introduction of
the CNCM could be assessed (between-region comparison). In addition, a pre-post within-patient comparison was
conducted in both regions.
Results: The within-patient comparison revealed that global outcomes of psychopathology and impairment improved
in the first 3-5 years after the introduction of the CNCM. The between-region comparison revealed an improvement in
global psychopathology but not in global impairment in REGION-2004 after 2004, while there was no such
improvement in REGION-1998.
Conclusion: Systematic clinical monitoring of individual severe mental illness patients, in combination with provision
of feedback, is associated with global improvement in psychopathology. More research is needed to determine the
degree to which this association reflects a causal effect.
Background
It is assumed that a person-based rehabilitation strategy
informed by systematic and cumulative assessments of
need for care and severity of symptoms may contribute to
improved outcomes in patients diagnosed with severe
mental illness (SMI). However, there is little empirical
data to suggest that such a systematic, needs-based
approach benefits individual patients.
SMI is best characterised as a complex combination of
psychiatric, somatic and social needs. Most SMI patients
are diagnosed with schizophrenia or psychotic disorder.
Many have needs in the domains of self-care, accommo-
dation, daytime activities and social contact [1], and have
trouble finding employment [2-4]. Psychiatric care pro-
viders, particularly in continental European countries,
have difficulties in systematically focusing on patients'
needs and often select patients for available services [5,6].
The efficiency of services may improve when treatment
plans are needs based [7,8]. However, needs-based care
can only be achieved through individual assessments that
personalise rehabilitation strategies. This contrasts with
current practice, in which treatment planning mostly
remains an implicit intuitive process.
The Cumulative Needs for Care Monitor (CNCM)
introduces diagnostic tools that allow clinicians to explic-
itly assess patients' needs and to negotiate treatment with
the patient [9]. Clinicians are trained to attend to the
assessment of needs, in order to customise interventions
in negotiation with the patient. For this purpose, CNCM
feedback reports supply individualised information on
needs and outcomes over time and on the position of the
individual in a reference group. Two previous studies
evaluated the validity, feasibility and effectiveness of the
use of the CNCM in treatment. The first showed that
need for care assessed with the CNCM predicted psychi-
atric inpatient but not psychiatric outpatient care con-
sumption in the year following the assessment [10]. The
second study showed that unmet needs in domains
affecting the ability to live independently were associated
with met needs in these domains at the next assessment,
* Correspondence:
1
Department of Psychiatry and Psychology, School for Mental Health and
NeuroScience MHeNS, Maastricht University, The Netherlands
Full list of author information is available at the end of the article
Drukker et al. BMC Psychiatry 2010, 10:36
/>Page 2 of 10
suggesting that clinical decisions were guided by CNCM
feedback on treatment outcomes. On the other hand,
unmet needs in the domain of psychopathology did not
predict a met need in the same domain at the next assess-
ment. This could have been expected, as patients with
treatment-resistant syndromes are selected in services
that attend the most needy individuals [1]. Although
these initial findings are encouraging, more research is
needed. Wiersma and colleagues, for example, concluded
that more research is needed in order to make an
informed judgement about the effectiveness of mental
health care in reducing the number of needs [11].
Purpose
The present research examined the hypothesis that the
systematic use of the CNCM, as a needs-based systematic
assessment tool, would impact on global outcomes. The
aim of the analysis was to compare the first CNCM
assessment with subsequent assessments (within-patient
comparisons) and to compare two regions (between-
region comparisons). It was hypothesised that results
would depend on the treatment history of the patient
(new in care, 2-3 years in care or chronic; hereafter 'level
of chronicity'), because chronic patients are more likely to
present with needs that are persistent as a result of lack of
treatment response.
The analyses described in this paper were carried out as
part of the E-Tail study (Efficiency of Tailor-made Psychi-
atric Rehabilitation), which was designed to evaluate the
efficiency and effectiveness of the CNCM.
Methods
Real-life monitor data that had been longitudinally col-
lected within clinical practice were used for the present
analyses.
The Cumulative Needs for Care Monitor
The CNCM is used in mental health care in both inpa-
tient and outpatient settings in South Limburg (pop.
660,000), which is an ethnically homogeneous area. The
monitor was introduced in 1998 in one region (the city of
Maastricht, pop. 122,000; hereafter REGION-1998) and
was expanded in 2004 to the rest of South Limburg
(REGION-2004 I and II) [9].
Mental health professionals (psychiatrists, psycholo-
gists, nurses, social workers) were trained to administer
CNCM forms, which provide clinical case information
for individual feedback as well as cumulative data for the
database.
CNCM forms include various validated clinical instru-
ments, such as the Camberwell Assessment of Need
(CAN) [12,13], the Brief Psychiatric Rating Scale (BPRS)
[14] and the Global Assessment of Functioning (GAF)
scale [15].
Global outcomes
The GAF is the fifth axis of the DSM IV; scores range
from 0 (poor) to 100 (very good) [15,16]. The GAF used
in the CNCM is divided into its psychopathology compo-
nent (GAF-p, sample range 1-95) and its impairment
component (GAF-i, sample range 0-97) [17]. The GAF is
recognised as a valid and comprehensive measure of psy-
chiatric mental health when used in routine clinical prac-
tice [18]. Good to excellent agreement between patients
and clinician has been reported [16]. Nevertheless, GAF
scores for SMI in the CNCM database have drifted
upwards because professional carers rate their patients in
comparison to their caseload rather than according to the
criteria given in the manual [9].
Brief Psychiatric Rating Scale
The Brief Psychiatric Rating Scale (BPRS) is a compre-
hensive instrument designed to measure the severity of
symptoms [9]. Based on previous BPRS research, a con-
firmatory factor analysis was performed, using the
CNCM data [9]. This confirmed the existence of four
underlying constructs (also called the BPRS symptom
dimensions): negative symptoms, positive symptoms,
manic excitement and depression/anxiety [9].
Subjects
There is a lack of consensus on the definition of SMI
[19,20]. The intention is to include in the CNCM all
patients from 'integrated care' departments that are treat-
ing patients with severe and long-lasting psychiatric ill-
nesses. Thus, criteria for SMI were implicitly followed.
However, CNCM forms are sometimes also used in non-
SMI patients. To exclude patients who were not diag-
nosed with SMI, criteria to select SMI from the total
CNCM patient group were predefined. These criteria
were based not only on diagnosis, given that diagnosis is
not always made at the first assessment. Criteria for SMI
were [9]: (i) having a diagnosis of schizophrenia or psy-
chotic disorder (DSM IV 295, 297 or 298), or having
affective disorder (bipolar disorder: 296.4-8 or 301.13) or
depression with psychotic features (296.14, 296.24,
296.34), (ii) scoring 15 or higher on the positive symp-
toms scale of the BPRS, or (iii) having a combination of
low functioning (GAF < 45) and needs in at least two of
the four following domains: accommodation, welfare
benefits, alcohol and drugs. These four domains of need
were a priori selected from the CAN. Accommodation
and welfare benefits refer to the primary necessities of
life; needs in these domains therefore indicate major
problems related to independent living and justify inclu-
sion in the SMI group. Needs in the domain of alcohol
and drugs indicate comorbidity in the area of substance
use, which suggests a shared underlying liability and
impact on disability [9,21]. Because services for alcohol
Drukker et al. BMC Psychiatry 2010, 10:36
/>Page 3 of 10
and drug addiction did not take part in the data collection
until 2007, patients with a primary diagnosis of substance
abuse disorder but no other psychiatric disorder were not
included in the analyses.
As the definition of SMI was to a certain degree arbi-
trary and an absolute cut-off would have been too strict,
patients who scored less than 45 on one of the two GAF
scales and had a need in one of the four above-mentioned
CAN domains were included in the analyses as moderate
mental illness (MMI) patients. Not included in the analy-
ses were patients with mild psychiatric symptoms repre-
senting common mental disorder (i.e. all patients who did
not meet the above criteria). Note that the above-men-
tioned criteria (which were based on the expert opinion
of psychiatrists working with the CNCM) were used not
to define SMI in a population, but to exclude the non-
SMI group from the CNCM population, given that diag-
nosis is not available for all patients.
The CNCM monitors treatment in the course of rou-
tine care and is part of the routine outcome monitoring
required by insurers and health authorities in the Nether-
lands. The board of directors and executives of the partic-
ipating care providers approved its application. The data
can be used both for evaluative purposes and managerial
decisions, and for anonymised group comparisons to
generate scientific publications. Ethical committees in
Maastricht, Utrecht and Groningen have confirmed that
by law this type of data collection is not in their remit as
long as patients are aware of the purpose (including the
use of their data for scientific publications). During the
interviews, the patients are asked to consent to this pur-
pose and their consent is recorded.
Dataset
All patients receiving mental health care, both inpatients
and outpatients, are ideally assessed by their professional
carers every year and upon every major change in treat-
ment or setting (e.g. hospitalisation, start of a new treat-
ment, discharge). BPRS and GAF are scored by clinicians
[9]. The CAN combines the ratings from both patient and
interviewer using a priori decision rules. These rules
imply that per domain, the highest score is entered on the
form. For example, a need for care with respect to drug
problems that is acknowledged by the clinician but not by
the patient is scored as a need. Similarly, if a patient views
himself as problematically lonely, this is acknowledged in
the score even if the clinician thinks that the patient's
social network is sufficiently large and that contacts with,
for example, the family are satisfactory [9]. A feedback
report based on these data is sent to the professional
carer to be used to negotiate the treatment plan with the
patient. All CNCM assessments are also registered in a
cumulative database. In keeping with current legal
requirements, patients are informed that anonymised
routine clinical data are used for the purpose of regional
health services research and are given the choice to opt
out; in the very few cases where patients do opt out, their
data are excluded.
CNCM forms that had been administered in the event
of any major change in treatment or setting (e.g. hospital-
isation, start of a new psychiatric treatment, discharge)
were excluded from the analyses (see methodological
issues). From the second half of 2006, a GAF re-anchor-
ing exercise was undertaken, teaching professional carers
to score lower on the GAF (see methodological issues).
Therefore, all data collected after July 2006 were
excluded.
Years since baseline
Years in care since baseline was an independent variable
in most of the analyses (see below). It was calculated by
subtracting the baseline date (in days) from the assess-
ment date (in days) and dividing the result by 365.25. The
integer function was then applied to this variable, so that
only full years were counted (90-365 days = 0; 366-730 =
1; etc.).
Statistical analysis
All analyses were performed using Stata 11 [22]. As
patients were interviewed several times, yielding more
than one observation per person (i.e. several records in
the dataset), the assumption of independence of the
observations for standard linear regression analyses was
not met. Multilevel linear regression analysis is suitable
for the analysis of such structured data [23]. The regres-
sion coefficients obtained from multilevel linear regres-
sion analyses can be interpreted in the same way as the
estimates obtained from standard unilevel analyses. The
two GAF scales and the four BPRS dimensions were the
dependent variables in the multilevel linear regression
models.
A within-patient comparison was carried out in the
combined regions of REGION-1998 and REGION-2004.
Years since baseline was the main independent variable,
while sex, age group (15-20, 21-30, 31-40, 41-50, 51-60,
61-91), level of chronicity (i.e. new patients, 2-3 years in
care or chronic), type of care (outpatient, sheltered hous-
ing, inpatient, assertive community treatment), and one
variable that included information on both region and
period (REGION-1998 before 2004, REGION-1998 after
2004, REGION-2004 I and REGION-2004 II) were added
as covariates. All categorical variables were recoded into
dummies (reference categories: age 21-30, new patients,
outpatients, REGION-1998 after 2004). One a priori
interaction term was also included in the model: years
since baseline*level of chronicity. Quadratic terms were
added to the model in order to test whether the associa-
Drukker et al. BMC Psychiatry 2010, 10:36
/>Page 4 of 10
tion between years since baseline and outcomes deviated
from linearity.
For the between-region comparisons, the main inde-
pendent variables were region (REGION-1998 or
REGION-2004), years since baseline and the interaction
term REGION*years since baseline. If outcomes
improved in the region where the CNCM had been intro-
duced only in 2004 while outcomes remained stable in
the same time period in the region where the CNCM had
been in place since 1998, the hypothesis of effectiveness
of the CNCM would be supported. In the between-region
comparison, baseline was the first measurement after July
2004 (hereafter 'baseline 2004'). For patients who were
not assessed in the second half of 2004, baseline 2004 was
the first assessment in 2005 or even 2006. The interaction
term (REGION*years since baseline) was added in order
to model a difference in changes over time between
REGION-1998 and REGION-2004. Sex, age group, level
of chronicity and type of care were added as confounders.
Categorical variables were again entered as dummies.
The 3-way interaction term REGION*level of chronic-
ity*years since baseline 2004 was a priori included (as
were all accompanying 2-way interaction terms). If there
was evidence for interaction, regression coefficients in all
strata of the interacting variable were calculated using the
Stata Lincom procedure.
When testing the 3-way interaction, alpha was set at
0.1. In all other comparisons (main effects and 2-way
interactions), alpha was 0.05.
Results
Within-patient comparisons
A total of 739 patients had undergone between 2 (55%)
and 9 (0.1%) assessments. The assessments were on aver-
age 23 months apart; 28% were 1 year or less apart, while
11% were more than 4 years apart. The mean age of
patients at first assessment was 42 years (range 18-85
years). Of all patients, 27% were MMI rather than SMI,
and 42% were female.
Baseline GAF impairment score was 50.5 and in the fol-
lowing 3 years the scores were 56, 54 and 57, respectively
(table 1). Baseline GAF psychopathology score was 54
and in the following 3 years the scores were 59, 58 and 59.
Pearson correlations between BPRS dimensions and GAF
were between -0.37 and -0.58 (p < 0.001), except for
depression/anxiety where correlations were around -0.30
(p < 0.001).
Analyses showed that the association between years
since baseline and GAF or BPRS was not linear. There-
fore, years since baseline was included as a categorical
variable, formatted as dummies (0 years = reference cate-
gory, 1, 2, 3, 4-5, 6-9 years). There was no interaction
between years since baseline and level of chronicity.
In the first 3 years after baseline, both global outcome
GAF scales (impairment and psychopathology) showed
an improvement, both before (data not shown) and after
(table 1) controlling for confounders. There was also
some evidence of improvement in years 4-5 after control-
ling for confounders, but only for the impairment scale (p
= 0.057).
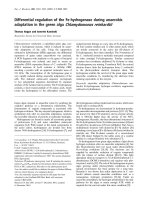
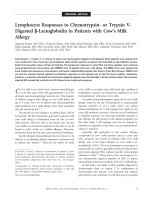
BPRS manic excitement and positive symptoms
increased over the years (β = 0.03, p = 0.009 and β = 0.04,
p = 0.003 respectively), while depression/anxiety
decreased (β = -0.06, 95%, CI = -0.09; -0.04, p < 0.001, fig-
ure 1).
Between-region comparisons
The CNCM database included 128 patients with multiple
assessments between 2004 and July 2006. The assess-
ments were, on average, 12 months apart (standard devia-
tion between: 4.2); 83% were 1 year after baseline and 11%
were 2 years after baseline. Mean age of the patients at
baseline in 2004 was 42 years (range 18-84 years). Of all
patients, 30% were MMI rather than SMI patients, and
40% were female.
In REGION-2004, baseline GAF scores were 49 and 48
(GAF-i and GAF-p, respectively) and scores increased in
the next year to scores similar to those in REGION-1998.
The numbers in the second year of follow-up were low (n
= 6 in both REGION-1998 and REGION-2004).
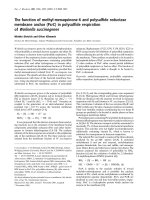
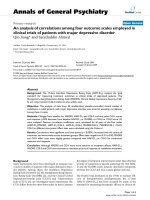
When the GAF scales were the dependent variable,
none of the interaction terms that included level of chro-
nicity was statistically significant. When years since base-
line in 2004 was included as a linear variable (no evidence
for a non-linear association), analyses showed an
improvement in the GAF psychopathology scale in
REGION-2004 after 2004, while there was no such
improvement in REGION-1998 over the same time
period (regression coefficient of interaction term = 6.47,
p = 0.007; figure 2). The association between years since
the baseline in 2004 and GAF impairment did not differ
between the regions (regression coefficient of interaction
term = 2.96, p = 0.22). Inpatients, patients in sheltered
housing and patients in assertive community treatment
scored lower than outpatients (data not shown).
Because the associations between years since baseline
2004 and BPRS dimensions were non-linear, years since
baseline 2004 was included as a categorical variable (0, 1,
2-3 years). The 3-way interaction term REGION*level of
chronicity*years since baseline 2004 was statistically sig-
nificant when analysing manic excitement (χ
2
= 9.0, df =
4, p = 0.06, table 2) and depression/anxiety (χ
2
= 8.55, df =
4, p = 0.07).
Both in new and in chronic patients, there was a
decrease in depression/anxiety in REGION-2004, while
there was no such decrease in REGION-1998 (table 2).
However, this was only in the first year after baseline.
Drukker et al. BMC Psychiatry 2010, 10:36
/>Page 5 of 10
Patients in care for two to three years in REGION-2004
scored lower on manic excitement than those in
REGION-1998, but this was because of an increase in
manic excitement in REGION-1998.
In the models without 3-way interaction (positive
symptoms and negative symptoms), only the negative
symptoms dimension showed interaction between region
and years since 2004 (table 2). In REGION-2004, negative
Table 1: Mean change in GAF scores per year since first CNCM measurement
years since baseline as a
categorical variable
years since baseline linear
years since 1st assessment
n Mean GAF (sd) β 95% CI β 95% CI
GAF impairment 0 (ref) 718 50.5 (14.8) 0
1 153 55.4 (14.6) 3.73** 1.66; 5.80
2 73 54.3 (16.5) 1.30 -1.54; 4.16 0.69** 0.17-1.22
3 67 57.0 (15.4) 4.85** 1.87; 7.85
4-5 year 93 54.5 (16.5) 3.04* 0.11; 5.97
6-9 year 74 50.2 (16.3) 1.92 -1.80; 5.64
GAF psychopathology 0 (ref) 722 53.5 (16.0) 0
1 157 58.8 (15.4) 3.67** 1.45; 5.88
2 73 58.3 (18.0) 1.54 -1.54; 4.62 0.24 -0.32;0.81
3 68 58.7 (16.1) 3.59 0.36; 6.81
4-5 year 96 54.8 (17.6) 0.57 -2.55; 3.69
6-9 year 79 50.4 (18.0) 0.92 -4.63; 3.29
95% CI = 95% confidence interval; only baseline and yearly evaluation assessments were included.
* p < 0.05 ** p < 0.01
Figure 1 Graphical presentation of the BPRS within subject results. Bars indicate mean BPRS scores per stratum (crude) β = change controlled
for age, gender, type of care, level of chronicity * p < 0.05 ** p < 0.001.
Drukker et al. BMC Psychiatry 2010, 10:36
/>Page 6 of 10
symptoms increased 2-3 years after baseline (β = 0.36 p =
0.005), while in REGION-1998 negative symptoms
remained rather stable (table 2).
Discussion
The results showed an improvement in both the psycho-
pathology and the impairment global outcomes when fol-
low-up measurements in the first three to five years were
compared with the first assessment ever (within-person).
The between-region comparison showed that this
improvement was observed only in the region where the
CNCM had been introduced in 2004, although this did
not apply to the global impairment outcome. Thus, the
results suggest that while patients may improve in psy-
chopathology, social impairments may lag behind. This
improvement in psychopathology was mainly visible in
the depression/anxiety domain of the BPRS.
The within-person comparison included more observa-
tions and covered a longer time period, and was therefore
likely to have more statistical power than the between-
region comparison. Power may have been too low to
show a consistent effect across comparisons, also because
CNCM data are collected as part of routine clinical prac-
tice and are therefore likely to be 'noisier' than research
data. In addition, the improvement in the psychopathol-
ogy domain may be a precursor of a subsequent reduc-
tion in impairment. The improvement in symptoms may
not always have been sufficiently large to result in a con-
sistent change in impairment. Thus, gains on the GAF
impairment scale may be found after more years have
elapsed since implementation of the CNCM in REGION-
2004. This assumption is supported by the present
within-person results, which show an increase in the
GAF impairments scale but no longer in the GAF psycho-
pathology scale 4-5 years after baseline.
However, in the within-patient comparison, patients
seem to be worse off in the later years. A likely reason is
the selection of the most severe patients in these years,
due to a selective discharge of less severe patients and
their transfer to non-psychiatric carers who do not use
the CNCM (GPs, social workers or residential care work-
ers). In a sensitivity analysis of the BPRS within-patients
analyses, in which only the first five years after baseline
were included, there was no longer an association
between years since baseline and manic excitement and
positive symptoms, while the reduction in depression/
anxiety was stronger (β = -0.09 95% CI = -0.12; -0.04 p <
0.001). In the GAF analyses, the linear gradient was
stronger after including years 1-5 only (β = 1.03 p = 0.001
95% CI = 0.41-1.64 and β = 0.63 p = 0.06 95% CI = -0.03-
1.28, respectively).
One of the observed mechanisms for better functioning
may be improved patient-carer communication through
systematic use of the CNCM and discussions on patient
Figure 2 Graphical presentation of the GAF between-region results. Bars indicate mean GAF scores per stratum (crude) β = change controlled
for age, gender, type of care, level of chronicity * p < 0.05
Drukker et al. BMC Psychiatry 2010, 10:36
/>Page 7 of 10
Table 2: BPRS-sumscores in two regions in South Limburg, where baseline is the moment of the start of the CNCM in
region 2004: descriptives and regression results (Only baseline and yearly evaluation assessments were included, to avoid
bias)
Descriptives Regression results
REGION Baseline 1 year
follow-up
≥ 2 year
follow up
1 year vs
baselinea,
β (95% CI)
2-3year vs
baselinea,
β (95% CI)
Difference in difference
= interaction termb
number of
subjects
1998 172 (175) 107 (107) 60(56)
(assessments) 2004 393(380) 251(248) 205(196)
BPRS manic
excitement,
mean (sd)
1998 1.32 (0.37) 1.62 (0.67) 1.58 (0.82) 0.38
(-0.15; 0.91)
0.49
(-0.45; 1.42)
1 yr β = -0.52
p = 0.11
New patients 2004 1.55 (0.88) 1.41 (0.71) 1.43 (0.52) -0.13
(-0.49; 0.22)
0.04
(-1.00;1.07)
2-3 yr β = -0.34
p = 0.5
BPRS manic
excitement,
mean (sd)
1998 1.28 (0.49) 1.26 (0.42) 2.00 (1.78) 0.14
(-0.31; 0.58)
0.62
(0.004;1.24)*
1 yr β = -0.17
p = 0.5
2-3 years in care 2004 1.53 (0.72) 1.49 (0.58) 1.24 (0.32) -0.04
(-0.32;0.24)
-0.13
(-0.46-0.20)
2-3 yr β = -0.75
p = 0.04
BPRS manic
excitement,
mean (sd)
1998 1.67 (0.79) 1.77 (0.87) 1.69 (0.83) 0.08
(-0.07; 0.23)
-0.03
(-0.22; 0.15)
1 yr β = -0.03
p = 0.7
Chronic patients 2004 1.64 (0.75) 1.63 (0.77) 1.79 (0.85) 0.04
(-0.06; 0.14)
0.18
(0.07; 0.29)*
2-3 yr β = 0.21
p = 0.054
BPRS positive
symptoms,
mean (sd)
1998 1.99 (1.10) 1.91 (0.97) 2.12 (1.33) -0.03
(-0.13;0.06)
b
0.12
(0.02; 0.23)c
χ
2
= 0.16
p = 0.92
2004 1.88 (1.00) 1.78 (0.94) 2.00 (1.09) -0.03
(-0.13;0.06)
b
0.12
(0.02; 0.23)c
BPRS negative
symptoms,
mean (sd)
1998 1.84 (0.95) 1.80 (0.83) 1.90 (0.98) 0.02
(-0.14;0.18)
-0.09
(-0.29; 0.12)
χ2 = 8.95 p = 0.011
2004 1.72 (0.75) 1.71 (0.83) 1.94 (1.08) 0.02 (-
0.08;0.13)
0.36
(0.11; 0.62)
BPRS
depression/
anxiety, mean
(sd)
1998 2.40 (1.11) 2.96(0.89) 1.25 (0.35) 0.56
(-0.19; 1.33)
-0.30
(-1.65; 1.06)
1 yr β = -1.23
p = 0.008
New patients 2004 2.69 (1.20) 1.80 (1.00) 2.44 (1.30) -0.67
(-1.17;-
0.17)**
0.71
(-0.78; 2.20)
2-3 yr β = 0.14
p = 0.85
Drukker et al. BMC Psychiatry 2010, 10:36
/>Page 8 of 10
needs. A French study showed that communication
between patient and professional carer can be beneficial
[7,24]. The use of the 2-COM (a simple patient-reported
questionnaire on 20 perceived need domains) in treat-
ment plans was associated with higher satisfaction with
care at the 12-month follow-up, and treatment change
was more likely in patients with more reported needs. A
multicenter study also showed associations between cli-
nician use of DIALOG (a tool to discuss 11 domains of
needs) and improvement in quality of life and unmet
needs for care after 12 months, but no change in symp-
tom levels [8]. The inconclusive result with respect to
symptom levels is in agreement with the between-region
findings with respect to GAF psychopathology. The
authors stressed the positive implication of this finding,
namely that quality of life can be improved even when
symptoms remain unchanged [8]. Neither of the above-
mentioned studies included functioning or other global
outcomes [8,24].
It was unfortunately not possible to study the pathways
by which the CNCM is associated with improved func-
tioning. It is possible that what mediates this effect is the
professional carer's attention to the patient and to the
whole range of the patient's problems, rather than a
change in treatment itself. This has been called the Haw-
thorne effect [25]. In RCTs, researchers try to eliminate
this factor, because patients do not get the same amount
of attention in real-life clinical practice. The CNCM,
however, is not a research setting but part of real life, and
therefore the Hawthorne effect represents a desirable
outcome rather than a nuisance factor. In addition, the
changes in patients' functioning can be a consequence of
differences in the organisation of care after the introduc-
tion of the CNCM. The CNCM was developed to change
health care, and it is beyond the scope of the analyses to
disentangle aspects that co-occurred at the moment of
introduction.
Methodological issues
The strength of the present study is the unique data col-
lection, as real-life observational data were obtained lon-
gitudinally within the treatment process. The
longitudinal design resulted in assessment of need for
care and functional outcomes at various moments over
time.
However, the present study also has its limitations.
First, only patients who had been assessed at least twice
were included in the analyses. Patients who had been
assessed only once, either because they were new to the
service or had been discharged before the second assess-
ment, showed less severe symptoms. Thus, results are
representative only of the more severe subgroup within
the SMI patient group.
Second, because clinicians have limited time to fill in
CNCM forms, brief instruments were selected. A full
research paradigm might have opted for more extensive
instruments. The GAF, which in our application consists
of only two ratings (psychopathology and impairment), is
recognised as a valid and comprehensive measure of
social functioning when used in routine clinical practice
[17,18] and in research [17,26]. However, it has been
BPRS
depression/
anxiety, mean
(sd)
1998 2.70 (1.11) 2.30 (1.15) 2.70 (1.27) -0.22
(-0.84; 0.40)
0.62
(-0.27; 1.50)
1 yr β = -0.02
p = 0.96
2-3 years in care 2004 2.53 (1.16) 2.39 (1.12) 2.34 (1.27) -0.24
(-0.64;0.17)
-0.17
(-0.64; 0.30)
2-3 yr β = -0.78
p = 0.13
BPRS
depression/
anxiety, mean
(sd)
1998 2.30 (1.08) 2.31 (0.98) 2.45 (1.16) -0.004
(-0.22;0.21)
0.05
(-0.22; 0.31)
1 yr β = 0.14
p = 0.27
Chronic patients 2004 2.51 (1.18) 2.34 (1.06) 2.44 (1.09) -0.15
(-0.29;-
0.006)*
-0.00
(-0.15; 0.15)
2-3 yr β = -0.05
p = 0.75
a
After controlling for confounders
b
Is the regression coefficient in REGION-2004 significantly different from the regression coefficient in REGION-1998?
c
Because the interaction region * (year since start in REGION-2004) was not statistically significant, this term was deleted from the regression
model and, therefore, differences between baseline and follow up are exactly the same in both regions.
*p < 0.05
**p < 0.01
Table 2: BPRS-sumscores in two regions in South Limburg, where baseline is the moment of the start of the CNCM in
region 2004: descriptives and regression results (Only baseline and yearly evaluation assessments were included, to avoid
bias) (Continued)
Drukker et al. BMC Psychiatry 2010, 10:36
/>Page 9 of 10
reported that reliability is only fair when the GAF is
scored by clinicians rather than researchers [27]. In the
CNCM region, professional carers persistently scored
higher than the manual prescribed [9]. The GAF is
intended to be a self-explanatory instrument and raters
are almost never trained in its use. The actual knowledge
of the instructions is poor and raters are often misled by
confusingly defined anchors. In addition, GAF instruc-
tions may be incomplete [16]. Nevertheless, research
indicates that precision of GAF-scores at the group level
is sufficient [27]. The relatively large number of patients
in the CNCM database makes analysis of changes over
time in a group of patients more reliable than the individ-
ual crude scores, and therefore validity is not at risk in
these group-level comparisons. A sensitivity analysis of
the within-subjects analyses using data collected after all
participating clinicians had received extensive training in
GAF scoring (i.e. after July 2007) yielded very similar
results. In the between-region analyses, numbers were
lower and the second follow-up year (n = 6 in both
regions) may have yielded unreliable results. In addition,
overall measures such as the GAF have been reported to
be more sensitive to change than symptom dimensions
[28]. This is in agreement with the present results: associ-
ations with GAF scores were stronger compared to the
four BPRS dimensions.
Finally, MMI patients were included in the analyses
because they differ only marginally from SMI patients.
Post-hoc analyses that excluded this MMI group yielded
very similar results. In the within-patient analyses, the
results on GAF impairment were stronger.
Conclusions
The present results suggest that the use of the CNCM in
treatment has the potential to improve global outcomes.
However, the results need to be replicated.
Abbreviations
BPRS: Brief Psychiatric Rating Scale; CAN: Camberwell Assessment of Need;
CNCM: Cumulative Needs for Care Monitor; GAF: Global Assessment of Func-
tioning; MMI: Moderately Mental Ill; sd: Standard Deviation; SMI: Severe Mental
Illness.
Competing interests
The authors declare that they have no competing interests.
Authors' contributions
MD performed the analyses and wrote the paper. JvO, MB and PhD contrib-
uted during interpretation of the analyses and edited various drafts of the
paper. JvO and PhD are scientific coordinators of the CNCM. JaC implements
the CNCM in his region/institution and edited the final draft of the paper. The
final version has been read and approved by all authors.
Acknowledgements
We gratefully acknowledge the financial support provided by ZonMW (Nether-
lands Organization for Health Research and Development) for the E-Tail study.
The authors are grateful to all mental health care and CNCM helpdesk workers
in the South Limburg region: all were involved in administering CNCM forms
for use in the individual treatment of patients, with data collection as a 'side
effect'.
Author Details
1
Department of Psychiatry and Psychology, School for Mental Health and
NeuroScience MHeNS, Maastricht University, The Netherlands,
2
Division of
Psychological Medicine, Institute of Psychiatry, De Crespigny Park, Denmark
Hill, London, UK and
3
Integrated Care Division, Mondriaan, South-Limburg,
John F Kennedylaan 301 Heerlen, The Netherlands
References
1. Drukker M, Van Dillen K, Bak MLFJ, Mengelers R, Van Os J, Delespaul PAEG:
The use of the Camberwell Assessment of Need in treatment: what
unmet needs can be met? Soc Psychiatr Epidemiol 2008, 43(5):410-417.
2. McGurk SR, Mueser KT: Cognitive functioning and employment in
severe mental illness. J Nerv Ment Dis 2003, 191(12):789-798.
3. Burke-Miller JK, Cook JA, Grey DD, Razzano LA, Blyler CR, Leff HS, Gold PB,
Goldberg RW, Mueser KT, Cook WL, et al.: Demographic characteristics
and employment among people with severe mental illness in a
multisite study. Community Ment Health J 2006, 42(2):143-159.
4. Honkonen T, Stengard E, Virtanen M, Salokangas RK: Employment
predictors for discharged schizophrenia patients. Soc Psychiatr
Epidemiol 2007, 42(5):372-380.
5. Delespaul PAEG, Van Os J: (F)ACT-planning met een schone lei voor
mensen met een ernstige psychiatrische aandoening. In Assertive
Community Treatment Edited by: Kroon C. Nijmegen: Cure & Care
Publishers; 2005:19-41.
6. Wennink HJ: Zorgverschraling in het APZ. Trimbos 1998:27.
7. Van Os J, Altamura AC, Bobes J, Gerlach J, Hellewell JS, Kasper S, Naber D,
Robert P: Evaluation of the Two-Way Communication Checklist as a
clinical intervention. Results of a multinational, randomised controlled
trial. Br J Psychiatry 2004, 184:79-83.
8. Priebe S, McCabe R, Bullenkamp J, Hansson L, Lauber C, Martinez-Leal R,
Rossler W, Salize H, Svensson B, Torres-Gonzales F, et al.: Structured
patient-clinician communication and 1-year outcome in community
mental healthcare: cluster randomised controlled trial. Br J Psychiatry
2007, 191:420-426.
9. Drukker M, Bak MLFJ, À Campo J, Driessen G, Van Os J, Delespaul PAEG:
The Cumulative Needs for Care Monitor (CNCM), a unique monitoring
system in the South of The Netherlands. Soc Psychiatr Epidemiol 2010,
45(4):475-485.
10. Drukker M, Bak M, Driessen G, Van Os J, Delespaul PAEG: Is zorgbehoefte
gemeten met de "Camberwell Assessment of Need" vragenlijst een
voorspeller voor (veranderingen in) zorgconsumptie? [Can the
"Camberwell Assessment of Need" predict changes in care
consumption?]. Tijdschr Psychiatr 2007, 49(5):305-314.
11. Wiersma D, Brink R van den, Wolters K, McCabe R, Bullenkamp J, Hansson
L, Lauber C, Martinez-Leal R, Rossler W, Salize H, et al.: Individual unmet
needs for care: are they sensitive as outcome criterion for the
effectiveness of mental health services interventions? Soc Psychiatr
Epidemiol 2008.
12. Phelan M, Slade M, Thornicroft G, Dunn G, Holloway F, Wykes T, Strathdee
G, Loftus L, McCrone P, Hayward P: The Camberwell Assessment of
Need: the validity and reliability of an instrument to assess the needs
of people with severe mental illness. Br J Psychiatry 1995,
167(5):589-595.
13. Slade M, Thornicroft G, Loftus L, Phelan M, Wykes T: CAN: Camberwell
Assessment of Need. A comprehensive needs assessment tool for
people with severe mental illness. London: Gaskell; 1999.
14. Ventura J, Nuechterlein KH, Subotnik KL, Gutkind D, Gilbert EA: Symptom
dimensions in recent-onset schizophrenia and mania: a principal
components analysis of the 24-item Brief Psychiatric Rating Scale.
Psychiatry Res 2000, 97(2-3):129-135.
15. American Psychiatric Association: Diagnostic and statistical manual of
mental disorders (DSM IV). 4th edition. Washington DC: American
Psychiatric Association; 1994.
16. Ramirez A, Ekselius L, Ramklint M: Axis V - Global Assessment of
Functioning scale (GAF), further evaluation of the self-report version.
Eur Psychiatry 2008, 23(8):575-579.
17. Jones SH, Thornicroft G, Coffey M, Dunn G: A brief mental health
outcome scale-reliability and validity of the Global Assessment of
Functioning (GAF). Br J Psychiatry 1995, 166(5):654-659.
Received: 14 August 2009 Accepted: 25 May 2010
Published: 25 May 2010
This article is available from: 2010 Drukker et al; licensee BioMed Central Ltd. This is an Open Access article distributed under the terms of the Creative Commons Attribution License ( which permits unrestricted use, distribution, and reproduction in any medium, provided the original work is properly cited.BMC Psychiatry 2010, 10:36
Drukker et al. BMC Psychiatry 2010, 10:36
/>Page 10 of 10
18. Tungstrom S, Soderberg P, Armelius BA: Relationship between the
Global Assessment of Functioning and other DSM axes in routine
clinical work. Psychiatr Serv 2005, 56(4):439-443.
19. Ruggeri M, Leese M, Thornicroft G, Bisoffi G, Tansella M: Definition and
prevalence of severe and persistent mental illness. Br J Psychiatry 2000,
177:149-155.
20. Slade M, Powell R, Strathdee G: Current approaches to identifying the
severely mentally ill. Soc Psychiatr Epidemiol 1997, 32(4):177-184.
21. Drake RE, Wallach MA, McGovern MP: Future directions in preventing
relapse to substance abuse among clients with severe mental illnesses.
Psychiatr Serv 2005, 56(10):1297-1302.
22. StataCorp: Stata Statistical Software. 9.2th edition. Texas: College Station
TX: Stata Corporation; 2006.
23. Snijders T, Bosker R: Multilevel analysis an introduction to basic and
advanced modeling. London: SAGE Publications; 1999.
24. Robert PH, Michel E, Van Os J, Altamura AC, Bobes J, Gerlach J, Hellewell
JS, Kasper S, Nabel D: [2-COM: presentation of an instrument facilitating
communication between physicians and carers in daily practice].
Encephale 2007, 33(1):60-64.
25. McCarney R, Warner J, Iliffe S, van Haselen R, Griffin M, Fisher P: The
Hawthorne Effect: a randomised, controlled trial. BMC medical research
methodology 2007, 7:30.
26. Startup M, Jackson MC, Bendix S: The concurrent validity of the Global
Assessment of Functioning (GAF). Br J Clin Psychol 2002, 41(Pt
4):417-422.
27. Soderberg P, Tungstrom S, Armelius BA: Reliability of global assessment
of functioning ratings made by clinical psychiatric staff. Psychiatr Serv
2005, 56(4):434-438.
28. Endicott J, Spitzer RL, Fleiss JL, Cohen J: The global assessment scale. A
procedure for measuring overall severity of psychiatric disturbance.
Arch Gen Psychiatry 1976, 33(6):766-771.
Pre-publication history
The pre-publication history for this paper can be accessed here:
/>doi: 10.1186/1471-244X-10-36
Cite this article as: Drukker et al., Systematic monitoring of needs for care
and global outcomes in patients with severe mental illness BMC Psychiatry
2010, 10:36