Báo cáo y học: " Genetic influences on attention deficit hyperactivity disorder symptoms from age 2 to 3: A quantitative and molecular genetic investigation" potx
Bạn đang xem bản rút gọn của tài liệu. Xem và tải ngay bản đầy đủ của tài liệu tại đây (301.47 KB, 9 trang )
RESEARC H ARTIC LE Open Access
Genetic influences on attention deficit
hyperactivity disorder symptoms from age
2 to 3: A quantitative and molecular
genetic investigation
Nicholas E Ilott
1*
, Kimberly J Saudino
2
, Philip Asherson
1
Abstract
Background: A twin study design was used to assess the degree to which additive genetic variance influences
ADHD symptom scores across two ages during infancy. A further objective in the study was to observe whether
genetic association with a number of candidate markers reflects results from the quantitative genetic analysis.
Method: We have studied 312 twin pairs at two time-points, age 2 and age 3. A composite measure of ADHD
symptoms from two parent-rating scales: The Child Behavior Checklist/1.5 - 5 years (CBCL) hyperactivity scale and
the Revised Rutter Parent Scale for Preschool Children (RRPSPC) was used for both quantitative and molecular
genetic analyses.
Results: At ages 2 and 3 ADHD symptoms are highly heritable (h
2
= 0.79 and 0.78, respectively) with a high level
of genetic stability across these ages. However, we also observe a significant level of genetic change from age 2 to
age 3. There are modest influences of non-shared environment at each age independently (e
2
= 0.22 and 0.21,
respectively), with these influences being largely age-specific. In addition, we find modest association signals in
DAT1 and NET1 at both ages, along with suggestive specific effects of 5-HTT and DRD4 at age 3.
Conclusions: ADHD symptoms are heritable at ages 2 and 3. Additive genetic variance is largely shared across
these ages, although there are significant new effects emerging at age 3. Results from our genetic association
analysis reflect these levels of stability and change and, more generally, suggest a requirement for consideration of
age-specific genotypic effects in future molecular studies.
Background
Attention Deficit Hyperactivity Disorder (ADHD) is a
common neurodevelopmental disorder characterised by
pervasive, age inappropriate behaviours of inattention,
hyperactivity and impulsivity. The current definition of
ADHD defines the age of onset of impairing symptoms
as occurring before the age of 7 years, although formal
diagnoses are not usually made before this age. How-
ever, early characteristics are good predictors of later
appearing behavioural problems [1] and therefore,
employing research strategies to identify developmental
aetiological factors in young children remains important.
It is well established t hat ADHD in children is highly
heritable with estimates averaging at ~76% [2], with the
same being true of ADHD symptoms in pre-school chil-
dren [3]. However, genetic variation underlying these
observed heritabilities is still not well understood.
Candidate gene studies in children have focused pre-
dominantly on genes of monoaminergic neurotransmit-
ter systems, particularly dopamine. The main genes of
interest in this research have been the dopamine trans-
porter gene ( DAT1) and dopamine receptor genes
(DRDs). These choices hav e been i nformed by a dopa-
mine hypothesis of ADHD, which stems from the action
of stimulant medications such as methylphenidate and
dexamphetamine which increase levels of available
synaptic dopamine. These studies have proven relatively
* Correspondence:
1
SGDP Research Centre, Institute of Psychiatry, Kings College, London, UK
Full list of author information is available at the end of the article
Ilott et al. BMC Psychiatry 2010, 10:102
/>© 2010 Ilott et al; licensee BioMed Central Ltd. This is an O pen Access article distributed under the te rms of the Creative Commons
Attribu tion License ( which permits unrestricted use, distribution, and repro duction in
any medium, provided the original work is properly cited.
fruitful with robust associations between DRD4 and
DRD5 with ADHD being identified in meta-analysis [4].
More recently, whole genome association a nalyses in
both children and adults have provided some informa-
tion on potential new candidates for follow up [5-7]. Of
particular interest is the convergent finding of associa-
tion with variants within CDH13, a gene that lies within
the ADHD linkage region on chromosome 16p [5,8].
This has provided new insights into the underlying
genetics of ADHD and has allowed for new hypotheses
to be formed for future research. However, t here have
been fewer molecular studies in preschool children,
although there is some evidence to suggest that candi-
date genes from various neurotransmitter systems such
as DAT1, synaptosome-associated Protein 25 (SNAP25)
and the noradranaline transporter (NET1)mayhave
some involvement [9].
It is apparent that these genes are not necessarily act-
ing on the ADHD phenotype consistently throughout
development, with a number of studies suggesting that
although there is a general genetic stability a cross time
from ages 2 t hrough to 4 years [10]; 2, 3, 4 and 7 years
[11]; 3 through 12 years [12] and 8 through to 14 years
[13], there is also age-specific genetic variance. The
implications of this are that association studies using
heterogeneous samples are potentially losing informa-
tion on age-specific effects of genotype on ADHD.
Further, with the need for rep lication across studies it
becomes very difficult to identify the causes of non-
replication due to differences in sample demographics.
We have recently reported high heritability and
genetic association between specific risk alleles and
ADHD symptom scores in a population sample of 2-
year old twins, with modest evidence of association
being found for DAT1 and NET1 [14]. In the present
analysis we have used the same sample to assess the
degree to which genetic effects on ADHD symptoms are
stable from ages 2 to 3 using quantitative genetic techni-
ques. In addition to this analysis, we have studied pre-
viously reported ADHD risk allel es to identify any age-
specific genetic associations. Candidate gene variants
were chosen based on previous positive association with
ADHD in either clinical or quantitative trait locus
(QTL) analyses. Given the nature of the analyses we
hypothesised that there would be substantial genetic
overlap in ADHD symptom scores across ages, which
would translate into a number of genetic variants at age
2 also being associated at age 3.
Method
Sample
TheBostonUniversityTwinProjectsamplewas
recruited f rom birth records supplied by the Massachu-
setts Registry of Vital Records. Ethical approval was
obtained for the study through the joint South London
and Maudsley a nd the Institute of Psychiatry NHS
Research Ethics Committee ref. 2002/238. Twins were
selected preferentially for higher birth weight and gesta-
tional age. No twins with birth weights belo w 1750
grams or with gestationa l ages less than 34 we eks were
included in the study. Twins were also excluded if one
or both twins had a health problem that might affect
motor activity (e.g., cerebral palsy, club foot) or had
chromosomal abnormalities. The present analyses
include 312 same-sex pairs of twins (144 MZ, 168 DZ;
164 male pa irs , 148 female pairs). Although the samp le
was predominately Caucasian (85.4%), ethnicity was gen-
erally representative of the Massachusetts population
(3.2% Black, 2% Asian, 7.3% Mixed, 2.2% Other). Socioe-
conomic status according to the Hollingshead Four Fac-
tor Index (1975) ranged from low to upper middle class
(range = 20.5-66; M = 50.9, SD = 14.1).
Zygosity was determined via DNA analys is using DNA
obtained from cheek swab samples. In the cases where
DNA was not available (n = 3), zygosity was determined
using parents’ responses on ph ysical similarity question-
naires which have been shown to be more than 95%
accurate when compared to DNA markers [15]. In our
present sample we were able to assign zygosity with cer-
tainty to 99% of the twin pairs using the parent ques-
tionnaire, moreover agreement between questionnaire
and DNA zygosity analyses was very high (kappa = .94).
Parent Reports of ADHD Behaviour
Written informed consent was obtained from parents
and they were invited to assess their children’sbeha-
viour at two time points; 1) within two weeks of their
second birthday and 2) within two weeks of their third
birthday. The mean age at time point 1 was 2.07 years
(SD = 0.05) and at time point 2 it was 3.05 (SD = 0.05).
Parent ratings of hyperactivity were obtained from
either parent using the hyperactivity subscales of the
Child Behavior Checklist/1.5 - 5 years (CBCL) [16] and
the Revised Rutter Parent Scale for Preschool Children
(RRPSPC) [17] which assess behaviors relating to over-
activity, inattention, and impulsivity. Of th e total sample
94% mothers and 6% father s completed the question-
naires, with the same parent completing the question-
naireatbothages.Inthepresentstudyreliabilitiesfor
the CBCL and the RRPSPC, as estimated by Cronbach’s
alpha were .78 and .75, respectively. The two ADHD
measures correlated significantly at both time points
(age 2, r = 0.67,p<0.01andage3,r = 0.65, p < 0.01;
data based on 312 individuals). These measures also dis-
play high genetic correlations at both ages (age 2 rG =
0.71, age 3 rG = 0.76, analyses are available on request
from first author). Scores from these measures were
subsequently averaged to form an ADHD composite
Ilott et al. BMC Psychiatry 2010, 10:102
/>Page 2 of 9
measur e, which was square root transformed for a more
normal distribution.
Model Fitting Analysis
Because twin co-variances can be inflated by variance
due to sex, all sc ores were residualised for sex effects.
Residualised scores were used for all model fitting
procedures.
A Cholesky decompositon model was used to esti-
mate the relative contributions of additive genetics (A),
shared environment (C) and non-shared environment
(E) to the phenotypic variance of ADHD at each age,
as well as genetic and environmental contributions to
the co-variation between ages. Models were fit to raw
data using a maximum likelihood pedigree approach
implemented in Mx structural equat ion modelling soft-
ware [18]. The overall fit of a model was assessed by
calculating twice the difference between the negative
log-likelihood (-2LL) of the model and that of a satu-
rated model (i.e., a model in which the variance/covar-
iance structure is not estimated and all variances and
covariances for MZ and DZ twins are estimated).
Genotyping
Polymorphisms were chosen based on previous associa-
tion with ADHD in either clinical or QTL studies
(Table 1). DNA was extracted from buccal swabs as
described by Freeman et al. 2003 [19]. Both parents and
offspring were genotyped. VNTR polymorph isms (DRD4
exon 3, DAT1 3’ UTR, DAT1 intron 8, the 5-HTTLPR
and MAOA promoter) were genotyped in-house. Proto-
cols for genotyping t he VNTRs are available on request
from the authors. Single nucleotide polymorphisms
(SNPs) were genotyped by Prevention Genetics http://
www.preventiongenetics.com/resgeno/researchgeno.htm.
Various genotyping quality control measures were
implemented to assess the impact of potential error.
Mendelian discrepancies in the data were checked using
PEDSTATS />QTDT/download/ [20]. The average Mendelian error
rate for the VNTR genotyping was 0.65% with the high-
est rate being for the MAOA promoter VNTR (1.45%).
Where inheritance errors were detected, genotypes for
that family were coded ‘0’.
Eight of the chosen SNPs (rs3776513, rs2042449,
rs138649 3, rs1386497, rs1050565, rs2652511, rs1800955
and rs747302) failed at the stage of assay design. For
the remaining 17 SNPs the average Mendelian error
rate was 1.05%. A breakdown by SNP revealed two
SNPs, rs40184 and rs1843809 that had high Mendelian
error (2.03% and 8.39%, respectively) and these two
SNPs were omitted from further analysis. With these
SNPs removed, the error rate was reduced to 0.47% and
remaining inheritance errors were coded as missing
genotypes for the family/genotype combination. A sec-
ond genotyping control measure was the use of a sex
specific marker. The error associated with sex anomalies
was 0.35%. Along with the specific sex marker, genotyp-
ing error o n X-linked markers (MAOA promoter
VNTR and rs6323) gave an additional sex discrepancy
error of 0.008%. A further quality control measure was
through genotyping 96 random duplicates. Only 0.02%
of duplicated samples were not consistent with the ori-
ginal genotype . Taken together, ge notyping error wa s
estimated to be 1.5% plus hidden error. Hidden error
can be considered as 1/3 total genotyping error. With
additional, hidden genotyping error included, the geno-
type error rate including both detected and undetected
errors may be as high as 4.5%. All markers included in
the analysis conformed to Hardy-Weinberg equilibrium
(p > 0.01).
Table 1 Genetic markers chosen for genotyping and
position in the genome (chromosome and respective
chromosomal position in bp) based on UCSC May 2004
Human assembly.
Gene Marker Chromosome Position (bp)
DRD4 rs1800955[26] 11 626,534
rs747302[26] 11 626,439
Exon 3 VNTR[4,27,28] 11 629,989-630,194
DAT1 3’UTR VNTR[29] 5 1,446,697-1,447,100
rs40184[30] 5 1,448,327
rs3776513[30] 5 1,459,854
Intron 8 VNTR[30,31] 5 1,464,856-1,465,037
rs2042449[30] 5 1,469,396
rs2652511[30] 5 1,499,139
rs11564750[30] 5 1,501,012
rs2550946[30] 5 1,503,763
SNAP25 rs6039806[32] 20 10,206,904
rs362987[32] 20 10,225,702
rs3746544[33-35] 20 10,235,334
rs1051312[33,34] 20 10,235,338
5-HTT rs11080121[36] 17 25,553,218
rs140701[37] 17 25,562,908
rs2020936[36] 17 25,574,940
rs2066713[36] 17 25,576,041
rs1050565[37] 17 25,599,952
5-HTTLPR[37] 17 25,588,361 - 25,588,889
MAOA rs6323[37,38] X 43,347,040
Promoter VNTR[39,40] X 43,270,603 - 43,270,707
NET1 rs11568324[30,41] 16 54,283,809
rs3785157[42,43] 16 54,287,587
rs998424[42,43] 16 54,289,697
rs2242447[43] 16 54,293,663
TPH2 rs1843809[30,44] 12 70,635,215
rs1386493[30,44] 12 70,641,196
rs1386497[30,44] 12 70,678,307
Ilott et al. BMC Psychiatry 2010, 10:102
/>Page 3 of 9
Association Analysis
Tests of allelic association were performed using the
Quantitative Transmission Disequilibrium Test (QTDT)
[20] on ADHD scores residualised for sex effects. An
advantage of using QTDT in association analyses using
twin data is that all families remain informative regard-
less of twin class. QTDT tests for association in a var-
iance components framework and using the -weg
command in the program, one can model the phenoty-
pic similarities that are due to sharing of the genome
(polygenic (g), 100% for MZ twins and 50% for DZ
twins), as well as phenotypic differences that are due to
non-shared environmental influences (e). Three models
of association w ere tested u sing a likelihood ratio test
implemented in QTDT: the ‘ Total Association’ test
(AT), the ‘Within-Test’ of association (AW) and the test
of stratification (AP). These different models provide the
user with varied information regarding association sta-
tis tics and tests of stra tification. Overall association was
tested using the AT model which assesses both the
within-pair differences as well as between-pair sums (i.e.
the correlation between phenotypic and genotypic differ-
ences and sums for each twin pair) and is the most
powerful test in the absence of stratification effects. In
contrast, the AW assesses the within component only.
The within-pair design of the AW means that it is unaf-
fected by between-family stratification effects, yet is less
powerful than the AT in the absence of stratification.
Based on the differences between these two models, the
significance of association should consider stratification
effects. To evaluate this we modelled association using
the AP test which compares the significa nce from the
between component versus the within component of
association. Stratification effects are dismissed w hen
these components are equal and p > 0.05. In this
instance, results are interpreted from the AT. Conver-
sely, results are interpreted from the AW if significant
stratification effects are detected. VNTR marke rs were
tested using the ‘multi-allelic’ function in QTDT. This
provides a single p-value for tests of alleles with an allele
frequency >0.05.
UNPHASED />frank/software/unphased/ was used to test X-linked
markers (polymorphisms in MAOA) because QTDT
cannot deal with such data. Because UNPHASED has
no means for handling MZ twin data, mean phenotypic
scores for MZ pairs were used in these analyses.
Results
Descriptive statistics for the measures analysed in this
sample are presented in Table 2. Intraclass correlations
at both ages displayed DZ correlations that were roughly
half MZ correlations, inferring predominantly additive
genetic effects (Table 3). When compared to a saturated
model, the fit of the data to the Cholesky decomposition
model was not significantly different (c
2
= 13.85, df =
11, p = 0.24, Table 4). The majority of the variance for
ADHD symptoms at ages 2 and 3 was explained by
additive genetic influences, producing estimates for A of
0.78 (95%CI 0.65 - 0.83) and 0.79 (95%CI 0.65 - 0.8 4)
(Table 3), respectively. Ther e were no significant effects
of C on the trait variance at either age (Table 3), with
no detriment in fit when this parameter was dropped
from the model (c
2
=0,df=3).Thereweremodest
effects of E at both ages (age 2, E = 0.22, 95%CI 0.17 -
0.29 and age 3, E = 0.21, 95%CI 0.16 - 0.27).
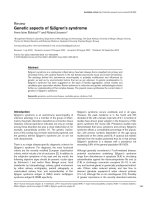
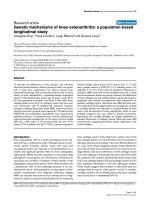
From the Cholesky decomposition model (Figure 1)
we can estimat e the degree to which A, C and E contri-
bute to the co-variance of ADHD symptoms across
time. C has been omitted from Figure 1 because of the
lack of significant C on the variance at either age. All
path estimates are provided from the most parsimonious
AE model.
A large proportion of the additive genetic variance at
age 2 was shared with that at age 3 (Figure 1), although
there remained emerging age-specific effects (Figure 1).
Indeed, dropping the age 3-specific A path from the Cho-
lesky decomposition model resulted in a significant wor-
sening in fit (c
2
= 12.263, df = 1, p < 0.01), suggesting a
contribution of genetics to both phenotypic stability and
change. The effect of E on the covariation between ages
was small, yet significant (Figure 1). Using unsquared
path estimates from the Cholesky decomposition model,
we can estimate the correlation between ADHD symp-
toms at age 2 and 3. In t his case t he phenotypic correla-
tion between ages is calculated as (√0.79 × √0. 48) +
(√0.21 × √0.01) = 0.67. Additive genetic influences
account for 93% of this correlation (bivariate heritability
=((√0.79 × (rG = 0.78) × √0.79)/0.67) × 100 = 93%).
Molecular Genetic Analysis
Total Test of Association (AT)
At age 2, nominal association was detected between the
DAT1 3’UTR VNTR (c
2
= 7.00, df = 2, p = 0.03) and one
NET1 SNP, rs11568324 (c
2
=4.38,df=1,p=0.04)with
the ADHD composite (Table 5). Two additional SNPs in
NET1, rs3785157 (c
2
=3.68,df=1,p=0.06)and
Table 2 Descriptive statistics for ADHD scale raw scores.
CBCL ADHD scale RRPSPC scale ADHD Composite*
Mean (age 2) 4.28 2.10 1.21
SD (age 2) 2.57 1.89 0.37
Mean (age 3) 3.99 2.12 1.16
SD (age 3) 2.64 1.91 0.39
N = 312; each mean and SD calculated through a random selection of one
twin from each pair. *Scores residualised for sex effects and square-root
transformed.
Ilott et al. BMC Psychiatry 2010, 10:102
/>Page 4 of 9
rs998424 (c
2
=3.30,df=1,p=0.07)andaSNPin5-
HTT, rs140701 (c
2
=2.96,df=1,p=0.09)provided
weak evidence of association with this measure (Table 5).
At age 3, nominal association was detected between
the same DAT1 polymorphism (c
2
= 11.15, df = 2, p =
0.004) as at age 2, as well as the DRD4 exon 3 VNTR
(c
2
= 7.82, df = 3, p = 0.05).
Given the non-independent nature of the phenotypes
under investigation, we did not correct any of the associa-
tion findings for the number of phenotypes studied. None
of the associations at either age withstood Bonferroni cor-
rection for 20 comparisons (20 markers) at p < 0.05.
Within Test of Association
At age 2 we found no evidence for stratification effects
(AP test, data not shown), although it cannot be ruled
out due to low power to detect it in this sample. We
therefore completed the AW test for all genetic markers,
which is robust to stratification effects. Two SNPs in
NET1, rs3785157 (c
2
=4.65,df=1,p=0.03)and
rs998424 (c
2
= 4.42, df = 1, p = 0.04) showed nominal
significance in this test with the ADHD composite,
although high linkage disequilibrium (LD) between
theseSNPssuggestsnon-independence.Further,the
DAT1 3’ UTRVNTR(c
2
= 5.09, df = 2, p = 0.08) and
rs140701 (c
2
= 3.03, df = 1, p = 0.08) displayed an asso-
ciation trend with the same measure (Table 5).
At age 3 we found evidence for stratification in the AP
test for two markers in NET1, rs3785157 and rs998424
( c
2
=5.42,df=1,p=0.02andc
2
=4.46,df=1,p=
0.03, respectively). Nominal associations were found
with rs3785157 in NET1 (c
2
=4.30,df=1,p=0.04),
rs11080121 in 5-HTT (c
2
= 4.77, df = 1, p = 0.03), the
DAT1 3’UTRVNTR(c
2
= 12.17, df = 2, p = 0.002) and
the DRD4 exon 3 VNTR (c
2
=8.69,df=3,p=0.03)
(Table 5). In addition, rs998424 in NET1 and rs140701
in 5-HTT displayed an association trend (c
2
= 3.22, df =
1, p = 0.07 and c
2
= 3.24, df = 1, p = 0.07, respectively).
rs11568324 was not tested in the AW test due to l ow
minor allele frequency (MAF = 0.01) and subsequent
low numbers of informative twin pairs.
Application of a Bonferroni correction to each nomin-
ally associated marker for a total of 20 comparisons
yielded only t he DAT1 3’ UTRVNTRsignificant(AW
test, p = 0.04).
Discussion
Inthisstudyweinvestigatedthegeneticrelationship
between ADHD symptom scores at two time points in
infancy. Consistent with previous reports we found
ADHD scores to be highly heritable at age 2 and
3 years, providing evidence for the involvement of addi-
tive genetics on the variance of these measures, as well
as identifying them as viable measures for m olecular
studies. Intraclass correlations for our ADHD m easure
were suggestiv e of predominantly addit ive genetic influ-
ences at both ages. However, the literature is mixed
with regards the effects of d ominance and contrast
effects, a feature of ADHD that is often found in sam-
ples of older children [21]. Dominance and contrast
effects are characterized by DZ correlations that are
lower than hal f MZ correlations, and while t here is evi-
dence for dominance in symptoms of overactivity in
young children [22], there is no evidence for these
effects in other studies of activity and attention p ro-
blems [23]. In light of the power needed to detect domi-
nance and contrast effects [24] and given the lack of
evidence for these effects i n this study, we did not for-
mally test for them, although future research in large
samples using similar measures are needed to clarify
this issue.
Phenotypic stability of ADHD symptoms across ages
was moderate, producing inter-age correlations of 0.51 -
0.62 (twin 2 - twin 1), which is consistent with previous
reports using samples of this age range [10]. The sug-
gestion here is that while symptoms are consistent
across ages for the most part, there remains develop-
mental change, which is reflected in the newly emerging
additive genetic variance at age 3, a variance component
that is unaffected by error associated with fluctuations
in evaluations. Prior research has shown a level of
genetic stability on ADHD traits across numerous age
ranges, including very young children [10,11]. Our ana-
lyses concurred with these findings as we found that
genetic effects at age 2 are largely shared with those
Table 3 Intraclass correlations (95%CI) and variance components estimates (95%CI).
rMZ rDZ ACE
ADHD
Composite Age 2 0.77 (0.69 - 0.83) 0.34 (0.19 - 0.47) 0.79 (0.65 - 0.84) 0.00 (0.00 - 0.11) 0.21 (0.16 - 0.27)
ADHD
Composite Age 3 0.74 (0.65 - 0.80) 0.32 (0.17 - 0.45) 0.78 (0.65 - 0.83) 0.00 (0.00 - 0.13) 0.22 (0.17 - 0.29)
Table 4 Fit statistics for the overall fit of the longitudinal
Cholesky decomposition model.
Overall Fit of Model
Model -2LL df Δc
2
Δdf AIC p
Saturated 484.49 1177
Cholesky decomposition 498.34 1189 13.85 11 -8.15 0.24
Ilott et al. BMC Psychiatry 2010, 10:102
/>Page 5 of 9
act ing at age 3. The suggestion here is that genetic var-
iation that influences variance in ADHD scores at age 2
will be the same as those acting at age 3, on the most
part. Having said that, unique effects of additive genetics
at age 3 are significant, so while there is substantial
genetic continuity across ages, emerging effects cannot
be ignored. Unfortunately a limitation of this study was
the limited power to assess sex × gene interaction
effects in the quantitative analysis. This is an interesting
area of research and one that should be considered in
future research with more powerful samples, although at
present there is littl e evidence for gene × sex interac-
tion, at least in symptoms of overactivity [22].
Given the results from our quantitative analysis, it is
interesting to consider the results of our molecular
genetic analyses. At age 2, we found modest, nominally
significant (p < 0.05) associations with four variants
(DAT1 3’ UTR VNTR, rs11568324, rs3785157 and
rs998424). Although there were some associations in
common at age 3 (DAT1 3’UTR VNTR and rs3785157),
the association between ADHD scores and r s11568324
at age 2 did not replicate at age 3. Further, an age-3-
speci fic association was observed with the DRD4 exon 3
VNTR and one SNP in 5-HTT (rs11080121), findings
that are consistent with our quantitative genetic results.
Although suggestive at this stage, these findings high-
light problems of age-specific genotypic effects that may
occur in demographically heterogeneous samples. We
may speculate that these differences in genetic associa-
tion are due to new effects emerging at age 3, implying
developmental specificity in which phenotypic conse-
quences of DNA polymorphisms are effectively masked
until a particular developmental stage is reached. There
are, however, alternative explanations. It might be that
subtle differences in ratings between ages causes some
manner of spurious association at either age indepen-
dently, an issue that relates largely to the power of t he
sample and increases the chance of type I and II errors.
In any case, from our analyses it is apparent that there
are age-specific effects of genotype on ADHD symptom
scores and is thus a factor that should be considered in
genetic studies.
An interesting comparison to be drawn is one
between this study and an analysis carried out by Mill
et al. [9], who conducted a similar analysis in a popula-
tion-based twin sample. Although they used a composite
ADHD
Composite Age 2
ADHD
Composite Age 3
EE
AA
√
0.21 (0.16 - 0.27) √0.21 (0.16 -
0.27)
√0.79 (0.73
- 0.84) √0.29 (0.22 -
0.38)
√0.01 (0.00 - 0.04)
√0.48 (0.39 - 0.57)
Figure 1 Cholesky decomposition model showing influences of A (additive genetics) and E (non-shared environment) on the variance
and covariance of ADHD symptoms across age 2 and 3. Squared path estimates (95%CI) are provided.
Ilott et al. BMC Psychiatry 2010, 10:102
/>Page 6 of 9
measure of ADHD symptom scores across 2, 3, 4 and 7
years for the main analysis, they also reported some
individual time-point data. DAT1 was found to be asso-
ciated with ADHD symptoms at ages 2 and 3, and our
report therefore serves as a replication of these findings.
A further point for discussion is the observed differ-
ence between the AT and AW tests of association. At
age 2, rs3785157 and rs998424 were significantly asso-
ciated (nominal p < 0.05) only in the AW test. Given
the increased power of the AT test to detect associatio n
in the absence of stratification, these results may be sur-
prising, and may reflect between-family differences in
child ratings. We are, however, unable to assign this
observation to any stratification effects because of a
non-significant finding in the AP test. This raises issue s
regarding the power of the sample to detect stratifica-
tion and makes it difficult to conclude that there are in
fact any significant differences in the between and
within family components of association. However, of
interest is that at age 3, larger discrepancies in effects of
these two markers were observed between the AT and
AW tests, an observation that is apparent in the AP test
which displays significant evidence of stratification. This
phenomenon is also seen for associations with the
DAT1 3’UTRVNTRandDRD4 VNTR at age 3, where
there is a decrease in p-value in the AW compared to
the AT test, albeit with no significant difference i n the
AP test. Taken together, we conclude that there is evi-
dence for stratification effects, an observation that is not
unique to this study [9] and which may reflect between-
family differences in rating styles. In particular, it is
interesting to note that the pattern of DAT1 3’ UTR
VNTR associations in this study are the same as those
observed by Mill et al. [9]. Both studies display greater
significance for the AT than AW test at age 2, with the
reverse effect at age 3. The suggestion is, therefore, that
there may be new stratification effects emerging at age 3
that could contribute to the obser ved age-specific geno-
typic effects.
A major limitation of this study is the power of the
sample to detect genetic association, especially if we
consider convincing levels of significance to be in the
order of p < 5 × 10
-7
[25]. Using the genetic power cal-
culator we
estimated that the sample had 47% power to detect a
QTL affecting 1% of the phenotypic variance and 71%
power to detect a 5% QTL. Despite being underpow-
ered, we detected nominal significance for a number of
polymorphisms at ages 2 and 3, and although we cannot
rule out the possibility of false positives, the study serves
Table 5 QTDT analysis.
ADHD Composite Age 2 ADHD Composite Age 3
Gene Marker AT AW AT AW
c
2
df P c
2
df P c
2
df p c
2
df p
DRD4 Exon 3 VNTR 4.74 3 0.19 3.26 3 0.35 7.82 3 0.05 8.69 3 0.03
DAT1 3’UTR VNTR 7.00 2 0.03 5.09 2 0.08 11.15 2 0.004 12.17 2 0.002*
Int8 VNTR 3.42 2 0.18 2.84 2 0.24 2.90 2 0.24 3.21 2 0.20
rs11564750 0.06 1 0.80 0.75 1 0.39 0.14 1 0.43 0.01 1 0.94
rs2550946 0.43 1 0.51 0.71 1 0.40 0.16 1 0.47 0.99 1 0.32
SNAP25 rs6039806 0.00 1 0.96 0.00 1 0.99 0.08 1 0.97 0.41 1 0.52
rs362987 0.04 1 0.84 0.07 1 0.79 0.04 1 0.91 0.39 1 0.39
rs3746544 0.05 1 0.83 0.18 1 0.67 1.75 1 0.21 1.98 1 0.16
rs1051312 0.63 1 0.43 0.04 1 0.85 0.00 1 0.58 0.65 1 0.42
5-HTT rs11080121 2.16 1 0.14 2.71 1 0.10 0.12 1 0.23 4.77 1 0.03
rs140701 2.96 1 0.09 3.03 1 0.08 0.00 1 0.38 3.24 1 0.07
rs2020936 1.24 1 0.27 1.92 1 0.17 1.34 1 0.40 1.20 1 0.27
rs2066713 0.04 1 0.84 0.00 11 1.00 1.27 1 0.50 0.32 1 0.57
5-HTTLPR 0.31 1 0.57 0.03 1 0.87 0.03 1 0.87 0.91 1 0.34
MAOA rs6323 NT NT NT 1.03 1 0.31 NT NT NT 0.97 1 0.83
Promoter VNTR NT NT NT 4.68 3 0.20 NT NT NT 0.05 3 0.81
NET1 rs11568324 4.38 1 0.04 NT NT NT 0.58 1 0.13 NT NT NT
rs3785157 3.68 1 0.06 4.65 1 0.03 0.37 1 0.48 4.30 1 0.04
rs998424 3.30 1 0.07 4.42 1 0.04 0.83 1 0.59 3.22 1 0.07
rs2242447 1.23 1 0.27 1.03 1 0.31 3.56 1 0.18 2.01 1 0.16
Nominal p-values < 0.05 are in bold, italicized numbers and those approaching this significance threshold are shown in italics. AT = To tal Test of Association,
AW = Within-Test of Association. NT = Not tested. X-linked markers tested using UNPHASED. df = difference in degrees of freedom between the null and
alternative models. *Significant after bonferroni correction
Ilott et al. BMC Psychiatry 2010, 10:102
/>Page 7 of 9
as a proof of principle, in that age-specific effects of
genotype on behavioural measures is an issue to be
addressed, especially in underpowered samples.
In this study we investigated the genetic relationship
between ADHD symptom scores at age 2 and age 3.
Although we found that the majority of genetic effe cts
were shared across ages, there was room for some age-
specificity. These inferences were borne out in the mole-
cular genetic analyses, whereby associations seen at age
2 replicated at age 3. However, some observed associa-
tions were age-specific, which highlights this issue as an
important one to consider in genetic association studies.
Conclusions
This report indicates that although the majority of
genetic effects on ADHD symptom scores at age 2 are
stable through to age 3, there remains signific ant emer-
ging effects. As well as en abling us to bette r understand
how genes contribute to the aetiology and origin of
ADHD, the report also serves to highlight the impor-
tance of de mograph ic homogeneity in molecular genetic
studies.
Conflict of interests
The authors declare that they have no competing
interests.
Acknowledgements
The BUTP is supported by grant MH062375 from the National Institute of
Mental Health.
Author details
1
SGDP Research Centre, Institute of Psychiatry, Kings College, London, UK.
2
Psychology Department, Boston University, 64 Cummington St., Boston, MA,
USA.
Authors’ contributions
NI carried out the VNTR genotyping, data analysis, and interpretation and
drafted the manuscript. KS designed the study, carried out data collection,
helped with interpretation and helped draft the manuscript. PA helped with
interpretation and helped draft the manuscript. All authors read and
approved the final manuscript.
Received: 18 November 2009 Accepted: 1 December 2010
Published: 1 December 2010
References
1. Caspi A, Henry B, McGee RO, Moffitt TE, Silva PA: Temperamental origins
of child and adolescent behavior problems: from age three to age
fifteen. Child Dev 1995, 66(1):55-68.
2. Faraone SV, Perlis RH, Doyle AE, Smoller JW, Goralnick JJ, Holmgren MA,
Sklar P: Molecular genetics of attention-deficit/hyperactivity disorder. Biol
Psychiatry 2005, 57(11):1313-1323.
3. Price TS, Simonoff E, Waldman I, Asherson P, Plomin R: Hyperactivity in
preschool children is highly heritable. J Am Acad Child Adolesc Psychiatry
2001, 40(12):1362-1364.
4. Li D, Sham PC, Owen MJ, He L: Meta-analysis shows significant
association between dopamine system genes and attention deficit
hyperactivity disorder (ADHD). Hum Mol Genet 2006, 15(14):2276-2284.
5. Franke B, Neale BM, Faraone SV: Genome-wide association studies in
ADHD. Hum Genet 2009, 126(1):13-50.
6. Lasky-Su J, Neale BM, Franke B, Anney RJ, Zhou K, Maller JB, Vasquez AA,
Chen W, Asherson P, Buitelaar J, et al: Genome-wide association scan of
quantitative traits for attention deficit hyperactivity disorder identifies
novel associations and confirms candidate gene associations. Am J Med
Genet B Neuropsychiatr Genet 2008, 147B(8):1345-1354.
7. Neale BM, Lasky-Su J, Anney R, Franke B, Zhou K, Maller JB, Vasquez AA,
Asherson P, Chen W, Banaschewski T, et al: Genome-wide association scan
of attention deficit hyperactivity disorder. Am J Med Genet B
Neuropsychiatr Genet 2008, 147B(8):1337-1344.
8. Zhou K, Dempfle A, Arcos-Burgos M, Bakker SC, Banaschewski T,
Biederman J, Buitelaar J, Castellanos FX, Doyle A, Ebstein RP, et al: Meta-
analysis of genome-wide linkage scans of attention deficit hyperactivity
disorder. Am J Med Genet B Neuropsychiatr Genet 2008, 147B(8):1392-1398.
9. Mill J, Xu X, Ronald A, Curran S, Price T, Knight J, Craig I, Sham P, Plomin R,
Asherson P: Quantitative trait locus analysis of candidate gene alleles
associated with attention deficit hyperactivity disorder (ADHD) in five
genes: DRD4, DAT1, DRD5, SNAP-25, and 5HT1B. Am J Med Genet B
Neuropsychiatr Genet 2005, 133(1):68-73.
10. Price TS, Simonoff E, Asherson P, Curran S, Kuntsi J, Waldman I, Plomin R:
Continuity and change in preschool ADHD symptoms: longitudinal
genetic analysis with contrast effects. Behav Genet 2005, 35(2):121-132.
11. Kuntsi J, Rijsdijk F, Ronald A, Asherson P, Plomin R: Genetic influences on
the stability of attention-deficit/hyperactivity disorder symptoms from
early to middle childhood. Biol Psychiatry 2005, 57(6):647-654.
12. Rietveld MJ, Hudziak JJ, Bartels M, van Beijsterveldt CE, Boomsma DI:
Heritability of attention problems in children: longitudinal results from a
study of twins, age 3 to 12. J Child Psychol Psychiatry 2004, 45(3):577-588.
13. Larsson JO, Larsson H, Lichtenstein P: Genetic and environmental
contributions to stability and change of ADHD symptoms between 8
and 13 years of age: a longitudinal twin study. J Am Acad Child Adolesc
Psychiatry 2004, 43(10):1267-1275.
14. Ilott NE, Saudino KJ, Wood AC, Asherson P: A Genetic Study of ADHD and
Activity Level in Infancy. 2009.
15. Price TS, Freeman B, Craig I, Petrill SA, Ebersole L, Plomin R: Infant zygosity
can be assigned by parental report questionnaire data. Twin Res 2000,
3(3):129-133.
16. Achenbach TM, Edelbrock C, Howell CT: Empirically based assessment of
the behavioral/emotional problems of 2- and 3-year-old children. J
Abnorm Child Psychol 1987, 15(4):629-650.
17. Hogg C, Rutter M, Richman N: Emotional and Behavioural Problems in
Children. Windsor, Berkshire, UK: NFER-NELSON. 1997.
18. Neale M, Boker S, Xie G, Maes H: Mx: Statistical modeling. 7 edition.
Richmond: Virgina Commonwealth University; 2006.
19. Freeman B, Smith N, Curtis C, Huckett L, Mill J, Craig IW: DNA from buccal
swabs recruited by mail: evaluation of storage effects on long-term
stability and suitability for multiplex polymerase chain reaction
genotyping. Behav Genet 2003, 33(1):67-72.
20. Abecasis GR, Cardon LR, Cookson WO: A general test of association for
quantitative traits in nuclear families. Am J Hum Genet 2000,
66(1):279-292.
21. Hudziak JJ, Derks EM, Althoff RR, Rettew DC, Boomsma DI: The genetic and
environmental contributions to attention deficit hyperactivity disorder
as measured by the Conners’ Rating Scales–Revised. Am J Psychiatry
2005, 162(9):1614-1620.
22. Derks EM, Hudziak JJ, van Beijsterveldt CE, Dolan CV, Boomsma DI: A study
of genetic and environmental influences on maternal and paternal CBCL
syndrome scores in a large sample of 3-year-old Dutch twins. Behav
Genet 2004, 34(6):571-583.
23. Saudino KJ, Carter AS, Purper-Ouakil D, Gorwood P: The etiology of
behavioral problems and competencies in very young twins. J Abnorm
Psychol 2008, 117(1):48-62.
24. Rietveld MJ, Posthuma D, Dolan CV, Boomsma DI: ADHD: sibling
interaction or dominance: an evaluation of statistical power. Behav Genet
2003, 33(3):247-255.
25. Genome-wide association study of 14,000 cases of seven common
diseases and 3,000 shared controls. Nature. The Welcome Trust Case
Control Consortium 2007, 447(7145):661-678.
26. Lowe N, Kirley A, Mullins C, Fitzgerald M, Gill M, Hawi Z: Multiple marker
analysis at the promoter region of the DRD4 gene and ADHD: evidence
of linkage and association with the SNP-616. Am J Med Genet B
Neuropsychiatr Genet 2004, 131(1):33-37.
Ilott et al. BMC Psychiatry 2010, 10:102
/>Page 8 of 9
27. Auerbach JG, Faroy M, Ebstein R, Kahana M, Levine J: The association of
the dopamine D4 receptor gene (DRD4) and the serotonin transporter
promoter gene (5-HTTLPR) with temperament in 12-month-old infants. J
Child Psychol Psychiatry 2001, 42(6):777-783.
28. De Luca A, Rizzardi M, Buccino A, Alessandroni R, Salvioli GP, Filograsso N,
Novelli G, Dallapiccola B: Association of dopamine D4 receptor (DRD4)
exon III repeat polymorphism with temperament in 3-year-old infants.
Neurogenetics 2003, 4(4):207-212.
29. Yang B, Chan RC, Jing J, Li T, Sham P, Chen RY: A meta-analysis of
association studies between the 10-repeat allele of a VNTR
polymorphism in the 3’-UTR of dopamine transporter gene and
attention deficit hyperactivity disorder. Am J Med Genet B Neuropsychiatr
Genet 2007, 144(4):541-550.
30. Brookes K, Xu X, Chen W, Zhou K, Neale B, Lowe N, Anney R, Franke B,
Gill M, Ebstein R, et al: The analysis of 51 genes in DSM-IV combined
type attention deficit hyperactivity disorder: association signals in DRD4,
DAT1 and 16 other genes. Mol Psychiatry 2006, 11(10):934-953.
31. Brookes KJ, Mill J, Guindalini C, Curran S, Xu X, Knight J, Chen CK,
Huang YS, Sethna V, Taylor E, et al: A common haplotype of the
dopamine transporter gene associated with attention-deficit/
hyperactivity disorder and interacting with maternal use of alcohol
during pregnancy. Arch Gen Psychiatry 2006, 63(1):74-81.
32. Feng Y, Crosbie J, Wigg K, Pathare T, Ickowicz A, Schachar R, Tannock R,
Roberts W, Malone M, Swanson J, et al: The SNAP25 gene as a
susceptibility gene contributing to attention-deficit hyperactivity
disorder. Mol Psychiatry 2005, 10(11):998-1005, 1973.
33. Barr CL, Feng Y, Wigg K, Bloom S, Roberts W, Malone M, Schachar R,
Tannock R, Kennedy JL: Identification of DNA variants in the SNAP-25
gene and linkage study of these polymorphisms and attention-deficit
hyperactivity disorder. Mol Psychiatry 2000, 5(4):405-409.
34. Brophy K, Hawi Z, Kirley A, Fitzgerald M, Gill M: Synaptosomal-associated
protein 25 (SNAP-25) and attention deficit hyperactivity disorder
(ADHD): evidence of linkage and association in the Irish population. Mol
Psychiatry 2002, 7(8):913-917.
35. Kustanovich V, Merriman B, McGough J, McCracken JT, Smalley SL,
Nelson SF: Biased paternal transmission of SNAP-25 risk alleles in
attention-deficit hyperactivity disorder. Mol Psychiatry 2003, 8(3):309-315.
36. Thorisson GA, Smith AV, Krishnan L, Stein LD: The International HapMap
Project Web site. Genome Res 2005, 15(11):1592-1593.
37. Domschke K, Sheehan K, Lowe N, Kirley A, Mullins C, O’Sullivan R, Freitag C,
Becker T, Conroy J, Fitzgerald M, et al: Association analysis of the
monoamine oxidase A and B genes with attention deficit hyperactivity
disorder (ADHD) in an Irish sample: preferential transmission of the
MAO-A 941G allele to affected children. Am J Med Genet B Neuropsychiatr
Genet 2005, 134(1)
:110-114.
38. Xu X, Brookes K, Chen CK, Huang YS, Wu YY, Asherson P: Association study
between the monoamine oxidase A gene and attention deficit
hyperactivity disorder in Taiwanese samples. BMC Psychiatry 2007, 7:10.
39. Das M, Bhowmik AD, Sinha S, Chattopadhyay A, Chaudhuri K, Singh M,
Mukhopadhyay K: MAOA promoter polymorphism and attention deficit
hyperactivity disorder (ADHD) in indian children. Am J Med Genet B
Neuropsychiatr Genet 2006, 141B(6):637-642.
40. Lawson DC, Turic D, Langley K, Pay HM, Govan CF, Norton N, Hamshere ML,
Owen MJ, O’Donovan MC, Thapar A: Association analysis of monoamine
oxidase A and attention deficit hyperactivity disorder. Am J Med Genet B
Neuropsychiatr Genet 2003, 116B(1):84-89.
41. Xu X, Hawi Z, Brookes KJ, Anney R, Bellgrove M, Franke B, Barry E, Chen W,
Kuntsi J, Banaschewski T, et al: Replication of a rare protective allele in
the noradrenaline transporter gene and ADHD. Am J Med Genet B
Neuropsychiatr Genet 2008, 147B(8):1564-1567.
42. Bobb AJ, Addington AM, Sidransky E, Gornick MC, Lerch JP, Greenstein DK,
Clasen LS, Sharp WS, Inoff-Germain G, Wavrant-De Vrieze F, et al: Support
for association between ADHD and two candidate genes: NET1 and
DRD1. Am J Med Genet B Neuropsychiatr Genet 2005, 134(1):67-72.
43. Xu X, Knight J, Brookes K, Mill J, Sham P, Craig I, Taylor E, Asherson P: DNA
pooling analysis of 21 norepinephrine transporter gene SNPs with
attention deficit hyperactivity disorder: no evidence for association. Am J
Med Genet B Neuropsychiatr Genet 2005, 134(1):115-118.
44. Sheehan K, Lowe N, Kirley A, Mullins C, Fitzgerald M, Gill M, Hawi Z:
Tryptophan hydroxylase 2 (TPH2) gene variants associated with ADHD.
Mol Psychiatry 2005, 10(10):944-949.
Pre-publication history
The pre-publication history for this paper can be accessed here:
/>doi:10.1186/1471-244X-10-102
Cite this article as: Ilott et al.: Genetic influences on attention deficit
hyperactivity disorder symptoms from age 2 to 3: A quantitative and
molecular genetic investigation. BMC Psychiatry 2010 10:102.
Submit your next manuscript to BioMed Central
and take full advantage of:
• Convenient online submission
• Thorough peer review
• No space constraints or color figure charges
• Immediate publication on acceptance
• Inclusion in PubMed, CAS, Scopus and Google Scholar
• Research which is freely available for redistribution
Submit your manuscript at
www.biomedcentral.com/submit
Ilott et al. BMC Psychiatry 2010, 10:102
/>Page 9 of 9