Báo cáo y học: " Is there a linear relationship between the Brief Psychiatric Rating Scale and the Clinical Global Impression-Schizophrenia scale? " doc
Bạn đang xem bản rút gọn của tài liệu. Xem và tải ngay bản đầy đủ của tài liệu tại đây (332.46 KB, 10 trang )
RESEARC H ARTIC L E Open Access
Is there a linear relationship between the Brief
Psychiatric Rating Scale and the Clinical Global
Impression-Schizophrenia scale? A retrospective
analysis
Jitsuki Sawamura
1*
, Shigeru Morishita
2
, Jun Ishigooka
1
Abstract
Background: Although the Brief Psychiatric Rating Scale (BPRS) is widely used for evaluating patients with
schizophrenia, it has limited value in estimating the clinical weight of individual symptoms. The aim of this study
was 4-fold: 1) to investigate the relationship of the BPRS to the Clinical Global Impression-Schizophrenia Scale (CGI-
SCH), 2) to express this relationship in mathematical form, 3) to seek significant symptoms, and 4) to consider a
possible modified BPRS subscale.
Methods: We evaluated 150 schizophrenia patients using the BPRS and the CGI-SCH, then examined the scatter
plot distribution of the two scales and expressed it in a mathematical equation. Next, backward stepwise
regression was performed to select BPRS items that were highly associated with the CGI-SCH. Multivariate
regression was conducted to allocate marks to individual items, proportional to their respective magnitude. We
assessed the influence of modifications to the BPRS in terms of Pearson’s r correlation coefficient and r-squared to
evaluate the relationship between the two scales. Utilizing symptom weighting, we assumed a possible BPRS
subscale.
Results: By plotting the scores for the two scales, a logarithmic curve was obtained. By performing a logarithmic
transformation of the BPRS total score, the curve was modified to a linear distribution, described by [CGI-SCH] =
7.1497 × log
10
[18-item BPRS] - 6.7705 (p < 0.001). Pearson’s r for the relationship between the scales was 0.7926
and r-squared was 0.7560 (both p < 0.001). Applying backward stepwise regression using small sets of items, eight
symptoms were positively correlated with the CGI-SCH (p < 0.005) and the subset gave Pearson’s r of 0.8185 and r-
squared of 0.7198. Further selection at the multivariate regression yielded Pearson’s r of 0.8315 and r-squared of
0.7036. Then, modification of point allocation provided Pearson’s r of 0.8339 and r-squared of 0.7036 (all these p <
0.001). A possible modified BPRS subscale, “the modified seven-item BPRS”, was designed.
Conclusions: Limited within our data, a logarithmic relationship was assumed between the two scales, and not
only individual items of the BPRS but also their weightings were considered important for a linear relationship and
improvement of the BPRS for evaluating schizophrenia.
Background
Schizophren ia is a serious mental disorder characterized
by a number of symptoms. To evaluate the effects of
treatment for schizophreni a, it is important to assign
quantitative values to the symptoms. Many rating scales
have been used to evaluate various symptomatic
domains in schizophrenia [1]. This has led to confusion
regarding the suitability of the different scales available,
not o nly in relation to evaluation and treatment of the
disease but also in research and clinical studies of the
effects of medication. Currently, consensus is lacking
about which rating scales are appropriate to evaluate
schizophrenia. Evaluati on scales that are relevant, quick,
* Correspondence:
1
Department of Psychiatry, Tokyo Women’s Medical University, Tokyo, Japan
Full list of author information is available at the end of the article
Sawamura et al. BMC Psychiatry 2010, 10:105
/>© 2010 Sawamura et al; licensee BioMed Central Ltd. This is an Open Access article distributed under the terms of the Creative
Commons Attribution License ( which permits unrestricted use, distribution, and
reprodu ction in any medium, provided the original work is properly cited.
user-friendly, graduated at equal intervals and with high
linearity are needed to facilitate measurement-based
treatment of schizophrenia. The Brief Psychiatric Rating
Scale [ 2] is one of the standard instruments used most
frequently in daily practice for evaluating the severity of
schizophrenia. Also popular are the Clinical Global
Impression-Schizophrenia Scale [3], the Positive and
Negative Syndrome Scale [4], the Scale for Assessment
of Positive Symptoms [5] and the S cale for Assessment
of Negative Symptoms [6]. Although the BPRS includes
18 items and the allocation of marks is defined clearly,
as all items have the same range of marks (i.e., 1-7), it is
not unusual to find that scores for the BPRS differ
widely from those for the CGI-SCH.
Ideally, scores from one scale could be mapped
directly onto the other, making it possible to compare
individuals evaluated with one scale or the other. We
decided to investigate this divergence analytically, look-
ing at the clinical weight of respective symptoms (the
relative magnitudes of symptoms in schizophrenia) and
the issue of scale nonlinearity. In the present study, we
investigated whether there was a linear relationship
between the scores of the two scales, to observe whether
linearity of the BPRS to the CGI-SCH could be influ-
enced by changing point allocation of the BPRS through
devising an example of a possible modified BPRS
subscale.
Theaimofthepresentstudyis4-fold:1)toinvesti-
gate the linearity of the BPRS in relation to its items
and mark allocation by examining the reasons for the
incongruity between BPRS scores and clinicians’ impres-
sions o f symptom severity in schizophrenic patients; 2)
to determine a mathematical expression that represents
the relationship between the BPRS and the CGI-SCH
more precisely; 3) to seek which symptoms are impor-
tant from a clinical standpoint; and 4) if possible, to
construct a n example of a possible modified BPRS sub-
scale that is expec ted to have improved correlation with
the CGI-SCH scores compared with the full BPRS
within the limitations of the data obtained in this trial.
Methods
Participants
This was a retrospective study of outpatients and inpati-
ents treated at the Tokyo Women’s Medical University,
Miyazaki Hospital and Depression Prevention Medical
Center, Kyoto Jujo Rehabilitation Hospital, Japan, who
met the DSM-IV-TR [7] criteria for schizophrenia. A
total of 150 patients (74 males , 76 females) with a mean
age of 44.5 years (range, 17-83) were included in th is
study. Fifty patients were suffering their first episode of
schizophrenia o r attending for initial treatment (Group
A) and 100 were randomly selected during either the
acute or chronic phase of schizophrenia (Group B).
The study involved a retrospective chart re view and was
approved by the ethics committee of our institution.
Research design
All patients were evaluated and rated from their medical
records using the BPRS and the CGI-SCH during the
same session, but at initial consultation for Group A
and at a random treatment session for Group B. In this
study, we utilized the CGI-SCH as a scale that substi-
tuted for the evaluation made by the patients’ psychia-
trists under the tentative assumption that the CGI-SCH
had p erfect linearity and that it represented the precise
clinical global impression of the treating psychiatrists.
If the linearity of the BPRS to the CGI-SCH was not
initially apparent, w e aimed t o derive a mathematical
equation to represen t more precisely the relationship
between the scales, clarifying which symptoms were
important in evaluating schizophrenia and how we
could improve the correlation between the BPRS and
the CGI-SCH. Two experienced psychiatrists shared
their evaluations, and the scores for the B PRS and the
CGI-SCH were presented graphically, making it possible
to examine whether the two demonstrated a linear rela-
tionship. At this stage, we examined the distribution on
the scatter plot of the two scales and expressed the rela-
tionship in a precise mathematical equation. Next, back-
ward stepwise regression was performed, with the CGI-
SCH as a dependent variable and with all 18 items of
the BPRS as independent va riables. An F-value of less
than 2.000 was used to identify variables for removal. In
addition, backward stepwise regression with F-value at
the same c ondition was performed using three small
sets of variables based on derived scores. These inde-
pendent variable groups were: positive symptoms (con-
ceptual disorganization, grandiosity, hostility,
suspicious ness, hallucinatio ns, and excitement); negative
symptoms (emotional withdrawal and blunted affect);
and general psychopathological symptoms (somatic con-
cern, anxiety, guilt, tension, bizarre behavior, depressed
mood, motor retardation, uncooperativeness, unusual
thought content, and disorientation) with reference to
three domains of the PANSS. Variables showing a p osi-
tive association with the CGI-SCH were derived f rom
these three domains, and multivariate regression analysis
was p erformed using the selected items as independent
variables and the CGI-SCH as a dependent variable. B y
convention in stepwise regression, even if p values
exceed 0.05, it is permissible to adopt the variables if
those symptoms are judged as clinically important, as
long as the p values do not exceed 0.20. However, w e
selected the variables positively associated with the CGI-
SCH within t he condition that p values were less t han
0.05. In the stepwise and multivariate regression ana-
lyses, we often obtained variables inversely associated
Sawamura et al. BMC Psychiatry 2010, 10:105
/>Page 2 of 10
with the CGI-SCH. In this study, we adopted a way to
remove them. Furthermore, utilizing the results of mul-
tivariate regression, we allocated marks in proportion to
the magnitude of the multiple regression coefficient of
each variable so that each symptom was allocated differ-
ent m arks proportional to the positive multiple regres-
sion coefficient.
With regard to linearity, we then examined the distri-
bution on the scatter plot of the BPRS and the CGI-
SCH scores. We obtained the Pearson’ s r coefficient as
an indication of the degree of l inearity of the relation-
ship between the two scales, r-squared being one of
values used to estimate how much the fit of model
shrinks (by observing how r-squared decreased), before
and after exclusion of the various items and modifica-
tion of the mark allocation. Furthermore, we examined
whether the selection of specific items and/or changing
the distribution of the marks enhanced the correlation
of the BPRS with the CGI-SCH and how much the r-
squared de creased. On the basis of the results, we con-
structed an example of a possible modified BPRS sub-
scale, “the modified seven-item BPRS”, which would be
expected to have a higher correlation with the CGI-SCH
within the limitations of the applicability for our data at
this stage. We used SPSS for Windows, version 14 [8]
for the stepwise regression analysis, Stata Release 10.0
[9] for the multivariate regression analysis, and Micro-
soft Excel 2003 [10] for plotting the graph.
Results
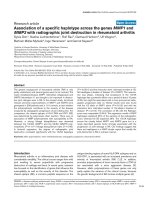
Figure 1 shows the relationship between the 18-item
BPRSscoreandtheCGI-SCHscore.Althoughthere
was a rough correlation, a curve with upper convexity
was obtained, and the straight-line relationship that had
been thought to exist between the two scales was not
apparent. Because the shape of the curve was similar to
a logarithmic curve, we performed a logarithmic trans-
formation of the 18-item BPRS total score. The curve
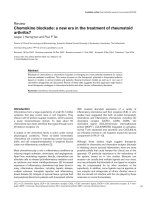
was then modified to an almost linear distribution,
which was described by the equation [CGI-SCH] =
7.1497 × log
10
[18-item BPRS] - 6.7705 (p < 0.001;
Figure 2). Pearson’ s r coefficient for the r elationship
between the 18-item BPRS and the CGI-SCH was
0.7926 (p < 0.001) and r-squared (that of multivariate
regression using the full item of BPRS) was 0.7560. The
results of backward stepwi se analys is for correlation are
shown in Table 1 (p < 0.001). According t o the results
of other backwar d stepwise regressions for variables
divided into thre e groups, eight items were selected
(p < 0.001; Table 2). ‘Conceptua l disorganization’ (p <
0.001), ‘hostility’ (p < 0.001), ‘hallucinations’ (p < 0.001),
‘emotiona l withdrawal’ (p < 0.001), ‘anxiety’ (p < 0.001),
‘motor retardat ion’ (p < 0.001), ‘uncooperativeness’ (p =
0.004) and ‘ unusual thought content’ (p < 0.001) were
significantly correlated with the CGI-SCH. The selection
of the above eight variables from the 18-item BPRS gave
Pearson’ s r of 0.8185 and r-squared of 0.7198. Using
these eight items as independent variables that were
expected to be important for the correlation between
theBPRSandtheCGI-SCH,multivariateregression
analysis was performed (Table 3). After further selection
of the seven variables f rom the above eight variables at
the multivariate regression, “the seven-item BPRS” was
obtained that comprised these positively associated
seven items. Pearson’ s r for the relationship between
“the seven-item BPRS” and the CGI-SCH was 0.8315
and r-squared was 0.7036 (p < 0.001). Furthermore,
because we were able to consider the weight of the
multiple regression coefficient as the clinical weight, the
standard deviation of each variable was assumed to be
almost the same, and by allocating marks to each
respective item of “the seven-item BPRS” in propor tion
to the magnitude of the multiple regression coefficient,
Pearson’ srwasincreasedfurtherto0.8339(between
“the modified seven-item BPRS” and the CGI-SCH; p <
0.001; Figure 3) and r-squared did not change (0.7036).
As a result, the distribution on the scatter plot of the
two scales changed from that shown in Figur e 1 to that
shown in Figure 3, yielding a more linear relationship
between “ the modified s even-item BPRS” and the CGI-
SCH than was the c ase between the 18-item BPRS and
the CGI-SCH. Pearson’s r was increased after the series
of manipulations, and r-squared decreased by slow
degrees, although statistical significance was not appar-
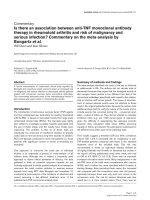
ent for this change. By multiplying each multiple regres-
sion coefficient by 40, we composed an example of a
possible modified BPRS subscale: “the modified seven-
item BPRS” (o f tentative meaning, given the limits of
our data at this stage) (Figure 4).
Discussion
TheBPRSisoneofthemostfrequentlyusedinstru-
ments for evaluating the psychopathology of patients
with schizophrenia. Although its psychometric proper -
ties in terms of reliability, validity and sensitivity have
been extensively examined [11], patients are examined
by clinicians with different observer ratings using differ-
ent criteria. On the other hand, assessment with the
CGI-SCH is based on a score of 1-7, making it simple
and relevant. The CGI-SCH may be as sensitive as the
BPRS in detecting efficacy differences be tween antipsy-
chotic drugs [12], but it is necessary that treatment
response be interpreted in the context of patient charac-
teristics [13]. However, patients with different character-
istics but with simi lar scores are often treated similarly
in clinical trials. Therefore, training is required for per-
forming a standardized evaluation [14]. Other user-
friendly assessments include the Revised Global
Sawamura et al. BMC Psychiatry 2010, 10:105
/>Page 3 of 10
Outcome Assessmen t of Life in Schizophrenia (Revised
GOALS) [15], the Investigator’s Assessment Question-
naire (IAQ) [16] and t he Targeted Inventory on Pro-
blems in Schizophrenia (TIP-Sz) [17], although they
have some limitations in terms of methodology. We also
believe that other important aspects of illness manage-
ment should be supplemented with appropriate subjec-
tive scales as necessary [18]. Nonetheless, there is no
consensus among clinicians regarding the most suitable
scale. To address this perplexing issue, more advanced
investiga tions are necessary to devise rating scales using
some form of statistical method.
Leaving aside the debate over whether psychopa tholo-
gical severity or state can be expressed in evaluation
scales such as the BPRS or the CGI-SCH and accepting
the need and utility of such instruments, we focused
here on improving the BPRS scale. We examined
whether the more detailed assessment afforded by its
items and individual point allocations could be made
proportional to the simpler and more global CGI-SCH
scale.
Many previous attempts have been made to evaluate
the adequacy of the BPRS from the viewpoint of which
items should be selected because of their relevance.
However, no study has approached this issue by
addressing how the degree of linearity of the BPRS can
be changed by modifying not only its constituent items
but also their weighting, using stepwise regression and
multivariate regression analysis. In the present study, we
firstexaminedwhethertheBPRSandtheCGI-SCH
showed a mutual linear relationship. By plotting the
BPRS scores and the CGI-SCH scores in the form of a
graph, we compared their respective distributions. The
scatter plot of the 18-item BPRS and the CGI-SCH
yielded a curve with upper convexity, thus demonstrat-
ing that the relationship between the two scales was not
linear (see Figure 1). Because the shape of the curve had
upper convexity similar to a logarithmic curve, we per-
formed a common logarithmic transformation on the
18-item BPRS score. Then, we were able to o btain a
possibly more precise equation as a logarithmic form
shown in Figure 2. From this r esult, we presumed that
there was a possibility that an increase in the logarithm
of the t otal score for all symptoms might be roughly
proportional to the global increase in symptom severity
observed clinically in schizophrenic patients. We recog-
nize, however, that this model has applicability to only
this trial at this stage. We inferred that the logarithmic
relationship between the single score scale, the CGI-
SCH, and the plural score scale, the BPRS, might be an
CG
I-
SC
H
1
8
-it
e
m BPR
S
Figure 1 Scatter plot of the 18-item BPRS total score and the CGI-SCH score. An upper convexity curve similar to a logarithmic curve was
evident, and a linear relationship was not apparent. The range of the 18-item BPRS was 18-126, and that of the CGI-SCH was 1-7.
Sawamura et al. BMC Psychiatry 2010, 10:105
/>Page 4 of 10
important tool in our determination of the severity of
illness. We then investigated whether modifying the
constituent items and/or allocation of marks could affect
the linearity of the BPRS, at least, within this trial itself,
looking at the correlation of the BPRS with the CGI-
SCH in terms of Pearson’s r and r-squared, which
express one of the degrees of the fit between the two
scales. To evalua te the clinical severity of schizophrenia,
we substituted the CGI-SCH score for the clinical
impression.
CGI-SCH
log
10
[18-item BPRS]
[CGI-SCH] = 7.1497 × log
10
[18-item BPRS] – 6.7705 (p < 0.001, R
2
= 0.6896
)
Figure 2 Scatter plot of the common logarithm of the 18-item BPRS total score and the CGI-SCH score. After performing a common
logarithmic transformation on the 18-item BPRS score, the approximately logarithmic curve was modified to an almost linear distribution and
the increase in the common logarithm of the 18-item BPRS total score was almost proportional to the increase in the CGI-SCH score.
Table 1 Results of stepwise regression 1
Variable Unstandardized b Standard Error Standardized b t p-Value 95% Confidence Interval
Somatic concern -0.253525** 0.078032 -0.171 -3.249 0.001 -0.407828 - -0.099222
Anxiety 0.413167
†
0.082008 0.411 5.038 0.000 0.251002 - 0.575332
Emotional withdrawal -0.351087** 0.106518 -0.324 -3.296 0.001 -0.561719 - -0.140454
Conceptual disorganization 0.358483
†
0.069136 0.353 5.185 0.000 0.221771 - 0.495195
Grandiosity -0.189250* 0.088471 -0.099 -2.139 0.034 -0.364195 - -0.014304
Hostility 0.166995 0.104009 0.140 1.606 0.111 -0.038676 - 0.372666
Suspiciousness -0.152787 0.091570 -0.164 -1.669 0.097 -0.333861 - 0.028287
Hallucinations 0.162475** 0.057716 0.204 2.815 0.006 0.048346 - 0.276605
Motor retardation 0.258352** 0.090433 0.190 2.857 0.005 0.079527 - 0.437178
Uncooperativeness 0.262802* 0.109879 0.239 2.392 0.018 0.045524 - 0.480081
Unusual thought content 0.147787* 0.073080 0.162 2.022 0.045 0.003277 - 0.292296
Blunted affect 0.139060 0.079696 0.095 1.745 0.083 -0.018534 - 0.296652
Constant 1.138607 0.256029 4.447 0.000 0.632328 - 1.644886
*p < 0.05, **p < 0.01,
†
p < 0.001
Results of backward stepwise regression using the full set of variables of the BPRS. Eight items of the BPRS as independent variables were positively associated
with the CGI-SCH score as a dependent variable, and four items were inversely associated with the CGI-SCH score. F-value < 2.000 as a criterion for removal (p <
0.001). R-squared was 0.7524 (p value of analysis of variance was less than 0.001), unstandardized b, standardized b, and the p value are shown.
Data for schizophrenic patients (n = 150)
Sawamura et al. BMC Psychiatry 2010, 10:105
/>Page 5 of 10
Partly because the values of Pearson’s r were slightly
higher between “the seven-item BPRS” (constructed by
selection of specific items) and the CGI-SCH than
between the 18-item BPRS and the CGI-SCH without
considerable decreases of r-squared, the shape of the
scatter plot between the two scales became more linear
than that be fore the selection. We inferred that there
was a possibility that the selection of these items from
18 items is related to the linearity of the BPRS. The
clinical weights might be related to the heightened
values of Pearson’srbetween“the modified seven-item
BPRS” (constructed by changing the allocation of
Table 2 Results of stepwise regression 2
Positive symptoms (conceptual disorganization, grandiosity, hostility, suspiciousness, hallucinations and excitement)
Variable Unstandardized b Standard Error Standardized b t p-Value 95% Confidence Interval
Conceptual disorganization 0.419673
†
0.062355 0.414 6.730 0.000 0.296437 - 0.542909
Hostility 0.247835
†
0.066360 0.208 3.735 0.000 0.116685 - 0.378984
Hallucinations 0.288605
†
0.047700 0.363 6.050 0.000 0.194333 - 0.382877
Constant 1.586381 0.163776 9.686 0.000 1.262703 - 1.910059
Negative symptoms (emotional withdrawal and blunted affect)
Variable Unstandardized b Standard Error Standardized b t p-Value 95% Confidence Interval
Emotional withdrawal 0.668840
†
0.069960 0.618 9.560 0.000 0.530592 - 0.807089
Constant 2.624571 0.167903 15.631 0.000 2.292775 - 2.956368
General psychopathological symptoms (somatic concern, anxiety, guilt, tension, bizarre behavior, depressed mood, motor retardation,
uncooperativeness, unusual thought content and disorientation)
Variable Unstandardized b Standard Error Standardized b t p-Value 95% Confidence Interval
Somatic concern -0.220833** 0.082965 -0.149 -2.662 0.009 -0.384830 - -0.056837
Anxiety 0.251795
†
0.066748 0.250 3.772 0.000 0.119856 - 0.383734
Motor retardation 0.303597
†
0.078253 0.224 3.880 0.000 0.148916 - 0.458278
Uncooperativeness 0.223711** 0.076051 0.204 2.942 0.004 0.073381 - 0.374041
Unusual thought content 0.350995
†
0.062647 0.386 5.603 0.000 0.227160 - 0.474829
Disorientation 0.244946 0.168480 0.076 1.454 0.148 -0.088087 - 0.577979
Constant 1.430263 0.234066 6.111 0.000 0.967587 - 1.892939
†
p < 0.001 Data for schizophrenic patients (n = 150)
†
p < 0.001 Data for schizophrenic patients (n = 150)
*p < 0.05, **p < 0.01,
†
p < 0.001 Data for schizophrenic patients (n = 150)
Results of backward stepwise regression using small set s of variables based on the three domains of the PANSS (positive symptoms, negative symptoms and
general psychopathological symptoms). Within positive symptoms, ‘conceptual disorganization’, ‘hostility’ and ‘hallucinations’ were significantly and positively
associated with the CGI-SCH score (p < 0.001); within negative symptoms: ‘emotional withdrawal’ (p < 0.001); within general psychopathological symptoms:
‘anxiety’, ‘motor retardation’, ‘uncooperativeness’, and ‘unusual thought content’ were significantly and positively associated with the SCH-SCH score (p < 0.0 05),
and ‘somatic concern’ was inversely associated with the CGI-SCH score (p < 0.01). F-value < 2.000 as a criterion for removal, multiple regression coefficient and
the p value are shown. R-squared was 0.6661 (positive symptoms), 0.3818 (negative symptoms) and 0.6716 (gen eral psychopathological symptoms); all p values
of respective analysis of variance were less than 0.001.
Table 3 Results of multivariate regression
Variable Multiple Regression Coefficient Standard Error t p-Value 95% Confidence Interval
Conceptual disorganization 0.325896
†
0.071154 4.580 0.000 0.185228 - 0.466563
Hostility 0.103284 0.080584 1.282 0.202 -0.056024 - 0.262592
Hallucinations 0.139101* 0.059103 2.354 0.020 0.022258 - 0.255944
Emotional withdrawal -0.312958** 0.109653 -2.854 0.005 -0.529734 - -0.096182
Anxiety 0.235261** 0.068236 3.448 0.001 0.100363 - 0.370158
Motor retardation 0.297271** 0.086420 3.440 0.001 0.126424 - 0.468118
Uncooperativeness 0.300436** 0.111556 2.693 0.008 0.079897 - 0.520976
Unusual thought content 0.095707 0.072111 1.327 0.187 -0.046852 - 0.238266
Constant 1.093726 0.193951 5.639 0.000 0.710298 - 1.477155
*p < 0.05, **p < 0.01,
†
p < 0.001
Relative weights of the variables (which were selected as being positively and significantly associated with the CGI-SCH score with the p value < 0.05 in Table 2)
are presented as a set of magnitudes of multiple regression coefficients (p < 0.001). R-squared was 0.7198 (the subset of eight items resulted from stepwise
regression using three small sets) and p value of analysis of variance was less than 0.001.
Data for schizophrenic patients (n = 150)
Sawamura et al. BMC Psychiatry 2010, 10:105
/>Page 6 of 10
marks) and the CGI-SCH, as the shape of the scatter
plot between the two scales became more linear than
before. We presumed that there was a possibility that
the weighting was also a ssociated with the linearity of
the BPRS.
Furthermore, by assigning different weights to each
item proportional to the respective regression coeffi-
cients, we were able to compose a possible modified
BPRS subscale, “ the modified seven-item BPRS” ,by
assuming that the magnitude of each regression coeffi-
cient represented the respective clinical weight of each
item.Thisscaleisonlyanexampleofapossiblemodi-
fied BPRS subscale that we areabletoassumewithin
our data, and the number of items decreased from 18
to 7.
Historically, a widely used algorithm employing a step-
wise method was first proposed by Efroymson [19], and
supplementary articles were later reported by Hocking
[20] and others. In the field of psychiatry, stepwise
methods have been used for predicting the quality of life
of schizophrenic patients by reference to schizophrenia
symptoms [21], for estimating pred ictive values of
neurocognition in schizophrenic patients [22], and for
estimation of the relationship between exec utive func-
tions and positive symptoms in schizophrenia [23].
However, some problems with stepwise and multivari-
ate regression analysis have been reported. To compare
the relative magnitudes of variables, the partial regres-
sion coefficients are often normalized using their respec-
tive standard deviations. However, the predictor variable
is at least partially redundant with other predictors and
the regression coefficient is influenced by the range of
the predictor variable [24]. In addition, the relative
importance of predictor variables is a tenuous con cept,
and comparison of the importance of predictors is not
always the best approach in multiple regression. As the
individual items of the BPRS had the same range of
marks (1-7), we considered that there would not be cru-
cial differences in the sizes of standard deviations for
predictor variables in this study. With this assumption,
we considered that, for practical purposes, the magni-
tudes of the standardized and unstandardized b might
be regarded as almost equivalent. For these reasons, we
utilized the magnitude of the unstandardized b (multiple
CGI-SCH
Total score for the seven BPRS items, modified
using multiple regression coefficients, with the
CG
I-
SC
H
sco
r
e
.
Figure 3 Scatter plot of the seven-item total score, modified using multiple regression coefficients, and the CGI-SCH score. The score
for each of the seven items was multiplied by the multiple regression coefficient for each respective symptom. The range of the total score for
the seven BPRS items modified using multiple regression coefficients was 1.497-10.479, and that for CGI-SCH was 1-7. The sum of the regression
coefficients for the seven variables positively associated with the CGI-SCH score was 1.497.
Sawamura et al. BMC Psychiatry 2010, 10:105
/>Page 7 of 10
regression coefficient) to modify the distribution of
marks of the BPRS and to design a tentative BPRS sub-
scale. If supplemented with this adjustment, the scatter
plot representing the relationship between “the modified
seven-item BPRS” and the CGI-SCH showed a distribu-
tion proportional to the scatter plot connecting the
score of “ the seven-item BPRS” multiplied by the
unstandardized b (multiple regression coefficient) for
each item and the score of the CGI-SCH. This is
because both have almost the same significance on the
graph. Additional improvements in fit may be possible.
The limitations of the present study should be noted.
The first was the use of the CGI-SCH as a scale that sub-
stituted for the evaluation made by the patients’ psychia-
trists. There is no evidence that the CGI-SCH has perfect
linearity and this was merely an assumption to allow
modification of the BPRS under a determinate condition.
For the CGI-SCH, only a certain degree of reliability has
been reported [3,12,13]. Nonetheless, we thought that
this kind of simplification was unavoidable and the trade-
off necessary, even if this assumption would sacrifice
rigor to some extent in exchange for examining the
degree of an abstract value such as ‘linearity.’
Second, there is no evidence supporting the assump-
tion that the BPRS score and the CGI-SCH sco re
obtained retrospectively by coding of the symptoms
reported in the clinical chart would be comparable to
the data obtained from trained BPRS raters monitored
for inter-rater reliability and performing standardized
interviews to probe for presence and severity of a com-
plete list of symptoms. The quality of the clinical chart
is notoriously variable, so there may exist errors and dis-
tortions from missing symptoms and falsely rating
symptoms as absent when reviewing a chart, because of
the failure of the clinician to mention them in the chart,
which would have been detected in a structured, face-
to-face interview. The 0.7926 value of P earson’s r might
be to some extent considered high. However, we pre-
sume that this was because the study was retrospective.
Therefore, some items of the BPRS might not have been
marked, thus minimiz ing the distribution of the BPRS
score. In effect, the results of this paper may be applic-
able only withi n our own data at this stage (including
the derived stepwise regression, multivariate regression
and, particularly, “the modified seven-item BPRS”)and
there is no guarantee that the results would be compar-
able to prospective research. From this standpoint, our
report might be rega rded as one of these experimental
case studies. At any rate, prospectively randomized trials
are needed in future studies.
Modi
f
ied seven-item BPRS
1 3 5 7
13
9
11
1 31 3 5 75 7
13
9
11
9
11
1 2 3 41 21 2 3 43 4
1 2 3 4 5 61 2 3 4 51 21 2 3 43 4 5 6
Total score : 60
p
oint
s
2 4 6 8
10 12
2 42 4 6 86 8
10 1210 12
2 4 6 8
10 12
2 42 4 6 86 8
10 1210 12
1 2 3 41 21 2 3 43 4
1 3 5 7 91 3 5 71 31 3 5 75 7 9
Conceptual disorganization
Uncooperativeness
Motor retardation
Anxiety
Hallucinations
Hostility
Unusual thought content
Figure 4 An example of a possible modified BPRS subscale. Marks for each item were obtained by mult iplying the respective regression
coefficient for the seven selected items by 40.
Sawamura et al. BMC Psychiatry 2010, 10:105
/>Page 8 of 10
Third, through the manipulations employed here, the
degree of change in Pearson’srwasratherambiguous.
The increases appear slight (as a total, from 0.7926 to
0.8339; particularly, in the final manipulation, from
0.8315 to 0.8339). Moreover, i t is considerably uncertain
whether statistical significance exists. From another
viewpo int, despite the fact that the scale was simplified,
and in particular, the number of items decreased, the
degree of corre lation (Pearson’s r) stayed at the same
level or increased just slightly. Although this might indi-
cate that a simplified subscale might be valuable in com-
parison with the full scale, and it might be useful to
clinicians for shortening time of rating, the reproducibil-
ity of items and point allocation is quite uncertain in
this model. We believe that a study of this theme in the
future is desirable.
Fourth, as for r-squared, in general, the more variables
we exclude from the model, the more r-squared tends
to decrease. The selection of the subset for which the
decrease of r-squared is smallest is pref erred so that the
loss of model fit would be minimal. The r-squared of
our data ranged from about 0.70-0.75. The size of the se
numbers is not low, but they may not b e sufficiently
high even with the moderate degree of decrease. For
example, 0.7560 for the full item BPRS; 0.7524 for the
results of stepwise regression using the full items of
BPRS; 0.7198 for the selected eight items from stepwise
regression using three small sets; and 0.7036 f or the
selected seven items from multivariate regression (all p
values of respective analysis of variance were less than
0.001). This means that the selection of items might
have caused shrinkage of the model.
Fifth, the selection of items and modification of point
allocation may have contributed some artifacts of multi-
collinearity. There are likely to be intercorrelations among
the data. In this study, variables that were inversely corre-
lated with the CGI-SCH score, indicating that the more
severetheBPRSitem,thelowertheCGI-SCHscore(a
phenomenon which was a departure from the clinicians’
experiences), were simply excluded from the model in an
ad hoc procedure. This ignored the fact that the selection
of the other predictors from among the l ist of candidates
depended on the presence of the excluded variable. Addi-
tional unknown and complicated factors are predicted to
exist as well, for example, that both inpatients and outpati-
ents were evaluated by the CGI-SCH, and that the results
might have been negatively influenced by differences in
cognitive ability [25]. The treatment of negative coeffi-
cients is a crucial weakness of our model.
Sixth,aboveall,theresultsarenotlikelytoberepro-
ducible. If we performed the same procedure on new
data, it is very likely t hat different symptoms would be
selected, a nd different point allocations would probably
be assigned to indiv idual items. We infer that a possible
way to remedy this problem, even if partially, might be
to perform a number of prospective trials in line with
our method, and then summarize and calculate an aver-
age on items and point allocation. If these s cales are
composed as a summary, they might be less problematic
than that of our trials. However, even in such scales,
there would still be no assurance that they would have a
greater degree of reproducibility. Therefore, the extent
to which the results of this paper could be applicable
may be q uite limited: at the extreme, only within our
present data. For this reason, future studies are
necessary.
The true aim of this manipulation was not always to
determine the best subset and/or point allocation, but to
consider a specific example of a possible modified scale.
Therefore, “ the modified s even-item BPRS” is mer ely a
tentative idea a t this stage, to propose a new viewpoint
of the importance of point allocation in the BPRS.
Needless to say, the prese nt study has many limitations,
and is thus only a first step from which further studies
may learn. We believe that improving evaluation scales
to make them more linear could minimize distortions in
evaluation for severity of illness, including over- and
under-diagnosis and estimations for efficiency and effect
in clinical research. We anticipate that our present
results will serve as a useful reference for clinicians
attempting to devise an evaluation scale, and that
further research will focus on the optimal number of
items, the fittest items for selection, and the allocation
of marks in rigorous methodology to maximize the line-
arity of the BPRS.
Conclusions
Within the limits of our data, although there was a
rough corre lation, the linear relationship that had been
thought to exist between the 18-item BPRS and the
CGI-SCH was not apparent. Also, a roughly logarithmic
relationship was assumed between the two scales. In
addition, not only specific items but also their weight-
ings were considered to be important in the realization
of a linear relationship between the BPRS and the CGI-
SCH and in the further improvement of the BPRS as a
diagnostic scale.
Acknowledgements
The authors wish to acknowledge Katsuji Nishimura, Takao Kanai, Ken Inada
and Kaoru Sakamoto for providing us with very useful advice in this study.
Author details
1
Department of Psychiatry, Tokyo Women’s Medical University, Tokyo, Japan.
2
Depression Prevention Medical Center, Kyoto Jujo Rehabilitation Hospital,
Kyoto, Japan.
Authors’ contributions
JS performed the evaluation of the patients and the statistical analysis, and
wrote the manuscript. SM also performed the evaluation of the patients and
Sawamura et al. BMC Psychiatry 2010, 10:105
/>Page 9 of 10
revised the manuscript. JI was responsible for checking the methodology of
the study and evaluating the results of the statistical analysis. In addition, all
authors read and approved the final version of the manuscript.
Competing interests
The authors declare that they have no competing interests.
Received: 21 May 2010 Accepted: 7 December 2010
Published: 7 December 2010
References
1. Lindenmayer JP, Harvey PD, Khan A, Kirkpatrick B: Schizophrenia:
measurements of psychopathology. Psychiatr Clin North Am 2007,
30:339-363.
2. Overall JE, Gorham DR: The Brief Psychiatric Rating Scale. Psychol Rep
1962, 10:799-812.
3. Haro JM, Kamath SA, Ochoa S, Novick D, Rele K, Fargas A, Rodríguez MJ,
Rele R, Orta J, Kharbeng A, Araya S, Gervin M, Alonso J, Mavreas V,
Lavrentzou E, Lintos N, Gregor K, Jones PB, SOHO Study Group: The Clinical
Global Impression-Schizophrenia Scale: a simple instrument to measure
the diversity of symptoms present in schizophrenia. Acta Psychiatr Scand
2003, , Suppl 416: 16-23.
4. Kay SR, Fiszbein A, Opler LA: The Positive and Negative Syndrome Scale
(PANSS) for schizophrenia. Schizophr Bull 1987, 13:261-276.
5. Andreasen NC: Scale for the Assessment of Positive Symptoms (SAPS) Iowa
City: University of Iowa; 1984.
6. Andreasen NC: Scale for the Assessment of Negative Symptoms (SANS) Iowa
City: University of Iowa; 1983.
7. American Psychiatric Association: Diagnostic and Statistical Manual of Mental
Disorders, Fourth Edition, Text Revision: New York 2000.
8. SPSS Inc: SPSS for Windows Version 14 Chicago, IL: SPSS Inc; 2007.
9. Stata Corporation: Stata User’s Guide, Release 10.0 College Station, Texas:
Stata Corporation; 2007.
10. Microsoft Corporation: Microsoft Excel 2003 Microsoft Corp. Redmond,
Washington; 2003.
11. Hedlund JL, Vieweg BW: The Brief Psychiatric Rating Scale (BPRS): a
comprehensive review. J Oper Psychiatry 1980, 11:48-65.
12. Leucht S, Engel R: The relative sensitivity of the Clinical Global
Impressions Scale and the Brief Psychiatric Rating Scale in antipsychotic
drug trials. Neuropsychopharmacol 2006, 31:406-412.
13. Leucht S, Kane JM, Kissling W, Hamann J, Etschel E, Engel R: Clinical
implications of Brief Psychiatric Rating Scale scores. Br J Psychiatry 2005,
187:366-371.
14. Müller MJ, Rossbach W, Dannigkeit P, Müller-Siecheneder F, Szegedi A,
Wetzel H: Evaluation of standardized rater training for the Positive and
Negative Syndrome Scale (PANSS). Schizophr Res 1998, 32:151-160.
15. Naber D, Vita A: Tools for measuring clinical effectiveness. Eur
Neuropsychopharmacol 2004, 14(Suppl 4):S435-S444.
16. Tandon R, Devellis RF, Han J, Li H, Frangou S, Dursun S, Beuzen JN,
Carson W, Corey-Lisle PK, Falissard B, Jody DN, Kujawa MJ, L’italien G,
Marcus RN, McQuade RD, Ray S, Van Peborgh P, IAQ Validation Study
Group: Validation of the Investigator’s Assessment Questionnaire, a new
clinical tool for relative assessment of response to antipsychotics in
patients with schizophrenia and schizoaffective disorder. Psychiatry Res
2005, 136
:211-221.
17. Suzuki T, Uchida H, Nomura K, Takeuchi H, Nakajima S, Tanabe A, Yagi G,
Watanabe K, Kashima H: Novel rating scales for schizophrenia-Targeted
Inventory on Problems in Schizophrenia (TIP-Sz) and Functional
Assessment for Comprehensive Treatment of Schizophrenia (FACT-Sz).
Schizophr Res 2008, 106:328-336.
18. Burlingame GM, Dunn TW, Chen S, Lehman A, Axman R, Earnshaw D,
Rees FM: Selection of outcome assessment instruments for inpatients
with severe and persistent mental illness. Psychiatr Serv 2005, 56:444-451.
19. Efroymson MA: Multiple regression analysis. In Mathematical Methods for
Digital Computers. Edited by: Ralston A, Wilf HS. New York: Wiley;
1960:191-203.
20. Hocking RR: The analysis and selection of variables in linear regression.
Biometrics 1976, 32:1-49.
21. Bow-Thomas CC, Velligan DI, Miller AL: Predicting quality of life from
symptomatology in schizophrenia at exacerbation and stabilization.
Psychiatr Res 1999, 86:131-142.
22. Milev P: Predictive values of neurocognition and negative symptoms on
functional outcome in schizophrenia: a longitudinal first-episode study
with 7-year follow-up. Am J Psychiatry 2005, 162:495-506.
23. Guillem F, Rinaldi M, Pampoulova T, Stip E: The complex relationships
between executive functions and positive symptoms in schizophrenia.
Psychol Med 2008, 38:853-860.
24. Judd CM, McClelland GH, Ryan CS: Data Analysis: A Model Comparison
Approach. 2 edition. New York: Routledge/Taylor and Francis; 2009.
25. Brekke JS, Kohrt B, Green MF: Neuropsychological functioning as a
moderator of the relationship between psychosocial functioning and
the subjective experience of self and life in schizophrenia. Schizophr Bull
2001, 27:697-708.
Pre-publication history
The pre-publication history for this paper can be accessed here:
/>doi:10.1186/1471-244X-10-105
Cite this article as: Sawamura et al.: Is there a linear relationship
between the Brief Psychiatric Rating Scale and the Clinical Global
Impression-Schizophrenia scale? A retrospective analysis. BMC Psychiatry
2010 10:105.
Submit your next manuscript to BioMed Central
and take full advantage of:
• Convenient online submission
• Thorough peer review
• No space constraints or color figure charges
• Immediate publication on acceptance
• Inclusion in PubMed, CAS, Scopus and Google Scholar
• Research which is freely available for redistribution
Submit your manuscript at
www.biomedcentral.com/submit
Sawamura et al. BMC Psychiatry 2010, 10:105
/>Page 10 of 10