Digital Terrain Modeling: Principles and Methodology - Chapter 7 pps
Bạn đang xem bản rút gọn của tài liệu. Xem và tải ngay bản đầy đủ của tài liệu tại đây (2.73 MB, 25 trang )
DITM: “tf1732_c007” — 2004/10/20 — 15:44 — page 133 — #1
CHAPTER 7
Quality Control in Terrain Data Acquisition
Like industrial production, there must be some procedures or methodology for quality
management and control in digital terrain modeling.
7.1 QUALITY CONTROL: CONCEPTS AND STRATEGY
7.1.1 A Simple Strategy for Quality Control in Digital
Terrain Modeling
The quality of DTM data is usually measured by the accuracy of position and height.
However, updatedness (or currency) has also become an important issue. This impor-
tance can be illustrated by the generation of DTM from a pair of aerial photographs
taken 10 years ago. Although the DTM is of great fidelity to the original terrain, the
result may not necessarily be useful if there have been a lot of changes. In this context,
it is assumed that the source materials used for digital terrain modeling are not out of
date. Therefore, only accuracy is of concern in this chapter.
Quality control is complicated. To build a DTM of high quality, one has to
take care of each of the processes in digital terrain modeling so as to eliminate,
reduce, or minimize the magnitude of errors that could be introduced. A simple
strategy is
1. to minimize errors introduced during data acquisition
2. to apply procedures to eliminate errors and reduce the effect of errors
3. to minimize errors introduced in the surface modeling process.
This chapter is only concerned with the first two. Error propagation in the modeling
process will be discussed in Chapter 8.
133
© 2005 by CRC Press
DITM: “tf1732_c007” — 2004/10/20 — 15:44 — page 134 — #2
134 DIGITAL TERRAIN MODELING: PRINCIPLES AND METHODOLOGY
7.1.2 Sources of Error in DTM Source (Raw) Data
Measured data will always contain errors, no matter which measurement methods
are used. The errors in data come from
1. errors in the source materials
2. inaccuracy of the equipment for data acquisition
3. human errors introduced in the acquisition process
4. errors introduced in coordinate transformation and other data processing.
For DTM source data acquired by photogrammetry, errors in source materials
include those in aerial photographs (e.g., those caused by lens distortion) and those at
control points. Inaccuracy of equipment refers to the limited accuracy and precision
of the photogrammetric instrument as well as the limited number of digits used by
a computer; human errors include errors in measurement using float marks and typing
mistakes; coordinate transformation errors include those introduced in relative and
absolute orientation and image matching if automated method is used.
7.1.3 Types of Error in DTM Source Data
Generally speaking, three types of errors can be distinguished, namely,
1. random errors
2. systematic errors
3. gross errors (i.e., mistakes).
In classic error theory, the variability of serious measurements of a single quantity
is due to observational errors. Such errors do not follow any deterministic rule, thus
leading to the concept of random errors. Random errors are also referred to as random
noise inimageprocessing andas white noisein statistics. Random errorshave anormal
distribution. For such errors, a filtering process is usually applied to reduce their
effects. This is the topic of Section 7.3 in this chapter.
Systematic errors usually occur due to distortions in source materials (e.g.,
systematic distortion of a map), lack of adequate adjustment of the instrumentation
before use, or physical causes (e.g., photo distortion due to temperature changes).
Alternatively, systematic errors may be the result of the human observer’s limita-
tions, for example, stereo acuity or carelessness such as failing to execute correct
absolute orientation. Systematic errors may be constant or counteracting. They may
appear as a function of space and time. Most practitioners in the area of terrain data
acquisition are aware of systematic errors and strive to minimize them.
Gross errors are, in fact, mistakes. Compared with random and systematic errors,
they occur with a small probability during measurement. Gross errors occur when,
for example, the operator records a wrong reading on the correct point or observes the
wrong point through misidentification, or if the measuring instrument is not working
properly when an automatic recorder is used. Indeed, gross errors often occur in
automatic image matching (due to mismatching of image points).
From a statistical point of view, gross errors are specific observations that cannot
be considered as belonging to the same population (or sampling space) as the other
observations. Therefore, gross errors should not be used together with the other
© 2005 by CRC Press
DITM: “tf1732_c007” — 2004/10/20 — 15:44 — page 135 — #3
QUALITY CONTROL IN TERRAIN DATA ACQUISITION 135
observations from the population. Consequently, measurement should be planned
and observational procedures designed in such a way as to allow for the detection of
gross errors so that they can be rejected and removed from the set of observations.
The detectionand removal ofgross error willbe discussed inSection7.4 toSection7.8.
7.2 ON-LINE QUALITY CONTROL IN PHOTOGRAMMETRIC
DATA ACQUISITION
On-line quality control is to examine the acquired data during the process of data
acquisition and to correct errors immediately if any. Visual inspection is an approach
often widely used in practice. Four methods will be introduced in this section.
However, the last three can be used for either on-line quality control or off-line
quality checking.
7.2.1 Superimposition of Contours Back to the Stereo Model
In practical applications, on-line quality control in photogrammetric data acquisition
is achieved by superimposition of contour lines back to the stereo model to examine
whether there is any inconsistency between contour lines and the relief on the stereo
model. The contour lines are generated from the data just acquired from the stereo
model. If no inconsistency is found, it means that no gross errors occurred. However,
if there is a clear inconsistency somewhere, it means that there are gross errors and
it will be necessary to edit the data and remeasure some data points. Ostman (1986)
called such an accessory system a graphic editor for DTMs.
Another method is to superimpose the contours interpolated from the measured
DTM data onto the orthoimages to inspect whether there is mutation of contours, or
to compare them with topographic maps and terrain feature points and lines. When
there is relatively great difference of the landforms or elevations of the points, they
need to be measured again and to be edited till the DTM data meet the requirements.
This method is limited to the inspection of the gross errors.
7.2.2 Zero Stereo Model from Orthoimages
An alternative is to compare the orthoimages made from both left and right images.
If both orthoimages are made using the DTM obtained from the same stereo pair
through image matching and there are no obstacles (i.e., buildings and trees) in this
area, then the two orthoimages will form a zero stereo model (i.e., no height infor-
mation in the model) if the DTM used for orthoimage generation is free of errors.
Zero stereo model also indicates that no x-parallax can be observed anywhere on the
model. If parallax does exist, it may result from:
1. errors in the orientation parameters, leading to inconsistency of the left and right
orthoimages
2. something wrong with the image matching of the orthoimage pair
3. errors in the DTM data used for the orthoimage generation.
If the first two possibilities are excluded, then any parallax appearing on the
orthoimage pairs is the direct reflection of the errors of the DTM data.
© 2005 by CRC Press
DITM: “tf1732_c007” — 2004/10/20 — 15:44 — page 136 — #4
136 DIGITAL TERRAIN MODELING: PRINCIPLES AND METHODOLOGY
7.2.3 Trend Surface Analysis
Most terrains follow certain natural trends, such as continuous gradual spatial change.
The shape of the trends may vary with the genesis of landforms. The continuous
change of terrain surfaces may be described by smooth mathematical surfaces,
referred to as trend surfaces.
A typical trend surface analysis will reveal the greatest deviations from the
general trend in the area. As data points with gross errors appear to be abnormal,
the deviations of data values from the general trend will be obvious. In other words,
gross errors are detected if great deviations from the trend surface are found.
There are different types of trend surfaces. One of them is the least-square trend
surface as follows:
Z(x, y) =
j
k=0
k
i=0
a
ki
x
k−i
y
i
, j = 1, 3 (7.1)
The number of terms to be used for this polynomial function should be selected
according to the size and complexity of the area of interest. For example, in a large
and complex area, a higher-order polynomial should be used.
The critical issue is to set a threshold so that any point with a deviation larger than
this threshold will be suspected of having gross errors. In practice, a value of three
times the standard deviation is often regarded as a reliable threshold. However, due to
the instability of higher-order polynomial surfaces over rough terrain with irregularly
distributed data points, a large deviation does not necessarily mean gross errors at the
point. This is the limitation of trend analysis.
7.2.4 Three-Dimensional Perspective View for Visual Inspection
A fourth method is to create a 3-D surface from the DTM data for interactive visual
inspection. In this way, those points that look unreasonable can be regarded as gross
errors and removed from the data set.
The visualization of a 3-D surface from DTM data is an important application
of DTM and will be addressed in Chapter 12. To create a 3-D surface for visual
inspection, a TIN model can be constructed directly from all of the original data
points so as to ensure that all the analyses will be based on the original data. For
efficiency, it is recommended that a wire net perspective display based on the TIN is
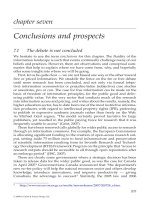
created for a local area around the point to be inspected. Figure 7.1 shows the visual
inspection of contour data. The spikes indicate that wrong height values have been
assigned to some contour points. Such an inspection is intuitive but the results are
likely to be reliable.
7.3 FILTERING OF THE RANDOM ERRORS OF THE ORIGINAL DATA
Because DTM products are obtained after a series of processes from the DTM source
(raw) data, the quality of the source data will greatly affect the fidelity of the DTM
© 2005 by CRC Press
DITM: “tf1732_c007” — 2004/10/20 — 15:44 — page 137 — #5
QUALITY CONTROL IN TERRAIN DATA ACQUISITION 137
Figure 7.1 Wire net perspective view of the area around the suspected point.
surfaces constructed from such data and the products derived from the DTM. The
quality of the source data can be judged by using their three attributes (i.e., density,
distribution, and accuracy) as criteria. The quality of a set of data can be considered as
being poor if the data are not well distributed, for example, very few scattered pointsin
areas of rough and steep terrain but with a high density of points on relatively smooth
and flat areas. However, these first two factors, that is, density and distribution, are
related to sampling and the problems can be solved by employing an appropriate
sampling strategy.
An important factor for the quality of DTM source data is its inherent accuracy.
The lower the accuracy, the poorer the data quality. Accuracy is primarily related to
measurement. After a set of data points have been measured, an accuracy figure can
be obtained or estimated. The accuracy figure obtained for any measured data set is
the overall result of different types of errors. The purpose of this section is to devise
filtering techniques to eliminate or reduce the effects of some of these errors so as to
improve the quality of the final DTM and thus its products.
7.3.1 The Effect of Random Noise on the Quality of DTM Data
Any spatial data set can be viewed as consisting of three components: (a) regional
variations, (b) local variations, and (c) random noise. In digital terrain modeling, the
first is of most interest, because it defines the basic shape of the terrain. Interest in
the second varies with the scale of the desired DTM products. For example, at a large
scale, it is extremely important. However, if a small-scale contour map covering a
large region is the desired product, then this component may be regarded as random
noise because less detailed information about the terrain variations is needed. By
contrast, the third component is always a matter of concern since it may distort the
real picture (appearance) of both regional and local variations on the terrain, but
especially the latter. As a matter of fact, it is difficult to clearly define these three
components. Generally speaking, the high-frequency component of the data can be
regarded as random noise.
© 2005 by CRC Press
DITM: “tf1732_c007” — 2004/10/20 — 15:44 — page 138 — #6
138 DIGITAL TERRAIN MODELING: PRINCIPLES AND METHODOLOGY
It is important to separate the main components of the data set that are of interest
to the user from the remainder of the information present in the data set, which is
regarded asrandomnoise. The technique usedforthis purpose is referred toasfiltering
and the device or procedure used for filtering is referred to as a filter. A digital filter
can be used to extract a particular component from a digital data set, thus ensuring
that all other components are filtered out. If a digital filter can separate the large-scale
(low-frequency) component from the remainder, this filter is called as alow-passfilter.
By contrast, if a digital filter can separate the small-scale (high-frequency) component
from the remainder, then this filter is referred to as a high-pass filter. However, here
only the low-pass filter is of interest since it is the high-frequency component that
needs to be filtered out.
Before discussing how to filter out random noise, it is necessary to know how
random noise affects the quality of the DTM and its products.
Ebisch (1984) discussed the effect of round-off errors found in grid DTM data on
the quality of the contours derived from the DTM data, and he also demonstrated the
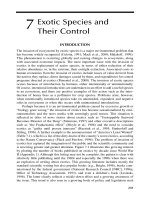
effect of random noise in the DTM data on the contours produced from it. Ebisch first
produced smooth contours (Figure 7.2a) with 1.0-m intervals from a conical surface
represented by a grid of 51 by 51 points. Then, he rounded-off the grid heights to
the nearest 0.1 m to produce another contour map (Figure 7.2b) to show the effect
of round-off error. After that, he added random noise with a maximum amplitude of
±0.165 m to the grid, producing a contour map with zigzag and meandering contour
lines (Figure 7.2c). Figure 7.2(d) shows the contours produced from the DTM data
with both round-off and added random errors. This figure shows the effects of random
noise on the quality of DTM source data and the quality of the contours derived from
these data.
(a) (b)
(c) (d)
Figure 7.2 Effect of round-off errors and random noise on the contours produced from the data
set (Reprinted with permission from Ebisch 1984). (a) Contours produced from the
original data set (a smooth surface). (b) Contours produced from the data set after
rounding off the decimal fraction of original DTM data. (c) Contours produced from
the data set with a random noise of magnitude ±0.165 m added. (d) Contours
produced from the data set with both random noise and round-off errors included.
© 2005 by CRC Press
DITM: “tf1732_c007” — 2004/10/20 — 15:44 — page 139 — #7
QUALITY CONTROL IN TERRAIN DATA ACQUISITION 139
7.3.2 Low-Pass Filter for Noise Filtering
A low-pass filter is usually implemented as a convolution procedure, which is an
integral expressing the amount of overlap of one function (X) as it is shifted over
another function (f). Convolution can take place either as a 1-D or a 2-D operation.
However, the principles are the same in both cases. Therefore, for simplicity, the 1-D
convolution is presented here.
Suppose X(t ) and f(t) are two functions, and the result of convolving of X(t )
with f(t)is Y(t). Then, the value of Y(t)at position u is defined as:
Y(t) =
+∞
−∞
X(t)f(u −t)dt (7.2)
In DTM data filtering, X(t ) refers to the input terrain data containing random errors;
f(t)can be considered as a normalized weighting function; and Y(t) comprises the
low-frequency components of the terrain variations present in the input data and is
the remaining part after filtering out random noise. Practically, it is not necessary
to have the integration from negative to positive infinity for Equation (7.2). In most
cases, an integral that operates over a restricted length will do.
Certain functions such as a rectangular function, a triangular function, or a
Gaussian pulse can be used as the weighting function for this purpose. The Gaussian
function is more widely used. The expression is:
f(t) = e
(−t
2
/2σ
2
)
= exp(−t
2
/2σ
2
) (7.3)
The definition of convolution given in Equation (7.3) applies to continuous functions.
However, in DTM practice, the source data are only available in a discrete form.
Therefore, only the discrete convolution operation is of interest here. The principle of
the operation is to use a symmetric function as a weighting function. It will be used
here as the weighting function, since the Gaussian function is symmetric. Its principle
as applied in 1-D is explained below. Suppose,
X(t) = (A
1
, A
2
, A
3
, A
4
, A
5
, A
6
, A
7
)
f(t) = (W
1
, W
2
, W
3
, W
4
, W
5
)
and
Y(t) = (B
1
, B
2
, B
3
, B
4
, B
5
, B
6
, B
7
)
Then, the discrete convolution operation can be illustrated in Table 7.1. To explain
how it works, the result for B
4
can be taken as an example,
B
4
= W
1
×A
2
+W
2
×A
3
+W
3
×A
4
+W
4
×A
5
+W
5
×A
6
The size of the window and the weights selected for the various data points lying
within the window have a great effect on the degree of smoothing achievable by the
© 2005 by CRC Press
DITM: “tf1732_c007” — 2004/10/20 — 15:44 — page 140 — #8
140 DIGITAL TERRAIN MODELING: PRINCIPLES AND METHODOLOGY
Table 7.1 Discrete Convolution Operation
X (t) 00A
1
A
2
A
3
A
4
A
5
A
6
A
7
00
Operation ×+×+×+×+×+×+×+×+×+×+×Results
W
1
W
2
W
3
W
4
W
5
B
1
W
1
W
2
W
3
W
4
W
5
B
2
W
1
W
2
W
3
W
4
W
5
B
3
f (t) W
1
W
2
W
3
W
4
W
5
= B
4
W
1
W
2
W
3
W
4
W
5
B
5
W
1
W
2
W
3
W
4
W
5
B
6
W
1
W
2
W
3
W
4
W
5
B
7
Table 7.2 Sample Values of the Gaussian Function as Weights for
Convolution
t 0.0 × σ 0.5 × σ 1.0 × σ 1.5 × σ 2.0 × σ 3.0 × σ
f (t) 1.0 0.8825 0.6065 0.3247 0.1353 0.0111
convolution operation. For example, if only one point is within the window, then no
smoothing will take place. Also, the smaller the differences in the weights given to
the points lying within the window, the larger the smoothing effect it will have. For
example, if the same weight is given to each point within the window, then the result is
simply the arithmetic average. Table7.2listssomeofthevalues fortheGaussianpulse
expressed by Equation (7.3). From these values, a variety of weighting matrices may
be constructed. The weight matrix can also be computed directly from Equation (7.3)
using predefined parameters.
7.3.3 Improvement of DTM Data Quality by Filtering
Li (1990) conducted a test on the improvement of DTM data quality by noise filtering.
The source data was generated by using acompletelydigitalphotogrammetricsystem.
The digital photos used in the system were formed from a pair of aerial photos taken
at a scale of 1 : 18,000 using a scanning microdensitometer with a pixel size of 32 µm.
The data were measured in a profiling mode with a 4-pixel interval between measured
points; thus, the interval between any two data points is 128 µm on the photo. The
data points acquired from image matching produced a data set only approximately
in a grid form in this test area, with grid intervals of about 2.3 m. The data are very
dense. In an area of 1 cm × 1 cm at photo scale, approximately 8588 (113 × 76)
points were measured. This data set provides very detailed information about the
terrain roughness. The check points used for this study were measured from the same
photos in hardcopy form using an analytical instrument.
A filter based on the convolution operation described above was used for this test.
Since the original data were not in an exact grid, a 1-D convolution was carried out
on each of the two grid directions rather than a single 2-D operation. Therefore, for
each point, the average of the two corresponding values was used as the final result.
The window size comprises five points in each grid direction. The five weights for
© 2005 by CRC Press
DITM: “tf1732_c007” — 2004/10/20 — 15:44 — page 141 — #9
QUALITY CONTROL IN TERRAIN DATA ACQUISITION 141
Table 7.3 Accuracy Improvement with Random Noise Filtering
(Li 1990)
Parameters Before Filtering After Filtering
+Maximum residual (m) +3.20 +2.67
−Maximum residual (m) −3.29 −2.76
Mean (m) 0.12 −0.02
Standard deviation (m) ±1.11 ±0.98
RMSE (m) ±1.12 ±0.98
No. of check points 154 154
3.5555
3.5550
3.5545
3.5540
3.5535
3.5530
2.6520 2.6530 2.65402.65352.6525
3.5555
(a)
(b)
3.5550
3.5545
3.5540
10
8
3.5535
3.5530
2.6520 2.6530 2.65402.65352.6525
400
400
350
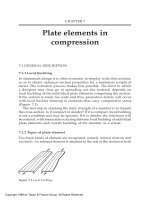
Figure 7.3 Improvement of data quality by using a low-pass filter (Li 1990). (a) Contours
generated from the original data. (b) Contour generated from the smoothed data.
these five points were computed according to Equation (7.3) individually since the
point intervals varied. These values before normalization were approximately:
f(t) = (0.135, 0.6065, 1.0, 0.6065, 0.1353) (7.4)
In computing the value for each of these five weights corresponding to each of the
five points lying within the window, the distance of the point to the central point of
the window was used as the value of the variable t in Equation (7.2). Also, the average
value of the intervals between each pair of data points (i.e., 2.3 m) was used as the
variable σ . Table 7.3 shows the comparison between the accuracy of the experimental
DTM data before and after filtering. It is clear that the improvement in RMSE was
about 17%. Figure 7.3 shows the corresponding contours before and after filtering.
It can be seen clearly that the small fluctuations in the contour shapes arising from
noise in the data have to a large extent been removed after the filtering. Therefore,
the presentation of the contours after filtering is also much better visually.
7.3.4 Discussion: When to Apply a Low-Pass Filtering
The data set used in this study was very dense. Realistically, such a dense data set can
only beobtainedfrom devices equippedwithautomated or semiautomatedtechniques,
© 2005 by CRC Press
DITM: “tf1732_c007” — 2004/10/20 — 15:44 — page 142 — #10
142 DIGITAL TERRAIN MODELING: PRINCIPLES AND METHODOLOGY
for example, using image-matching techniques based on automatic image correlation.
In such a data set, loss in the fidelity of the representation of terrain topology is not
likely to be a serious problem. By contrast, the effect of random errors involved in the
measuring process and of any other random noise on the data quality is considerable
at the local or detailed level.
From the study it is clear that the availability of too detailed information about the
roughness of the terrain topography, coupled with the measuring errors likely to be
encountered with image-matching techniques, can have a significant negative effect
on DTM data quality and thus on the quality of derived DTM products. Therefore,
with dense data, a filter such as that based on a convolution operation can be used to
smooth the digital data set and improve the quality.
An important question arising is: “when should a filtering process be applied
to digital data?” That is also to say, “under what circumstances is it necessary to
apply a filtering process to the data?” This is a question very difficult to answer. The
magnitude of random errors occurring during measurement needs to be taken into
consideration. From the literature it can be found that 70 to 90% of photogrammetric
operators are measuring with a precision (RMSE) within the range ±10 to 20 µm
(Schwarz 1982). This could be a good indicator. Alternatively, according to Kubik and
Roy (1986), 0.05‰ of H (flying height) might be regarded as an appropriate value.
Therefore, a rough answer to this question might be that if the accuracy loss arising
from data selection and reconstruction (topographic generalization) is much larger
than this value (0.05‰ of H ), then a filtering process is not necessary. In contrast,
if random noise does form an important part of the error budget, then a filtering
process may be applied to improve data quality.
7.4 DETECTION OF GROSS ERRORS IN GRID DATA BASED
ON SLOPE INFORMATION
Often the presence of gross errors will distort the image (i.e., the appearance) of the
spatial variation present in DTM data sets much more seriously than that resulting
from random noise. In some cases, totally undesirable results may be produced in
the DTM and in the products derived from it, due to the existence of such errors.
Therefore, methods are needed to detect this type of errors in DTM data set and to
ensure their removal from the data set. In Section 7.2, some on-line methods were
described and from this section onward, some off-line methods will be presented.
DTM source data may be either in a regular grid or irregularly distributed. Regular
grid data have a certain special characteristic. That is, they can be stored in a concise
and economic form in a height matrix. This can also help in designing an algorithm
for gross error detection. However, an algorithm suitable for application to grid data
is unlikely to suit irregularly distributed data. Therefore, different approaches need
to be taken for the detection of gross errors in each of these two cases. In this section,
algorithms for the detection of gross errors in a regular grid data set are developed
while two algorithms for detecting gross errors in irregularly distributed data will be
presented in Section 7.5 and Section 7.6.
© 2005 by CRC Press
DITM: “tf1732_c007” — 2004/10/20 — 15:44 — page 143 — #11
QUALITY CONTROL IN TERRAIN DATA ACQUISITION 143
7.4.1 Gross Error Detection Using Slope Information: An Introduction
To develop algorithms for gross error detection, the first question is “what kind of
information can be used for this purpose?” Slope is the fundamental attribute of a
terrain point and, therefore, slope information can probably serve as the basis for
the development of suitable algorithms. The second problem to be considered is the
feasibility of obtaining the slope information from the data set. The computation of
the slope of each grid point in different directions does not present a real problem.
In this view, it appears promising to make use of slope information as the basis for
developing algorithms for detection of gross errors. Hannah (1981) and Li (1990)
both have used slope information for such a purpose.
Hannah (1981) developed an algorithm for the reduction of gross errors, based
on the absolute slope values. The principle of Hannah’s algorithm can be described
briefly as follows. As a first step, the slopes between the point under investigation,
say P, and its neighbors (eight if not located on the boundary) are computed. Once
this has been done for the whole data set, three tests are carried out on the slopes.
1. The first test, called a slope constraining test, checks the (eight) slopes immedi-
ately surrounding P to see if they are reasonable, that is, whether they exceed the
predefined threshold value or not.
2. The second, called the local neighbor slope consistency test, checks the four pairs
of slopes crossing P to see if the absolute value of the difference in slope in each
pair exceeds the given threshold value.
3. The third, called the distant neighbor slope consistency test, is similar to the second
test. This test checks whether pairs of slopes approaching a point across each of
the eight neighbors are consistent.
The results of these three tests are used as the basis to judge whether a point is
accepted or rejected. It has been found (Li 1990) that this algorithm produces an
over-smoothing result in areas of rough terrain in order to detect the gross errors or
other unnatural features of relatively smooth terrain.
Li (1990) further pointed out that the most serious demerit of Hannah’s algorithm
is that all the criteria for acceptance or rejection of data are expressed in an absolute
sense. Obviously, absolute slope values and slope differences will vary from place
to place. For example, in an area with rough terrain, absolute slope differences will
be larger than those found in smooth areas. Absolute values of slopes in steep areas
will be larger than those found in flat areas. That is, it is not feasible for an absolute
threshold value to be suitable overall for an area of interest except in a homogenous
area. For this reason, Li (1990) tried to make relative thresholds for his algorithm
development and his algorithm will be presented in the following sub-sections.
7.4.2 General Principle of Gross Error Detection Based on an
Adaptive Threshold
The algorithm developed by Li (1990) is based on the concept of slope consistency.
Instead of absolute values of slope and slope changes, relative values are considered.
© 2005 by CRC Press
DITM: “tf1732_c007” — 2004/10/20 — 15:44 — page 144 — #12
144 DIGITAL TERRAIN MODELING: PRINCIPLES AND METHODOLOGY
123
8
45
(I +1, J –1) (I +1, J +1)(I +1, J )
(I –1, J –1) (I –1, J+1)(I –1, J )
(I , J –1) (I, J +1)(I, J )
P
1210
15
18
16
19
17
20
76
9
14
13
11
Figure 7.4 Point P in the original grid data and its neighbors.
Furthermore, a statistic is taken from these relative values and is then used as the
threshold value to measure the validity of a data point instead of using a predefined
value. Thus, this algorithm is adaptive to any data set.
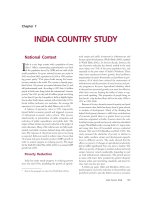
As shown in Figure 7.4, data point P can be defined by its row and column number,
(I , J ) within the height matrix. Its eight immediate neighbors — points 5, 6, 7, 10,
12, 15, 16, and 17 — can also be defined by row and column as (I + 1, J − 1),
(I + 1, J), (I + 1, J + 1), (I, J − 1), (I, J + 1), (I − 1, J − 1), (I − 1, J), and
(I −1, J +1). From these eight points and point P itself, six slopes can be computed
in both the row (i.e., I) and the column (i.e., J ) directions. Taking the row direction
as an example, six slopes — those between points 5 and 6, 6 and 7, 10 and P, P and
12, 15 and 16, as well as 16 and 17 — can be computed. From the set of six slope
values, three slope changes can then be computed. For example, the slope changes at
points 6, P, and 16 can be computed from those values mentioned above. These initial
values are given in an absolute sense and will vary from place to place. Therefore,
some relative values need to be computed from them.
If there is no gross error at point P, then for the same direction (e.g., the row
direction), the difference in the slope change(DSC)atpointPandthat at its immediate
neighbor (e.g., point 6 or 16) located in the row direction will be consistent, even
though the absolute values of slope and slope change may vary from place to place.
Therefore, these differences in slope change are the relative values that are being
searched for and can be used as the basis of a method for detecting gross errors.
That is, for each point except those along the boundary, two DSC values can
be computed from the three slope changes in each direction. The DSC values from
all the data points will be used as the basic information for this algorithm. From
these DSC values, a statistic will be computed and it will then be used to construct
the required threshold value. Then, this threshold value will be used as the basis on
which a judgment is made as to whether or not a point has a gross error in elevation.
For example, if all four DSC values centred at P exceed the threshold value, then P
will be suspected of containing gross errors.
© 2005 by CRC Press
DITM: “tf1732_c007” — 2004/10/20 — 15:44 — page 145 — #13
QUALITY CONTROL IN TERRAIN DATA ACQUISITION 145
7.4.3 Computation of an Adaptive Threshold
In this computation, first of all, the DSC values in both row and column directions
are computed and then these DSC values are used to compute an adaptive threshold.
The computation of the slope (Slope) in the J direction, for example, is as follows:
Slope
j
(I +1, J −1) =
Z(I + 1, J)−Z(I +1, J −1)
Dist(J −1, J)
(7.5)
where Dist(J −1, J) is the distance between the nodes at (I +1, J) and
(I +1, J −1), that is, equal to the grid interval.
Similarly the values Slope
j
(I +1, J), Slope
j
(I , J − 1), Slope
j
(I , J),
Slope
j
(I −1, J −1), and Slope
j
(I −1, J) can be calculated. The computation of
slopes in the other (I) direction is similar. After calculating the slopes, three slope
changes (SlopeC) in each direction can be computed. For example, in the J direction,
the computation is as follows:
SlopeC
j
(I , J) = Slope
j
(I , J)−Slope
j
(I , J − 1) (7.6)
Also, SlopeC
j
(I +1, J) and SlopeC
j
(I −1, J) can be computed similarly. The
computation of slope changes in the I direction is also similar. After this, two
differences in slope change (DSlopeC) for the point (I, J ) in each direction can
be computed as follows:
J direction:
DSlopeC
j
(I , J ,1) = SlopeC
j
(I , J)−SlopeC
j
(I +1, J)
DSlopeC
j
(I , J ,2) = SlopeC
j
(I , J)−SlopeC
j
(I −1, J)
(7.7)
I direction:
DSlopeC
j
(I , J ,1) = SlopeC
j
(I , J)−SlopeC
j
(I , J + 1)
DSlopeC
j
(I , J ,2) = SlopeC
j
(I , J)−SlopeC
j
(I , J − 1)
(7.8)
All DSC values calculated from all the data points will be used for computation
of a statistic, which will then be used as threshold for acceptance or rejection of the
point. For such a statistic, the absolute mean, the range (biggest minus smallest),
the mode, the RMSE, as well as the standard deviation and mathematical mean are
all possible options. Li (1988) made a thorough analysis on the possible statistics and
Li (1990) made some observations from experiments and then concluded that RMSE
is as good as the combination of the mathematical mean and standard deviation.
Thus, the threshold value is simply K times RMSE of the DSC values, that is,
DSC
T
= K × RMSE(DSC) (7.9)
© 2005 by CRC Press
DITM: “tf1732_c007” — 2004/10/20 — 15:44 — page 146 — #14
146 DIGITAL TERRAIN MODELING: PRINCIPLES AND METHODOLOGY
where K is a constant. It has been found that the DSC values are quite normally
distributed and thus a value of 3 has been used for the constant K. There are three
possible ways to compute RMSE values:
1. Compute the only RMSE value from all DSC values at all the data points in all
directions.
2. Compute four RMSE values from the DSC values at all the data points, one for
each of the four directions (above, left, below, and right) defining each data point.
3. Compute two RMSE values, one of which is related to the row (i.e., the I)direction
and the other to the column (i.e., the J) direction. In this case, the two DSC values
of each point in the same direction, say the J direction, are added together to get a
new value and the RMSE value can be computed from these new values.
Theoretically, the last method is most reasonable because the absolute value of a
sum of the two DSC values at the same point (e.g., P) in the same direction (e.g., in
the J direction) will become smaller (approaching 0) if the slope change is consistent,
and it will become larger if it is not consistent. Li (1990) tried different criteria and
his results proved this point.
7.4.4 Detection of Gross Error and Correction of a Point
All the methodology described above is designed to judge whether or not a point has a
gross error. A particular threshold value for an individual direction is used as the basis
for judgment. If the threshold is exceeded, then this point is regarded as unnatural in
the neighborhood and is suspected of having a gross error.
The procedures used for detecting a gross error in all the methods described above
are similar. The only difference is to compare the DSC values with the overall RMSE
or a particular RMSE value. Taking the second method as an example, if the absolute
value of the DSC at a point along a single side is greater than the threshold value —
K times the RMSE of this side — then the point is suspected of being unnatural
compared to the values in the neighborhood. If all four sides around the point are
suspect, then this particular point will be suspected of having a gross error. In most
cases, if three sides of a point are suspected, then again it is regarded as having a
gross error. For the last method, if a point is suspected in both the row and the column
directions, then it is regarded as containing a gross error.
It is possible that some gross errors have not been detected in a single run if they
are located close together, in that case, a point that has a gross error may still be
considered natural if its neighbors also have gross errors of a similar magnitude. This
means that a further detection of the remaining gross errors may be necessary. To
improve the results in the next run, correction of those points found to have gross
error must be done first. The principle of data correction used in this algorithm is as
follows: In Figure 7.4, suppose that point P is the point containing a gross error, and
points 1 to 20 are its neighbors. In the process of detecting gross errors, the slope
and slope change values at all these points have been calculated (except those points
near boundaries). From points 6, 16, 10, and 12, four estimates have been made.
The estimate from Point 10 may be taken as an example. The average of the slope
© 2005 by CRC Press
DITM: “tf1732_c007” — 2004/10/20 — 15:44 — page 147 — #15
QUALITY CONTROL IN TERRAIN DATA ACQUISITION 147
change values at points 5 and 15 (in the J direction) are taken as the estimated slope
change at point 10 (in the same direction). The new slope at point 10 (to P) can then
be computed as follows:
Slope(10, J) = Slope(9, J)+
SlopeC(5, J)+SlopeC(15, J)
2
(7.10)
where Slope(10, J) and Slope(9, J)denote the slopes at points 10 and 9 in the J
direction, respectively, and SlopeC(5, J)and SlopeC(15, J)denote the slope changes
at points 5 and 15 in the J direction, respectively.
These slope values are used to compute the height values of point P. Finally,
the average of four such estimates is used as the height estimate for point P. If either
points 9 or 10 is suspected of having a gross error, or if other neighbors in this side
(points 4, 5, 6, 14, 15, and 16 ) are suspected of having gross errors, then any estimate
from this side will be unreliable and should not be used. It is also possible that no
reliable estimate can be made for point P in a single run. Therefore, some form of
interactive processing is needed.
7.4.5 A Practical Example
Figure 7.5 shows how this algorithm works. Figure 7.5(a) shows the contours pro-
duced from a set of original DTM data. Clearly, some residual errors exist producing
unnatural features in some of these contours. After applying gross error detection
procedures, the corresponding contour plot, as shown in Figure 7.5(b), illustrates that
these unnatural features have been removed.
7.5 DETECTION OF ISOLATED GROSS ERRORS IN
IRREGULARLY DISTRIBUTED DATA
In an irregularly distributed data set, the information that is conveniently available
to users is the set of X, Y , Z coordinates of the data points. Therefore, the height
for every data point and its neighbors can be used to assess the validity of the data
elevations. The algorithm to be described in this section (Li 1990) is based on this
height information.
112
114
116
112
114
116(a) (b)
Figure 7.5 An example of contours produced from the data set before and after gross
error removal: (a) contours generated from original data and (b) contours generated
after removal of gross errors.
© 2005 by CRC Press
DITM: “tf1732_c007” — 2004/10/20 — 15:44 — page 148 — #16
148 DIGITAL TERRAIN MODELING: PRINCIPLES AND METHODOLOGY
Gross errors may be scattered as isolated occurrences or they might occur in
clusters. In the latter case, the situation is more complicated. In this section, an algo-
rithm for detecting individual gross errors scattered in the data set will be discussed.
Then, in Section 7.6, this algorithm will be modified to suit the detection of gross
errors occurring in clusters.
7.5.1 Three Approaches for Developing Algorithms for Gross
Error Detection
Depending on the size of the area, three approaches can be distinguished for the
development of algorithms for gross error detection, namely global, regional, and
local approaches.
Any method using a global approach must involve the construction of a global
surface through all points in the data set using a high-order polynomial function
and then checking the deviation of each data point from the constructed surface.
If the deviation is greater than the threshold value, then this point is considered to
have a gross error. The threshold value might be predefined or it may be computed
from the deviations of the heights of the data points from the global surface. This
was discussed in Section 7.2 as tread surface analysis. Global techniques, as Hannah
(1981) pointed out, “have the drawback that they give identical treatment to all areas.”
However, terrain is rarely uniform in roughness, so the uniform application of a global
technique to an area may result in too many points being regarded as having gross
errors in rough areas, whereas in fact they do not, while failing to detect gross errors
in relatively smooth areas. That is to say, the final result could be totally undesirable
or misleading.
The methods employed in a regional approach could be similar to those used in
the global approach, that is, constructing a regional surface by use of a polynomial
function and then checking the deviations of the data points from the specific surface.
The difference is the size of the area of the surface. The adequacy of this approach
depends partly on this.
A major drawback in using a polynomial function to fit the terrain surface, regard-
less of the size of the area that such a surface covers, is that those points that have
gross errors will also have been used to construct the DTM surface. In this case, all
points near the particular point with a large gross error may have large deviations
from the constructed DTM surface due to the large influence of the erroneous point
on the constructed surface. Thus, they may all be identified as having gross errors
when in fact this is not the case.
If a local approach is employed, then the use of a polynomial surface to fit the data
points can be avoided. A method similar to that used in pointwise interpolation can be
employed. This involves comparing the height of the point with a representative value
such as the average height derived from the heights of its neighbors. As a result, if
the difference is larger than a certain threshold value, then this point can be regarded
as having a gross error.
The principle of the pointwise method is very simple and intuitive and the
computation is also not complex. A simple algorithm that has been developed by
© 2005 by CRC Press
DITM: “tf1732_c007” — 2004/10/20 — 15:44 — page 149 — #17
QUALITY CONTROL IN TERRAIN DATA ACQUISITION 149
Li (1990) will be described in this section. Felicísimo (1994) has also developed
a similar algorithm but it is omitted here.
7.5.2 General Principle Based on the Pointwise Algorithm
For a specific point P, a window of a certain size is first defined centered on P.
Then, a representative value will be computed from all the points located within this
window. This value is then regarded as an appropriate estimate for the height value of
the point P. Or this value can be regarded as the true value of point P. By comparing
the measured value of P with the representative value estimated from the neighbors,
a difference in height can be obtained. If this difference is larger than the computed
threshold value, then this point is suspected of having a gross error. The computation
of the threshold will be discussed later.
In this method, the height of point P is not taken into consideration when com-
puting the representative value for P. Therefore, the height of point P has no influence
on the estimated value derived from the neighbors. This provides more reliable
information about the relationship between P and its neighbors.
7.5.3 Range of Neighbors (Size of Window)
The range of the area within which neighboring points will be searched for is specified
by a window centered on point P. This can be specified by defining either an area or
the number of nearest points required. The former can be expressed as follows:
X range:
X
P
−D
x
<X
i
<X
P
+D
x
(7.11a)
Y range:
Y
P
−D
y
<Y
i
<Y
P
+D
y
(7.11b)
where X
P
and Y
P
are the coordinates of P — the point under inspection; X
i
and Y
i
are the X and Y coordinates of the ith point in the neighborhood; and D
x
and D
y
are
the half-window sizes in the X and Y directions, respectively.
Also, a combination of both criteria can be used. The average window size can
be computed according to the total number of points and the coordinate range of the
area. This average value can be used as the initial window size. In an area with a
higher density of points, the number of points lying within a window of this size will
be larger than average. However, in a lower-density area, only a few points may be
located inside such a window. Therefore, a minimum number of points may also need
to be specified. If the number of points within a window is smaller than the specified
value, then the window is enlarged a little until the specified number of points is
reached.
© 2005 by CRC Press
DITM: “tf1732_c007” — 2004/10/20 — 15:44 — page 150 — #18
150 DIGITAL TERRAIN MODELING: PRINCIPLES AND METHODOLOGY
7.5.4 Calculating the Threshold Value and Suspecting a Point
In this algorithm, the average height of the neighbors is used as the representative
value. This value can be computed in either of two ways. One is to simply take the
arithmetic mean and the other is to use a weight for every point according to its
distance from the point, making the weight inversely proportional to the distance.
The weighted mean should be closer to the real value of P if there are no gross
errors in the neighborhood. However, if a point with a large gross error is close to P,
then the weighted mean will be greatly affected by this point, thus producing an
unreliable value. Therefore, the simple arithmetic mean may be more desirable. In
fact, practical tests confirm this. In addition, the calculation of the simple arithmetic
mean takes much less computation time. It is, therefore, used in this algorithm.
In this algorithm, the height differences of all points are used to compute a
statistical value, which will then serve as the basis for determining a threshold value.
Suppose M
i
is the arithmetic mean of the neighboring points centered at the ith point
in the data set and the difference between the M
i
and the height value of this (ith)
point (H
i
) is V
i
, then
V
i
= H
i
−M
i
(7.12)
If the data set has N points, then the total number of V values is also N. The required
statistical value can be computed from these values of V . In this study, the math-
ematical mean (µ) and standard deviation (σ) are computed from V values and are
then used as the basis for calculating the threshold value:
V
Threshold
= K × σ (7.13)
where K is a constant and in this algorithm K = 3.
After the threshold value has been set, every point in this data set can be checked.
For any point i, if the absolute value of (V
i
− µ) is larger than this threshold value,
it is suspected of containing a gross error.
7.5.5 A Practical Example
The distribution of the data set and the contours generated from it are shown
in Figure 7.6. Figure 7.6(a) shows the irregular distribution of the data points.
Figure 7.6(b) (the corresponding contour plot) shows clearly that there are gross
errors in the data set, especially in the upper-left corner. The size of this area is about
4.5 cm ×4.5 cm on the photo and about 800 m × 800 m on the ground. Within this
area, the height value of 3496 points was measured by image matching.
In this example, the simple arithmetic mean was used as the representative value
derived from the neighboring points while the window size was defined by the com-
bination of specifying an area size and a certain number of points. The minimum
number of points was initially defined as five. As a result, the algorithm did not work
well. The number was gradually increased and it was found that a number between
15 and 20 gave the best results.
© 2005 by CRC Press
DITM: “tf1732_c007” — 2004/10/20 — 15:44 — page 151 — #19
QUALITY CONTROL IN TERRAIN DATA ACQUISITION 151
3.557
(a) (b)
3.556
3.555
3.554
3.553
3.552
3.551
3.550
2.649
2.657
2.656
2.655
2.654
2.653
2.652
2.651
2.650
3.557
3.556
3.555
3.554
3.553
3.552
3.551
3.550
2.649
2.657
2.656
2.655
2.654
2.653
2.652
2.651
2.650
500
150
350
250
250
250
350
400
300
300
300
Figure 7.6 Distribution of acquired points with gross errors. (a) The distribution of data points.
(b) Unnatural contour produced.
3.557
3.556
3.555
3.554
× 10
5
× 10
5
× 10
5
× 10
5
3.553
3.552
3.551
3.550
2.649
2.657
2.656
2.655
2.654
2.653
2.652
2.651
2.650
3.557
3.556
3.555
3.554
3.553
3.552
3.551
3.550
2.649
2.657
2.656
2.655
2.654
2.653
2.652
2.651
2.650
350
350
250
250
250
350
400
300
300
300
(a) (b)
Figure 7.7 Detection and removal of gross errors from a data set: (a) gross error points detected
and (b) the data set after removal of gross errors.
After applying this algorithm, those points that generated the unnatural contours
were detected and their locations plotted in Figure 7.7(a). The data points after
removal of those erroneous points were used to produce the contour map shown
in Figure 7.7(b). It can be seen that this algorithm worked well.
7.6 DETECTION OF A CLUSTER OF GROSS ERRORS IN
IRREGULARLY DISTRIBUTED DATA
7.6.1 Gross Errors in Cluster: The Issue
It must be pointed out that the algorithm described in the previous section works only
in the case of isolated gross errors. When the gross errors are in cluster, the algorithm
© 2005 by CRC Press
DITM: “tf1732_c007” — 2004/10/20 — 15:44 — page 152 — #20
152 DIGITAL TERRAIN MODELING: PRINCIPLES AND METHODOLOGY
3.557
3.558
3.559
(a)
3.556
3.555
× 10
5
× 10
5
2.649 2.6572.6562.6552.6542.6532.6522.6512.650
3.557
3.558
3.559
(b)
3.556
3.555
× 10
5
× 10
5
2.649 2.6572.6562.6552.6542.6532.6522.6512.650
450
450
450
Figure 7.8 A set of data with gross errors in cluster. (a) Distribution of the original data set.
(b) Contours from the original data set with gross errors.
will fail to work. Figure 7.8(a) shows the distribution of a set of data obtained from
image matching. The corresponding contour plot is shown in Figure 7.8(b). The
size of this area is about 4.0 cm × 2.2 cm on the photo and about 700 m × 400 m
on the ground. In total, the elevation values of 4733 points were available within
this area. Some gross errors are present in the data set, as can be seen clearly from
Figure 7.8(b).
The algorithm with all the parameters and window size set in the previous example
was applied and the result is shown in Figure 7.9. From the contour plot, it can be seen
that there are still some gross errors left in the data set. A much larger window size
(containing 60 points) was used, but the algorithm still failed to detect gross errors
because the remaining gross errors occurred in clusters. In this section, an algorithm
for detection of such errors in cluster developed by Li (1990) will be presented.
© 2005 by CRC Press
DITM: “tf1732_c007” — 2004/10/20 — 15:44 — page 153 — #21
QUALITY CONTROL IN TERRAIN DATA ACQUISITION 153
3.557
3.558
3.559
(a)
3.556
3.555
× 10
5
× 10
5
2.649 2.6562.6552.6542.6532.6522.6512.650
3.557
3.558
3.559
(b)
3.556
3.555
× 10
5
× 10
5
2.649 2.6562.6552.6542.6532.6522.6512.650
450
450
400
450
Figure 7.9 Result after removal of gross errors in isolation. (a) Gross error points detected.
(b) Contours from the data set after removal of isolated gross errors.
7.6.2 The Algorithm for Detecting Gross Errors in Clusters
Theoretically, the use of an increased window size should solve the problem of detect-
ing grosserrorsinclusters. However, an algorithmmaystill fail towork withawindow
size of up to 60 points, as discussed in the previous section. If the window size is
increased more, it might work in some cases, but the results may not be satisfactory
since the representative value derived from the neighboring points may then have
deviated from what it should be, thus leading to an erroneous conclusion being made.
There should be an alternative solution.
The idea behind the development of this algorithm is to find those points that have
the most influence on the representative value, that is, the average value in this case.
© 2005 by CRC Press
DITM: “tf1732_c007” — 2004/10/20 — 15:44 — page 154 — #22
154 DIGITAL TERRAIN MODELING: PRINCIPLES AND METHODOLOGY
Then, these points would not be used to compute the representative value. The method
used for point data snooping in a window is similar to the idea used in the previous
algorithm. The procedure used is as follows.
Take the first point out of the window and calculate a new value of the repre-
sentative value from the remaining points; then, compute and record the difference
between this average and the original one. This procedure is then applied to every
point in the window. Suppose there are N points in the window, then N differences
can be obtained as follows:
V
i
= M
P
i
−M
P
(7.14)
where M
P
is the average value computed from all the points in the window; M
P
i
is
the average value computed from all the remaining neighboring points in the window
other than the ith point, which was taken out of the window; and V
i
is the difference.
The rest of the procedure is the same as was used for the previous algorithm. That is,
the M values of V are used to compute a single statistical value, which is then used
as the basis on which to construct a threshold value for snooping data points within
the window. After that, every value of V can be checked. If any value of V , say V
j
,
exceeds this threshold value, then point J will be suspected of having gross errors and
excluded from this window. In this way, all points that appear to make a great change
in the representative value in a window will be excluded.
This point data detecting technique is then applied to each window. After this has
been done, the rest of the procedure is exactly the same as the procedures described
in the previous section, that is, computing a representative value, constructing a
threshold value, and identifying suspect points.
7.6.3 A Practical Example
This algorithm was applied to the data set shown in Figure 7.8. The gross errors
detected by this algorithm are plotted in Figure 7.10(a) and the contours produced
from the data set after removal of gross errors are shown in Figure 7.10(b). It can be
seen from Figure 7.10(b) that there is still a point with a small gross error located
in the northwest of the test area since it produces an unnatural contour in that part
of the plot. The reason why this point was not detected by this algorithm could be
due to the fact that, in applying this algorithm, a larger window size needs to be
used. For example, a minimum number of 35 points was specified. However, the use
of a large window size resulted in a decrease in the sensitivity of this algorithm to
gross error.
Inspection of Figures 7.10(a) and Figure 7.8(a) reveals that the majority of the
gross errors detected by these two algorithms are identical. However, each may
miss one or more points for the reasons discussed previously. Therefore, using both
algorithms together may produce a more desirable result, because all points detected
by both of them should be deleted from the data set. Figure 7.11 shows the gross errors
detected by both algorithms. It can be found that a much more reasonable result was
produced after removing them.
© 2005 by CRC Press
DITM: “tf1732_c007” — 2004/10/20 — 15:44 — page 155 — #23
QUALITY CONTROL IN TERRAIN DATA ACQUISITION 155
3.557
3.558
3.559
(a)
3.556
3.555
× 10
5
× 10
5
2.649 2.656 2.6572.6552.6542.6532.6522.6512.650
× 10
5
2.649 2.656 2.6572.6552.6542.6532.6522.6512.650
3.557
3.558
3.559
(b)
3.556
3.555
× 10
5
450
450
400
450
Figure 7.10 Results obtained by algorithm for detecting a cluster of gross errors: (a) gross error
points detected and (b) contours from the data set after removal of gross errors.
7.7 DETECTION OF GROSS ERRORS BASED ON TOPOLOGIC
RELATIONS OF CONTOURS
7.7.1 Gross Errors in Contour Data: An Example
As has been discussed previously, contour data are one of the main sources for digital
terrain modeling. From analog map to digital data, one has to digitize the contour
lines. During the course of digitization, elevation values of contours are normally
entered by the operator. Quite often, the data points are recorded as follows:
1. N
1
(number of points in contour 1), H
1
(height of contour 1)
• X
1
(X coordinates of point 1), Y
1
(Y coordinates of point 1)
• X
2
(X coordinates of point 2), Y
2
(Y coordinates of point 2)
• ······················································
• X
N
1
(X coordinates of point N
1
), Y
N
1
(Y coordinates of point N
1
)
2. N
2
(number of points in contour 2), H
2
(height of contour 2)
• X
1
(X coordinates of point 1), Y
1
(Y coordinates of point 1)
• ······················································
© 2005 by CRC Press
DITM: “tf1732_c007” — 2004/10/20 — 15:44 — page 156 — #24
156 DIGITAL TERRAIN MODELING: PRINCIPLES AND METHODOLOGY
3.557
3.558
3.559
(a)
3.556
3.555
× 10
5
× 10
5
2.649 2.656 2.6572.6552.6542.6532.6522.6512.650
× 10
5
2.649 2.656 2.6572.6552.6542.6532.6522.6512.650
3.557
3.558
3.559
(b)
3.556
3.555
× 10
5
450
450
400
450
Figure 7.11 Results obtained from the complementary use of these two algorithms: (a) gross
error points detected and (b) contours from the data set after removal of gross
errors.
Such a manual operation is subject to mistakes, as shown in Figure 7.12. In this
figure, the contour interval is 10 m. The elevation values are 50, 60, 70, 80, 90, 100,
and 110 m. It is obvious that the elevation value of the third contour as indicated in
this figure, that is, the 170 m, must be a mistake.
It should be pointed out that there might be cases where contour lines are broken
(Figure 7.13). For example, when the slope is nearly vertical and the contours overlap,
some contour lines will be broken. Other cases are the space required for indexing
and areas with escarpment or faults. In such cases, the elevations of broken lines are
more prone to error.
7.7.2 Topological Relations of Contours for Gross Error Detection
There are two possible approaches for the detection and removal of gross errors in a
contour data set. One is to regard all the contour data as random points and then to
apply the algorithms described in the previous sections. The other is to employ the
topological relations between neighboring contour lines so as to detect and remove
gross errors.
© 2005 by CRC Press
DITM: “tf1732_c007” — 2004/10/20 — 15:44 — page 157 — #25
QUALITY CONTROL IN TERRAIN DATA ACQUISITION 157
50
60
170
80
90
100
110
Figure 7.12 Contours digitized from a 1 : 10,000 scale map, with a gross error introduced.
Decrease in elevations
14 m
Decrease in
elevations
14 m
15 m
15 m
Increase in elevations
Increase in
elevations
Equal elevation
Figure 7.13 Relations between elevation values of adjacent contours.
Consider the fact that the elevation values of all points on the contour are wrong
if the elevation of a contour line is erroneously given. If a contour is long, it is
not efficient to employ the algorithms described in the previous sections. Therefore,
considering the topological relations of contours is more reasonable and efficient.
There are three possible relations between elevation values of neighboring
contours:
1. increase in elevation
2. decrease in elevation
3. equal elevation.
Figure 7.13 illustrates these three cases. According to these relations, it can be judged
whether the elevation of a contour is wrong.
© 2005 by CRC Press