Ecotoxicological Testing of Marine and Freshwater Ecosystems: Emerging Techniques, Trends, and Strategies - Chapter 6 potx
Bạn đang xem bản rút gọn của tài liệu. Xem và tải ngay bản đầy đủ của tài liệu tại đây (1.72 MB, 34 trang )
195
chapter six
Satellite remote sensing in
marine ecosystem
assessments
T.R. Pritchard and K. Koop
Contents
Introduction 196
Background 196
History and relevance of ocean color 196
Key satellite-mounted sensors 197
Ocean color products 199
Chlorophyll and primary productivity 200
Optically complex coastal waters (Case 2 waters) 201
Environmental issues and applications 202
Global scale phenomena: biogeochemical cycles, climate change,
and El Niño southern oscillation 203
Regional seas: mesoscale processes and biological variability 208
Coastal zones: human activity and ecosystem health 211
Water quality 211
Algal blooms 213
Fisheries 213
Case study: marine algal blooms in coastal waters off southeast
Australia 215
Management issues 215
Developing a predictive understanding using remote sensed data .216
Noctiluca bloom: January 1998 217
Trichodesmium bloom: March and April 1998 220
Conclusions 222
Acknowledgements 222
References 223
3526_book.fm Page 195 Monday, February 14, 2005 1:32 PM
© 2005 by Taylor & Francis Group, LLC
196 Ecotoxicological testing of marine and freshwater ecosystems
Introduction
Remote sensing technologies range from small-scale, high-frequency devices
such as towed video plankton recorders (Davis et al. 1992) to satel-
lite-mounted sensor arrays providing global estimates of primary production
(Joint and Groom 2000). This chapter describes a range of applications of
satellite-sensed data, especially ocean color and sea surface temperature
products, to illustrate how they can be used to develop an understanding
of ecosystems and human impacts on them. Global, regional, and local
applications are summarized after which a more detailed case study is pre-
sented to illustrate how ocean color technology can be employed to develop
a predictive understanding of algal bloom development and associated
issues in the coastal waters of New South Wales, Australia.
Satellite-borne ocean color products have improved in recent years and
many are freely available, so with increased personal computer processing
power, applications now fall within the reach of a vast number of potential
users.
Background
The world’s immense human population exerts profound stresses on
aquatic ecosystems at all scales. Direct impacts occur through catchment
runoff, discharge of wastes, atmospheric deposition of pollutants, overex-
ploitation, and habitat modification. Further, insidious impacts include the
spread of introduced species and manifestations of global warming. Moni-
toring, predicting, and managing changes within coastal ecosystems are
clearly important; remote sensing technologies provide unsurpassed spatial
coverage with ever-increasing spatial, temporal, and spectral resolutions to
help address these issues.
Although this chapter deals with remote sensing and information tech-
nologies that are fast evolving, the type of information needed for assessment
and management of aquatic ecosystems remains essentially the same.
History and relevance of ocean color
The color of the ocean can indicate levels of phytoplankton activity. To the
casual observer, the color of seawater may vary from the dark green of
eutrophic estuarine waters to the deep blue of oligotrophic oceanic waters.
Coastal water colorations, however, are often complex with various hues of
gray, brown, and yellow due to terrigenous influences such as estuarine
plumes, anthropogenic discharges, resuspended sediments, and the presence
of dissolved organic substances.
Shipboard and aircraft studies first showed that radiance upwelling from
the ocean in the visible region (400 to 700 nm) was related to the concentra-
tion of chlorophyll and other plant pigments.
3526_book.fm Page 196 Monday, February 14, 2005 1:32 PM
© 2005 by Taylor & Francis Group, LLC
Chapter six: Satellite remote sensing in marine ecosystem assessments 197
Following this, the first satellite-borne ocean color sensor — the Coastal
Zone Color Scanner (CZCS) — was launched in 1978 as a one-year
"proof-of-concept" mission. Despite this, CZCS delivered ocean color data
for eight years and led to the development of algorithms to estimate primary
productivity in our surface oceans (Platt and Sathyendranath 1988). Data
from CZCS revolutionized the understanding of phytoplankton distribu-
tions and dynamics at a global scale and in many coastal systems (Shannon
1985). Remote sensing provided a synoptic view of large zonal structures
that had been overlooked in field studies and ignored in mathematical mod-
els because time and length scales were not easily detected by classical field
investigations (Nihoul 1984).
After a hiatus of nearly a decade, new ocean color sensors were launched
in the middle and late 1990s in response to the need to quantify the carbon
cycle, and motivated by increasing concerns about climate change and an
appreciation of interactions between climate effects and marine ecosystems.
Key satellite-mounted sensors
Present, future, and past ocean color scanners are summarized in Table 6.1.
Information is updated by the International Ocean Color Ocean Coordina-
tion Group (IOCCG) at />The principal source of published ocean color data presented or referred
to in this chapter is the sea-viewing wide field-of-view sensor (SeaWiFS).
SeaWiFS was launched in 1997 as the operational successor to the CZCS and
was one of the first of a new generation of ocean color satellites (Hooker
and McClain 2000; Acker et al. 2002). Much of the processing, quality control,
and initial analysis of SeaWiFS data in this chapter were undertaken using
the SeaWiFS Data Analysis System (SeaDAS) software (freely available from
).
Analysis and interpretation of ocean color data is often supported by
data from the advanced very-high-resolution radiometers (AVHRRs) aboard
the U.S. National Oceanographic and Atmospheric Administration (NOAA)
series of satellites. AVHRR scanners deliver four to five channels (depending
on the model), including visible and sea surface temperature (SST) images
at spatial resolutions comparable to most satellite-borne ocean scanner data
(Hastings and Emery 1992). Successive satellites have resulted in a time series
of AVHRR data back to 1986.
The launch of the moderate resolution imaging spectroradiometer
(MODIS) in December 1999 represented a further leap in ocean color capa-
bility compared to SeaWiFS, with more wave bands, higher signal-to-noise
ratio, more complex on-board calibration, and the capability of simultaneous
observations of ocean color and sea surface temperature (Joint and Groom
2000). MODIS provides global coverage every one to two days. The U.S.
National Aeronautics and Space Administration (NASA) provides free and
open access to MODIS data, including access to merged data products (Sea-
WiFS/MODIS; see .
3526_book.fm Page 197 Monday, February 14, 2005 1:32 PM
© 2005 by Taylor & Francis Group, LLC
198 Ecotoxicological testing of marine and freshwater ecosystems
Table 6.1
Satellite Mounted Ccean Colour Sensors
Sensor
Agency
Satellite
Launch Date
Swath
(km)
Resolution
(m)
Number
of Bands
Spectral
Coverage (nm)
Current Sensors
COCTS CNSA (China) HaiYang-1 (China) 15/05/02 1400 1100 10 402–12500
MERIS ESA (Europe) ENVISAT-1(Europe) 01/03/02 1150 300/1200 15 412–1050
MODIS-Aqua NASA (USA) Aqua (EOS-PM1) 04/05/02 2330 1000 36 405–14385
MODIS-Terra NASA (USA) Terra (USA) 18/12/99 2330 1000 36 405–14385
OCI NEC (Japan) ROCSAT-1 (Taiwan) 27/01/99 690 825 6 433–12500
OCM ISRO (India) IRS-P4 (India) 26/05/99 1420 350 8 402–885
OSMI KARI (Korea) KOMPSAT (Korea) 20/12/99 800 850 6 400–900
SeaWiFS NASA (USA) OrbView-2 (USA) 01/08/97 2806 1100 8 402–885
Future Sensors
S-GLI NASDA (Japan) GCOM (Japan) 2007 1600 750 11 412–865
VIIRS NASA/IPO NPP 2006 3000 370/740 22 402–11800
VIIRS NASA/IPO NPOESS 2009 3000 370/740 22 402–11800
OCM-II ISRO (India) IRS-P7 (India) 2005/06 — — — —
KGOCI
a
Korea — 2008 3000 500 8 400–865
Past Sensors
CMODIS CNSA (China) Shen Zhou-3 (China) 25/03/02––
15/9/02
— 400 34 403–12500
CZCS NASA (USA) Nimbus-7 (USA) 24/10/78–-
22/06/86
1556 825 6 433–12500
CZI CNSA (China) HaiYang-1 (China) 15/05/02—
1/12/03
500 250 4 420–890
GLI NASDA (Japan) ADEOS-II (Japan) 14/12/02—
25/10/03
1600 250/1000 36 375–12500
MOS DLR (Germany) IRS P3 (India) 21/03/96—
early 04
200 500 18 408–1600
Source: International Ocean Color Ocean Coordination Group at />
a
KGOCI will be in geostationary orbit. All others are in polar orbits with typical revisit times of 2 to 3 days.
3526_book.fm Page 198 Monday, February 14, 2005 1:32 PM
© 2005 by Taylor & Francis Group, LLC
Chapter six: Satellite remote sensing in marine ecosystem assessments 199
The MODIS sensors, together with the European medium resolution
imaging spectrometer (MERIS) launched in March 2002, and the Chinese
moderate resolution imaging spectroradiometer (CMODIS) launched in May
2002, provide increased coverage with correspondingly greater opportuni-
ties to capture short-duration events.
Ocean color products
Ocean color sensors capture light scattered by the atmosphere and reflected
from the sea surface as well as the light radiating from surface waters of the
ocean. It is this "water leaving radiance" that carries ecologically important
signals. Ocean color algorithms extract this signal and deliver various ocean
color products such as those listed in Table 6.2 (derived from Parslow et al.
2000).
Various texts describe the optical properties of ocean and coastal waters
and provide the theoretical basis for extracting signals of biological signifi-
cance (Bukata et al. 1995; Kirk 1994; Mobley 1994).
Satellite-mounted sensors have clear advantages over direct
in situ
obser-
vations, but also suffer from some critical limitations mainly due to limited
Table 6.2
Remote Sensed Products
Chlor Chlorophyll fluorescence as a measure of phytoplankton
biomass
ProductionW Water column primary production using
photosynthesis-irradiance relationships, although
suspended solids and dissolved organic matter in coastal
waters may confound estimates of light attenuation (which
is required together with chlorophyll-a and surface
irradiance to calculate primary production)
Light Light attenuation and water color resulting from organic
biomass (chlorophyll and other pigments), dissolved
substances (yellow), and mineral particles
Pigment/type Pigment composition and bloom type based on differences
in absorption spectra (and perhaps back-scattering
spectra) across algal classes
SS Suspended sediments (particle back-scattering)
Yellow Yellow substances (colored dissolved organic matter)
Dynamics Physical dynamics using reflecting optical properties (ocean
color) of the upper layer, which are considered better than
infrared imagery
Habitat Bottom depth, benthic reflectance, and habitat for optically
shallow coastal waters (using hyperspectral sensor)
ProductionB Benthic primary production may be derived from bottom
light intensity (derived from surface irradiance and
attenuation coefficients) and plant biomass distributions
Note: Product identifiers relate to Table 6.3.
3526_book.fm Page 199 Monday, February 14, 2005 1:32 PM
© 2005 by Taylor & Francis Group, LLC
200 Ecotoxicological testing of marine and freshwater ecosystems
light penetration and noise acquired as the signal passes through the water
and atmosphere to the satellite.
Cloud cover fundamentally limits the areal extent of coverage, although
this can be minimized by extrapolation over time and space through mod-
eling (Aiken et al. 1992) and, in some cases, by compositing successive
images if features change slowly with respect to successive or complemen-
tary overpasses. Sun glint can also obscure the signal (Lockhart 1994)
although optimizing the aspect of the sensor and careful analysis (such as
appropriate stray light thresholds) can reduce this.
Another fundamental limitation is limited light penetration through
water, which restricts vertical coverage. Ocean color sensors receive radiance
from the optical depth (depth of light penetration), which is related to the
visible depth. Optical depth ranges from more than 20 m in oligotrophic
tropical oceans to 5 to 10 m in typical mesotrophic conditions, and can be
as little as 1 to 2 m
in high-concentration phytoplankton blooms or sedi-
ment-laden waters (Aiken et al. 1992). This can be a critical limitation for
subsurface chlorophyll maxima.
Other confounding factors relate to the effects of the water and the
atmosphere through which the signal passes. Algorithms must account for
the bulk optical properties of the upper water column in order to extract
relevant ocean color products (Bukata et al. 1995), and optical effects due to
gases and aerosols in the atmosphere must be addressed (Joint and Groom
2000).
The development of inverse modeling techniques for the interpretation
of ocean color measurements is an ongoing process. Ground truth data are
required to better quantify confidence limits for ocean color products, espe-
cially for coastal applications including benthic mapping.
Recognition of these limitations of satellite-borne ocean color data and
the need for integrated assessments has led to emphatic recommendations
for remote sensing to complement rather than entirely replace
in situ
obser-
vations (IOCCG 2000).
Chlorophyll and primary productivity
Ocean color sensors were primarily developed for their potential to monitor
chlorophyll and primary production. In general, chlorophyll-a can be mea-
sured more accurately
in situ
than from space (Engelsen et al. 2002) but
remotely mounted sensors provide synoptic coverage over unparalleled spa-
tial scales and at frequencies unobtainable by any other sampling procedure.
Chlorophyll pigments are among the principal ocean colorants, but esti-
mates of chlorophyll concentrations from satellite data are subject to the
nonuniform distribution of chlorophyll concentration with depth. Further-
more, the nonlinear relationship between photosynthetic primary produc-
tion and photosynthetically available radiance can confound estimations of
primary productivity.
3526_book.fm Page 200 Monday, February 14, 2005 1:32 PM
© 2005 by Taylor & Francis Group, LLC
Chapter six: Satellite remote sensing in marine ecosystem assessments 201
Despite these problems, good estimates of open-ocean primary produc-
tion can be obtained and it is possible to estimate phytoplankton primary
production for coastal waters by using algorithms that take local water
characteristics into account (Bukata et al. 1995). Standard algorithms for
estimating water column primary production are based on photosynthe-
sis-irradiance relationships that rely on remote sensed chlorophyll-a, light
attenuation, and estimated surface irradiance. These estimates of primary
production are extremely sensitive to light attenuation by substances other
than phytoplankton (Platt et al. 1988), which can be problematic in coastal
waters where high levels of suspended sediments and dissolved organic
matter may be present. Furthermore, remotely sensed surface chlorophyll
concentrations must be extrapolated to vertical chlorophyll profiles in order
to estimate primary production. Historical
in situ
data, supplementary sea
surface temperature data, or physical modeling of mixed layer depths are
usually used to extrapolate to chlorophyll profiles (Parslow et al. 2000).
Optically complex coastal waters (Case 2 waters)
Initial applications of ocean color data focused on open ocean systems (case
1 Waters) but with improved sensors, interest has focused on applications
in coastal waters that are optically more complex (Case 2 Waters).
Unfortunately, the degree of optical complexity of a natural water body
is, in general, directly related to its proximity to land masses (Bukata et al.
1995). In particular, coastal waters contain a variety of absorbing and scat-
tering centers due to distributions of dissolved organic matter, suspended
matter, and air bubbles. Algorithms continue to be developed to improve
both atmospheric corrections and chlorophyll-a estimates for Case 2 waters.
For instance, early atmospheric correction algorithms for open ocean (case
1) waters assumed zero water leaving radiance from red or near-infrared
wavelengths; these wavebands were used together with a prescribed aerosol
reflectance spectrum to extrapolate and remove aerosol effects. However, the
assumption of negligible near-infrared water leaving radiance breaks down
for Case 2 waters. Additional wave bands and new algorithms have over-
come some of these added complexities (Ruddick et al., 2000), but further
room remains for improvements.
The IOCCG reviewed algorithm development for Case 2 waters (IOCCG
2000). The limited number of wavebands on CZCS did not allow the devel-
opment of elaborate multiwaveband algorithms required for optically com-
plex coastal waters. Significant advances have been made with the advent
of the latest generation of satellite-mounted ocean color sensors and asso-
ciated algorithm development. However, quantitative remote sensing of
Case 2 waters will remain challenging because it is fundamentally a mul-
tivariable, nonlinear problem. Accuracy of remotely sensed products will
improve as the inherent optical properties of coastal waters are better under-
stood. The development of inverse modeling techniques for coastal regions
requires precise multispectral radiances, with contemporary optical and
3526_book.fm Page 201 Monday, February 14, 2005 1:32 PM
© 2005 by Taylor & Francis Group, LLC
202 Ecotoxicological testing of marine and freshwater ecosystems
concentration measurements of the water constituents (Doerffer et al. 1999).
IOCCG (2000) identified a general trend in Case 2 algorithm approaches
toward model-based techniques based on the first principles of ocean optics
rather than on purely empirical approaches. Regional algorithms, optimized
for local conditions, were found to perform well when compared with global
algorithms. Considerable scope exists for integration of regional or spe-
cial-case algorithms within an overarching branching algorithm.
The IOCCG has emphasized a need for further work to ensure that error
information is routinely available to avoid inappropriate application of
remotely sensed data. The accuracy and precision of remote sensed products
varies with conditions and concentrations, due to the nonlinearity of the
system and the extreme ranges in the concentrations of individual compo-
nents that contribute to ocean color. Error estimates can be obtained from
sensitivity analysis (models) and comparisons with
in situ
data, recognizing
that there may be a mismatch in temporal and spatial scales of
in situ
data.
Environmental issues and applications
Satellite ocean color imagery can provide cause-and-effect indicators at
appropriate time and space scales for assessment and management of coastal
systems (Parslow et al. 2000). Satellite-mounted ocean color sensors provide
complete global coverage, unencumbered by political and military sensitiv-
ities that can limit other observing systems, such as aerial photography.
Potential and actual applications of ocean color products have been catego-
rized by issue or sector; see Table 6.3. The focus in this chapter is on the top
five issues in Table 6.3, because relevant ocean color products are well estab-
lished and freely available (such as MODIS and research applications using
SeaWiFS). Published applications of data from more recent satellite scanners
such as COCTS, MERIS, and MODIS-aqua are less numerous than those
from SeaWiFS, although recognized applications are equally varied (Doerffer
et al. 1999).
Benthic habitat mapping requires spatial and spectral resolutions typi-
cally restricted to commercial airborne scanners and experimental satel-
lite-mounted hyperspectral scanners, which are beyond the scope of this
chapter. Green et al. (2000) provides general practical guidance on reliability,
accuracy, and cost of a wide range of remote sensing products, including
habitat mapping with a focus on tropical coastal management.
The examples that follow serve to illustrate the spectrum of existing and
potential applications of remote sensed ocean color data. The following
applications are considered: at the global scale (hundreds to thousands of
kilometers), where emphasis has been on climate change and biogeochemical
cycles; at the scale of regional seas (many tens to hundreds of kilometers),
where mesoscale systems and processes have been investigated; and within
the coastal zone (scales of several to many tens of kilometers), where the
effects of human activity on ecosystem health are often most apparent.
3526_book.fm Page 202 Monday, February 14, 2005 1:32 PM
© 2005 by Taylor & Francis Group, LLC
Chapter six: Satellite remote sensing in marine ecosystem assessments 203
Global scale phenomena: biogeochemical cycles, climate change, and
El Niño southern oscillation
Early CZCS data revealed significant differences between northern and
southern hemispheres. In the northern regions spring blooms dominated
distributions of chlorophyll concentration; in the southern ocean, currents
and prevailing winds were the dominant factors explaining chlorophyll con-
centrations (Harris et al. 1993). A comprehensive reanalysis of CZCS data
with improved algorithms incorporating
in situ
data now permits quantita-
tive analysis of trends in global ocean chlorophyll spanning two decades
(Gregg et al., 2002). CZCS data (1979 to 1986) have been reprocessed for
comparison with SeaWiFS data (September 1997 to the present) using the
same algorithms (Antoine et al., 2003; data available at http://
www.rsmas.miami.edu/groups/rrsl/lpcm-seawifs-CZCS).
The oceans contain approximately 85% of the carbon circulating in the
earth’s biosphere and provide the main long-term control of atmospheric
CO
2
and the strength of the natural greenhouse effect (Aiken et al. 2000).
Remotely sensed ocean color has been used with models and other data to
estimate carbon removal through the fixation of dissolved carbon by phy-
toplankton and its subsequent burial in sediment or export to deep ocean
waters. Such research has suggested that the global ocean is a major sink for
fossil and biogenic carbon released to the atmosphere by human activities
(Parslow et al. 2000), while coastal areas appear to act globally as a net source
because rivers inject massive quantities of land-derived carbon (Smith and
Hollibaugh 1993). There is significant variability, however, among various
coastal zones (Smith and Hollibaugh 1993) and through time (Kempe 1995).
Ocean color was used to assess sequestration of carbon to depth follow-
ing the first
in situ
iron fertilization experiment in the region of intermediate
and deep water formation in the southern ocean (Boyd and Law 2001). Iron
limitation of phytoplankton growth was confirmed during summer, but
SeaWiFs imagery together with modeling suggested no significant down-
ward particulate export of the accumulated phytoplankton. Boyd and Law
speculated that mass algal sedimentation may have been prevented by hor-
izontal dispersion of high chlorophyll-a waters to adjacent waters.
SeaWiFS has provided routine global chlorophyll observations since
1997, capturing the response of ocean phytoplankton to major El Niño and
La Niña events as well as observing interannual variability unrelated to these
phenomena.
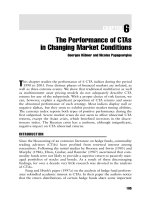
SeaWiFS data, such as those presented in Figure 6.1, revealed seasonal
chlorophyll distributions across the surface waters of the world’s ocean as
described by Gregg (2002). High-latitude regions experience a very wide
seasonal range of chlorophyll, with a prominent and large local spring and
summer bloom and a large die-off in local winter. Mid-latitude regions
exhibited much smaller seasonal differences, with local winter maxima.
Chlorophyll patterns around India are associated with the northwest
monsoon in December and the larger southwest monsoon in July (Gregg,
3526_book.fm Page 203 Monday, February 14, 2005 1:32 PM
© 2005 by Taylor & Francis Group, LLC
204 Ecotoxicological testing of marine and freshwater ecosystems
Table 6.3
Environmental and Management Issues Served by Remote Sensed Products
Issues
Key
Products
a
Global Change and Regional Biogeochemical Cycles
The fundamental dynamics of coastal ecosystems and their role in the global carbon cycle will continue to change due
to the cumulative effects of: climate-induced changes to sea level, upper ocean temperatures, storm activity and erosion,
coastal habitat change, fresh water impoundments, nutrient loading to coastal waters from catchments, sewage,
atmospheric sources, and over-fishing. Changes need to be monitored, understood, and, where possible, managed.
Chlor
ProductionW
Dynamics
Eutrophication
Excessive nutrient loadings from catchment and point sources can increase algal biomass and change species
composition, often favoring nuisance algae.
Chlor
Harmful Algal Blooms
Evidence suggests worldwide increase in incidence of harmful algal blooms over the last few decades (Anderson, 1995)
possibly due to anthropogenic nutrient loadings, changed flushing regimes, introduced exotic species that can threaten
wild and cultivated fisheries, and tourism.
Chlor
Pigment/type
Impacts of Catchment Activities on Estuarine and Coastal Waters
Agriculture, forestry, mining, dams, irrigation schemes and urban and industrial development can change patterns of
freshwater, sediment, and nutrient and pollutant delivery, and thus impact on coastal waters.
Light
Chlor
SS
Wild Fisheries
Effective management of fisheries requires an ecosystem approach, which in turn requires development of understanding
and tools relating to many of the above.
Light
Chlor
Pigment/type
Dynamics
3526_book.fm Page 204 Monday, February 14, 2005 1:32 PM
© 2005 by Taylor & Francis Group, LLC
Chapter six: Satellite remote sensing in marine ecosystem assessments 205
Aquaculture
The rapidly growing aquaculture industry needs appropriate siting and monitoring of environmental impacts of, and
on, the industry.
Macroalgae culture depends on water quality, including light attenuation.
Shellfish culture depends on phytoplankton biomass and composition (including harmful algae), and particle-bound
contaminants.
Crustacean and fish ponds are typically highly eutrophic, so interactions with adjacent waters can be problematic.
Fish-cage culture represents a large source of recycled nutrients but requires high water quality and is vulnerable to
harmful algal blooms, anoxic sediments, and bottom waters.
Light
Chlor
Pigment/type
Habitat
ProductionW
ProductionB
SS
Dynamics
Maritime Operations
Navigation, shipping, diving, and hazard detection.
Light
Habitat
Dynamics
Impacts of Coastal Development on Coastal Habitats and Changes in Flushing Rates
Urban and tourist development, port and harbor development, dredging and outfalls can disturb or remove critical
habitats, remobilize sediments and pollutants, and change circulation patterns.
Light
Habitat
SS
Conservation
Effective conservation requires an understanding of the spatial and temporal patterns of environmental forcing and the
dynamical response of the marine ecosystem.
All
Tourism
Healthy coastal environments are critical in attracting visitors, especially in high conservation areas, which in turn can
be threatened by tourist development.
Light
Chlor
SS
Integrated Coastal Zone Management
Issues and uses of remote sensed data (above) interact strongly through coastal ecosystems; core and derived remote
sensed products contribute to assessments and a predictive understanding that will facilitate integrated management.
All
a
Key Products relate to Table 6.2.
Source
: Parslow, J.S., Hoepffner, N., Doerffer, R., Campbell, J.W., Schlittenhardt, P., and Sathyendranath, S
., Remote sensing ocean color in coastal, and other
optically-complex, waters.
Reports of the International Ocean-Color Coordinating Group, No.3, IOCCG, Dartmouth, Novia Scotia, Canada, 2000.
3526_book.fm Page 205 Monday, February 14, 2005 1:32 PM
© 2005 by Taylor & Francis Group, LLC
206 Ecotoxicological testing of marine and freshwater ecosystems
2002). Elevated chlorophyll levels in the equatorial Atlantic correspond to
maximum upwelling (Monger et al. 1997), while high levels during winter
(such as in December 1997) are associated with maximum discharge from
the Congo River (Gregg 2002).
A major El Niño was underway in September 1997 when SeaWiFS was
launched, and it continued until May 1998 when it was succeeded by a La
Niña episode in the tropical Pacific. El Niño suppressed upwelling in the
equatorial Pacific, resulting in a band of low chlorophyll just above the
equator and corresponding to the equatorial counter current (Figure 6.1).
During the El Niño, abnormally high wind stresses in the eastern tropical
Indian Ocean produced anomalous upwelling that resulted in high chloro-
phyll levels during December 1997. Reestablishment and intensification of
Figure 6.1
Monthly mean SeaWiFS chlorophyll for December 1997 and July 1998.
These observations span a major transition from El Niño to La Niña. Areas of the
Arabian Sea failed SeaWiFS criteria due to aerosol effects in December 1997. Modified
from Gregg 2002.
3526_book.fm Page 206 Monday, February 14, 2005 1:32 PM
© 2005 by Taylor & Francis Group, LLC
Chapter six: Satellite remote sensing in marine ecosystem assessments 207
upwelling conditions occurred in the equatorial Pacific when La Niña con-
ditions developed.
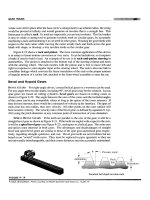
A bloom developed rapidly during mid-1998 with a wave pattern cen-
tered on the equator, culminating in the highest surface chlorophyll concen-
trations ever observed in the central equatorial Pacific, more than 1 mg
·
m
-3
(McClain et al. 2002). The magnitude and persistence of this bloom is self-evi-
dent in the time sequence of estimated primary production shown in Figure
6.2. These data pose as yet-unanswered questions about the mechanism that
caused the bloom and how it was maintained for so long. In this region, iron
is assumed to be the primary limiting nutrient (Coale et al. 1996), although
Figure 6.2
Longitude-time plot of primary production (mg C m
-2
day
-1
) based on
OCTS and SeaWiFS monthly mean chlorophyll from McClain et al. (2002).
3526_book.fm Page 207 Monday, February 14, 2005 1:32 PM
© 2005 by Taylor & Francis Group, LLC
208 Ecotoxicological testing of marine and freshwater ecosystems
wind data appear to discount Ekman upwelling as a source of iron, and
atmospheric iron supply remains equivocal (McClain et al. 2002). The per-
sistence of the bloom and the apparent absence of a sustained source of iron
suggest efficient retention within the surface layer and ineffective sedimen-
tation over a few weeks or even months.
Recent research has focused on numerical modeling to investigate
causal mechanisms and interrelationships of the variability observed in the
ocean color data. For example, Gregg (2002) tracked the SeaWiFS record
with a coupled physical/biogeochemical/radiative model of the global
oceans. Simulations suggested different phytoplankton responses of the
Pacific and Indian ocean basins to El Niño. Diatoms were predominant in
the tropical Pacific during La Niña, but other groups were predominant
during El Niño. The opposite condition occurred, however, in the tropical
Indian Ocean.
Other studies have established linkages to meteorological forcing. Fol-
lows and Dutkiewicz (2002) used SeaWiFS data to identify meteorological
modulation of the spring bloom in the North Atlantic and to examine the
implications of decadal changes on biological productivity with a simplified
model; Yakov et al. (2001) related seasonal phytoplankton cycles to meteo-
rological factors influencing water stratification of the water column.
SeaWiFS data have also been used to develop and verify ocean gen-
eral-circulation models (OGCMs), which are critical in global warming
assessments. For example, global monthly mean fields of the attenuation
of photosynthetic radiation derived from SeaWiFS data have been used to
investigate the importance of subsurface heating on surface mixed-layer
properties in OCGMs, resulting in a marked increase in the sea surface
temperature (SST) predictive skill of the OGCM at low latitudes (Rochford
et al. 2002).
SeaWiFS data have also been used together with UV irradiance at the
ocean surface (remotely sensed via the total ozone mapping spectrophotom-
eter) to investigate the potential ecological effects of ozone depletion via a
model of seawater optical properties in the UV spectral region (Vasilkov et
al. 2001).
These studies are examples from a much larger body of work that has
employed remote sensed ocean color data to better understand global-scale
impacts resulting from human activities.
Regional seas: mesoscale processes and biological variability
Ocean color data have been crucial in relating mesoscale processes to conti-
nental shelf ecology through studies of frontal features (Armstrong 1994),
eddies (Bardey et al. 1999), upwelling zones (Sathyendranath et al. 1991;
Barlow et al., 2001), island wakes (Blain et al. 2001; Caldeira et al. 2002),
current patterns (Lee et al. 2001), water mass distributions (Van Der Piepen
et al. 1999; Karabashev et al. 2002; Gomes et al. 2000), and various water-qual-
ity parameters.
3526_book.fm Page 208 Monday, February 14, 2005 1:32 PM
© 2005 by Taylor & Francis Group, LLC
Chapter six: Satellite remote sensing in marine ecosystem assessments 209
Research has increasingly focused on integration of various remote
sensed and
in situ
data. For example, McClain et al. (2002) analyzed chloro-
phyll concentrations derived from SeaWiFS together with winds (in part
from the satellite-mounted scatterometer SeaWinds), sea surface temperature
distributions (from AVHRR), and bathymetry data to investigate upwelling
phenomena off the west coast of Central America. This region was known
for strong upwelling and jets driven by winds that blow from the Atlantic
through three narrow mountain passes (McCreary et al., 1989). Synoptic cov-
erage of recent remote sensed data allowed elucidation of interactions between
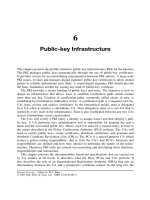
coastal upwelling jets and mesoscale eddies (McClain et al. 2002). Figure 6.3
shows monthly average data for March 1999 when all three upwelling regions
were active. High chlorophyll levels (more than 1 mg · m
-3
) extended many
hundreds of kilometers offshore from the three mountain passes and were
associated with strong offshore wind stress and cool surface waters (1ºC to
Figure 6.3
Monthly mean SeaWiFS chlorophyll-a (mg·m
-3
) and monthly mean sea
surface temperature and wind stress vectors for March 1999. ‘P’ indicates location of
mountain pass. Modified from McClain et al. 2002.
3526_book.fm Page 209 Monday, February 14, 2005 1:32 PM
© 2005 by Taylor & Francis Group, LLC
210 Ecotoxicological testing of marine and freshwater ecosystems
3ºC contrast) consistent with jet-driven upwelling. Large mesoscale eddies
were spawned by these wind-driven offshore jets (McClain et al. 2002).
A similar multifaceted study used a range of simultaneous remote
sensed data to investigate interactions between flow fields and topography/
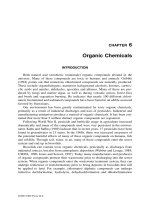
bathymetry around Madeira Island in the northeast Atlantic (Caldeira et al.
2002). AVHRR, CZCS, and SeaWiFS data revealed the following: wind spiral
vortices (Von Karman Vortex Street) in the lee of Madeira Island that served
to expose the sea surface layer to intense solar radiation compared to cloud
covered waters surrounding it; a warm water wake possibly associated with
this solar heating (Figure 6.4); geostrophically balanced lee eddies spinning
off both flanks of the island including cold core eddies associated with high
productivity; localized upwelling and high productivity associated with an
underwater ridge; and evidence of the presence of a subtropical front at
Madeira’s latitude that may influence dispersion.
Semovski et al. (1999) used CZCS chlorophyll estimates together with
AVHRR sea surface temperature data, AVHRR channel 1 data as a turbidity
indicator,
in situ
data, and modeling to describe the three-dimensional eco-
system structure of mesoscale features in Baltic coastal waters.
A number of studies have used remote sensed ocean color to monitor
population dynamics of organisms dependent on phytoplankton. For exam-
ple, early CZCS studies by Shannon (1985) related ocean color to phytoplank-
ton and pelagic fish distributions. Jaquet et al. (1996) showed that the dis-
tribution of sperm whales was strongly correlated with ocean color
(chlorophyll) and identified the time (and space) lag between peak chloro-
phyll concentration and peak sperm whale density with the coefficient of
correlation increasing with increasing spatial scales. Polovina et al. (2000)
Figure 6.4
AVHRR image showing island mass effects causing interrupted cloud
cover and spiral vortices in the lee of Madeira Island, North East Atlantic (19/8/94).
An AVHRR sea surface temperature image illustrates typical warm water island wake
off Madeira Island (28/7/96) when the wind was north northeast. Modified from
Caldeira et al. 2002.
3526_book.fm Page 210 Monday, February 14, 2005 1:32 PM
© 2005 by Taylor & Francis Group, LLC
Chapter six: Satellite remote sensing in marine ecosystem assessments 211
identified an association between loggerhead turtles and frontal zones
through analysis of remote sensed sea surface temperature and chlorophyll
and geostrophic currents; this conclusion was offered to explain high inci-
dental catches of loggerhead turtles when long-line fishing coincided with
frontal zones off Hawaii.
Understanding seasonally high primary productivity can be of great
importance in some regions. For example, spring blooms in the Barents Sea
provide a strong pulse of energy through the ice-associated and pelagic
marine food webs that directly influences the abundance of upper trophic
levels, including large marine mammal and sea bird populations (Engelsen
et al. 2002). Empirical formulae developed by Engelsen et al. (2002) provided
estimates of integrated water column phytoplankton biomass using SeaWiFS
data, which held provided that light was the limiting factor.
Together these studies show that a great deal of mesoscale variability
can only be observed using satellite remote sensing.
Coastal zones: human activity and ecosystem health
The feasibility of using remote sensing techniques for monitoring water
quality in inland and coastal waters was initially limited by their complex
optical properties (Kondratyev et al. 1998), but advances in sensors and
algorithms deliver a means to discriminate the three main components that
account for the optical complexity of case 2 waters: phytoplankton, sus-
pended sediments, and dissolved organic matter. These same components
may be used for assessing water quality, algal blooms, and fisheries in the
coastal zone.
Water quality
Ocean color (SeaWiFS data) supported by
in situ
observations has been used
to investigate outpourings from rivers and coastal catchments. For example,
Mertes and Warrick (2001) found that disproportionately large plumes with
high concentrations of suspended solids emanated from small coastal Cali-
fornian catchments compared to large rivers; Siddorn et al. (2001) found an
inverse relationship between salinity and yellow substances that could be
used to determine the distribution of the Zambezi River plume; Del Castillo
(2001) mapped the intrusion of the Mississippi River plume in the West
Florida Shelf; and Andrefouet et al. (2002) found that river plumes off Hon-
duras may extend to offshore coral reefs, indicating connectivity of these
reefs with the mainland.
Turbid plumes originating from five coastal catchments in southeast
Australia after a high rainfall event are shown in Figure 6.5 (from Lee and
Pritchard 1999).
In situ
observations during this event confirmed low ocean
chlorophyll levels (less than 1
µ
g/l), thus verifying that the plume images
were due to terrigenous matter; the ocean color scale corresponded to log
ranges in measured total suspended sediments. A similar logarithmic rela-
tionship was found for the Gironde turbid plume in the Bay of Biscay
3526_book.fm Page 211 Monday, February 14, 2005 1:32 PM
© 2005 by Taylor & Francis Group, LLC
212 Ecotoxicological testing of marine and freshwater ecosystems
(Froidefond et al. 2002). Spatial analyses were used in the Australian example
to estimate the areal extent of the flood plumes as tabulated in Figure 6.5.
The Hunter plume carried an estimated sediment load of about 7000 tons;
this figure was based on remotely sensed areal extent and direct observations
along offshore transects that indicated a plume-layer thickness of approxi-
mately 1 m out to 10 km from the entrance. Significant fallout and dispersion
was inferred from the difference between the load carried within the plume
and the discharge load estimated at the river mouth.
Woodruff et al. (1999) suggested that photosynthetically available radi-
ation (PAR) attenuation may be estimated from long-term AVHRR satellite
data sets as a measure of turbidity; they developed a robust relationship
between reflectance observed by AVHRR and light attenuation in the Pam-
lico Sound estuary in North Carolina in the U.S., although consistent rela-
tionships between reflectance and suspended sediment concentrations were
elusive due to changing sediment characteristics.
Most studies focus on biological responses (of phytoplankton) to water
quality, but Budd et al. (2001) focused on water-quality responses to biolog-
ical activity (filter feeding). AVHRR reflectance imagery indicated distinct
Figure 6.5
SeaWiFs image for 11 August 1998 indicated plumes emanating from the
Hunter, Hawkesbury, Pt. Jackson, Botany Bay, and Shoalhaven catchments in New
South Wales, Australia. Modified from Lee and Pritchard 1999.
Hunter
Hawkesbury
Pt. Jackson
Botany Bay
Shoalhaven
11 August 1998
C
a
t
c
h
m
e
n
t
P
l
u
m
e
k
m
2
Hunter 980
Hawkesbury 805
Pt. Jackson 158
Botany Bay 74
Shoalhaven 1069
3526_book.fm Page 212 Monday, February 14, 2005 1:32 PM
© 2005 by Taylor & Francis Group, LLC
Chapter six: Satellite remote sensing in marine ecosystem assessments 213
and persistent increases in water clarity after zebra mussels (
Dreissena poly-
morpha
) were discovered in 1991 in Saginaw Bay, Lake Huron, U.S.
Few if any investigations of sewage plumes were found in the interna-
tional scientific literature because, for satellite-mounted ocean sensors, spa-
tial scales are typically too coarse to resolve sewage plumes. However,
untreated sewage discharged from Iraq via a man-made river was implicated
as the source of pollution and algal blooms evident in SeaWiFS imagery off
the shores of Kuwait in the Persian Gulf (Antonenko et al. 2001).
Algal blooms
The ability to track harmful algal blooms from space can provide coastal
communities and seafood harvesting industries with warnings of approach-
ing blooms (Antonenko et al. 2001).
Algorithms are currently unavailable to distinguish between most types
of phytoplankton blooms, although SeaWiFS data have been used together
with field data to monitor and predict specific harmful algal blooms (such
as
Karenia brevis
blooms in the Gulf of Mexico [Stumpf 2001]).
Some bloom types have distinctive ocean color signatures that allow
them to be recognized from SeaWiFS data. Examples are the highly reflective
coccolithophores that can have a profound effect on the ecosystem, mainly
due to extreme reductions in water clarity (Vance et al.,1998; see Figure 6.6),
and
Trichodesmium erythraeum,
due to its distinctive spectral response (Sub-
ramaniam et al., 2002). Indeed, SeaWiFS-derived trichodesmium chlorophyll
concentration has been used for remote estimation of nitrogen fixation by
trichodesmium (Hood et al. 2002).
Opportunities exist to use multiple sensors to monitor algal blooms. Lin
et al. (1999) attempted to assess the relative performance of nine different
types of satellite-mounted ocean color and high-resolution visible sensors to
monitor algal blooms, while Rud and Gade (2000) have explored the benefits
of using multisensor data (AVHRR, SeaWiFS, Landsat thematic mapper, and
ERS synthetic aperture radar) for algal bloom monitoring.
The utility of remote sensed data for diagnostic and prognostic assess-
ment of algal blooms is demonstrated in the case study discussed later in
this chapter.
Fisheries
SeaWiFS data were used to demonstrate the relatively clear, pigment-poor
surface waters of the Mediterranean with a generally increasing oligotrophy
eastwards. Turley et al. (2000) suggested that the combination of low primary
production and bacterial dominance of secondary production in the east
could account for the low fisheries production, the low vertical flux of mate-
rial, and low biomass of benthic organisms in this region.
At a finer scale of resolution, Agostini and Bakun (2002) used mean
seasonal satellite-sensed ocean color, wind data, and bathymetry to identify
3526_book.fm Page 213 Monday, February 14, 2005 1:32 PM
© 2005 by Taylor & Francis Group, LLC
214 Ecotoxicological testing of marine and freshwater ecosystems
potentially favorable fish reproductive habitats in the Mediterranean based
on nutrient enrichment, larval food distributions, and local retention of eggs
and larvae.
Platt et al. (2003) used ocean color data from the periods 1979 to 1981
(CZCS), 1997 (POLDER) and 1998 to 2001 (SeaWiFS) to demonstrate that the
survival of larval fish (haddock [
Melanogrammus aeglefinus
]) off the eastern
continental shelf of Nova Scotia, Canada, depends on the timing of the local
spring bloom of phytoplankton. They compared an index of survival (the
year-class size at age 1 year, divided by the spawning stock biomass) with
anomalies in the timing of spring blooms (the difference in bloom timing
from the mean timing for the series). They found that 89% of the variance
in larval survival could be accounted for by variation in the timing of the
spring bloom. Early spring blooms favored high survival rates, possibly due
to greater overlap of spawning and bloom periods. Direct evidence for a
putative trophic link such as this is an important factor in analysis of dwin-
dling fish stocks.
Routine synergistic analysis of satellite-borne ocean color and sea surface
temperature data sets is currently possible (Solanki et al. 2001) for targeting
fishing efforts and monitoring algal bloom development. In the future more
Figure 6.6
Coccolithophore bloom off Cornwall, United Kingdom, on 18/1/1998.
True color (Modular Optoelectric Scanner, MOS) from Deutsches Zentrum für Luft-
und Raumfahrt, DLR (German Aerospace Centre).
3526_book.fm Page 214 Monday, February 14, 2005 1:32 PM
© 2005 by Taylor & Francis Group, LLC
Chapter six: Satellite remote sensing in marine ecosystem assessments 215
frequent coincidence of data from existing and future sensors will deliver
synergy among a greater range of remote sensed data including synthetic
aperture radar data and data from thermal and optical satellite sensors, as
demonstrated by Ufermann et al. (2001).
Parslow et al. (2000) suggest that ocean color data could best contribute
to integrated coastal management via diagnostic and prognostic models that
also assimilate
in situ
observations and supplementary remote sensed data
(such as sea surface temperature via AVHRR, sea surface height via TOPEX/
Poseidon, and winds via GEOSAT). At present, integration of ocean color
data for the coastal zone with corresponding physical/biogeochemical/radi-
ative models remains a challenge due to the optical complexity of case 2
waters and the requirement for higher spatial resolution compared to open
ocean approaches.
Case study: marine algal blooms in coastal waters off
southeast Australia
Management issues
Eutrophication has been recognized as a serious threat to the health of coastal
ecosystems both globally (Pelley, 1998) and within Australia (Zann 1995).
Phytoplankton represent the floating pastures of the ocean, so changes in
phytoplankton type and abundance due to eutrophication may profoundly
affect the food web. Furthermore, some evidence exists for a worldwide
increase in the occurrence of harmful algal blooms (Anderson 1995; Paerl
1997). Some biotoxins selectively kill fish by inhibiting their respiration,
while others affect humans generally via seafood.
Visible or harmful algal blooms have the potential to affect tourism in
New South Wales (NSW), Australia. Tourism is focused on coastal regions
and is worth more than A$6 billion a year. In NSW coastal waters, the
magnitude and frequency of "red tides" of the nontoxic dinoflagellate
Noc-
tiluca scintillans
appear to have increased during the last two decades (Ajani
et al. 2001a).
Prior to the 1990s,
N. scintillans
appeared as a relatively minor compo-
nent of the phytoplankton community in NSW coastal waters (Dakin and
Colifax 1933), blooming infrequently (Hallegraeff 1995; Ajani et al. 2001b).
Since 1990, most red tides in NSW have been due to
N. scintillans
(Figure
6.7). In weekly sampling at Port Hacking off Sydney, Ajani et al. (2001a)
found
N. scintillans
in most samples. Major visible blooms of
N. scintillans
have aroused community and media concern in recent years, such as that
during January 1998 (see below).
The NSW aquaculture industry, currently worth A$42 to A$45 million a
year, is projected to increase to A$250 million a year by 2010. Phytoplankton
have been implicated in seafood contamination and fish kills at different
times elsewhere in NSW coastal waters (Ajani et al. 2001b). For example,
Dinophysis acuminata,
a producer of diarrhetic shellfish poisoning (DSP), was
3526_book.fm Page 215 Monday, February 14, 2005 1:32 PM
© 2005 by Taylor & Francis Group, LLC
216 Ecotoxicological testing of marine and freshwater ecosystems
implicated in the contamination of pipis (edible surf clam,
Donax sp.
) at
Ballina, about 700 km north of Sydney (in December 1997), and Newcastle,
just south of Port Stephens (in February 1998), with a total of 82 cases of
gastroenteritis in consumers.
Regional Algal Coordination Committees have been established by the
state government to manage responses to reports of algal blooms while
seafood (biotoxin) issues are addressed through the Pipi Biotoxin Manage-
ment Plan and a SafeFood Marine Algal Biotoxin Contingency/Management
Plan. The Pipi Biotoxin Management Plan requires focused, routine moni-
toring of phytoplankton in water samples while other plans are responsive
to alerts (such as visible algal blooms). Prognostic and diagnostic tools would
assist in risk management of algal blooms relating to both recreational and
seafood issues.
Developing a predictive understanding using remote sensed data
Natural upwelling/uplifting has been identified as the principal driver of
marine (offshore) algal blooms in NSW coastal waters, despite significant
sewage inputs near major urban centers (Hallegraeff and Reid 1986; Ajani
et al. 2001a; Pritchard et al. 2003). This finding together with an understand-
ing of upwelling/uplifting processes provides an opportunity to use remote
sensed products together with meteorological data to predict periods of
increased risk of marine algal blooms.
Figure 6.7
Spectacular
Noctiluca scintillans
bloom off the popular tourist beach at
Manly near Sydney, New South Wales, Australia during 1997. Frontal processes (local
convergence) accumulated
Noctiluca
which was then fragmented by the wind into
bright red streaks directed shoreward (windrows). Photo courtesy of Beachwatch,
NSW EPA.
3526_book.fm Page 216 Monday, February 14, 2005 1:32 PM
© 2005 by Taylor & Francis Group, LLC
Chapter six: Satellite remote sensing in marine ecosystem assessments 217
The combination of the East Australian Current (EAC) activity on the
shelf break (enhancing stratification and bottom stress) and upwelling-favor-
able winds promotes upwelling (Tranter et al. 1986; Oke and Middleton 1999,
2000; Pritchard et al.,2003). The thermal signatures of the EAC and associated
eddies are readily identifiable from remotely sensed sea surface temperature
(via NOAA's AVHRR).
Most slope-water intrusions that precede phytoplankton blooms on the
NSW continental shelf do not outpour at the surface, although in many
instances surface water temperatures are depressed and can be identified on
AVHRR images (Cresswell 1994; Pritchard et al. 1999). Phytoplankton
responses were found to lag several days behind intrusions of nutrient-rich
slope water, so AVHRR images can provide early indications of risk of algal
blooms.
Companion synoptic ocean color can indicate oligotrophic EAC waters
and monitor phytoplankton responses through time due to nutrient enrich-
ment and cycling, and through space due to advection.
The vast majority of red tide (visible) blooms in NSW marine waters
have been due to either
N. scintillans
or
Trichodesmium erythraeum
. Remote
sensed data provide a predictive and diagnostic capability, as illustrated by
the events described below.
Noctiluca bloom: January 1998
AVHRR SST (Figure 6.8) and SeaWiFS ocean color (Figure 6.9) for January
11 and 12, 1998, identified the warm oligotrophic EAC waters diverging from
the coast off Port Stephens, with cool water and high phytoplankton activity
on the inside edge of this southward EAC flow. Meteorological observations
indicated upwelling-favorable winds during early and mid-January 1998
(Lee et al. 2001). Investigative modeling has shown a tendency for intrusions
of cool, nutrient-rich slope water onto the shelf to be associated with the
changing shelf configuration to the north of Port Stephens (Oke and Mid-
dleton 2000). More localized phytoplankton activity near Jervis Bay (on
January 12) is associated with a bathymetric protrusion that has also been
shown to favor upwelling (Gibbs et al. 1997). A similar scenario appears to
be in operation off Eden on the NSW south coast, where a mesoscale anti-
cyclonic eddy has intensified the divergent flow from the coast.
Regional southward flows on the shelf are indicated by wake effects in
the lee of most major changes in the orientation of the coastline (SeaWiFS,
January 12, 1998). Time series of ocean color imagery provide greater reso-
lution of flow features than AVHRR SST imagery, although ocean color
cannot be regarded as a conservative tracer.
SeaWiFS imagery for January 20 indicates the formation of a cyclonic
(clockwise) back eddy inshore of the EAC front in the lee of a major change
in shelf orientation near Port Stephens. Baroclinic instabilities such as this
eddy also favor upwelling and tend to be associated with along-shelf topo-
graphic variability such as that seen near Port Stephens (and Jervis Bay).
3526_book.fm Page 217 Monday, February 14, 2005 1:32 PM
© 2005 by Taylor & Francis Group, LLC
218 Ecotoxicological testing of marine and freshwater ecosystems
Cyclonic eddies promote localized upwelling (Ekman pumping) because
bottom stress associated with the clockwise rotation promotes convergence
of bottom waters (toward the center of the eddy) and consequent upward
transport, together with divergence at the surface. Intense phytoplankton
activity in this recirculation cell, evident in Figure 6.9 (January 20), is con-
sistent with further localized upwelling. The cell also tends to isolate nutri-
ent-rich waters, incubating phytoplankton that leaks southward with the
regional flow on the shelf.
In situ observations of temperature and chlorophyll-a throughout the
water column off Sydney (Figure 6.10) support the notion of a remote source
— that is, near-simultaneous arrival of both slope water (nutrients to the
euphotic zone) and phytoplankton with no evidence of a lag corresponding
to expected phytoplankton response times. The notion of a remote source is
consistent with indications of a maturing noctiluca population with increas-
ing southerly extent (Murray and Suthers 1999). Modeling suggests the
propensity for the uplifting of slope water north of Port Stephens and sub-
sequent southward transit (Oke and Middleton 2000), and previous obser-
vations of EAC-induced upwellings being advected southward as a plume
by ambient flows (Cresswell 1994).
In situ observations (Figure 6.10) were important in verifying SeaWiFS
chlorophyll-a distributions with respect to the vertical position of chloro-
phyll-a maxima. Conductivity, temperature, and depth (CTD) data (not
shown) along the transect between PH50 and PH100 on January 15 indicated
Figure 6.8 Sea surface temperature (SST) image showing separation of the East Aus-
tralian Current from the shelf off Port Stephens (200 m isobath shelf break indicated).
Image courtesy of CSIRO Marine Laboratory.
PT STEPHENS
SYDNEY
JERVIS BAY
EDEN
11 JAN 1998
NOAA14
AVHRR
SST
(°C)
PT STEPHENS
SYDNEY
JERVIS BAY
EDEN
11 JAN 1998
NOAA14
AVHRR
SST
(°C)
3526_book.fm Page 218 Monday, February 14, 2005 1:32 PM
© 2005 by Taylor & Francis Group, LLC
Chapter six: Satellite remote sensing in marine ecosystem assessments 219
prominent shoreward tilting of isotherms, consistent with the vertical dis-
tribution of chlorophyll-a at PH100 due to the upwelling forcing. Figure 6.10
shows that phytoplankton blooms were clearly within the upper mixed layer
and thus amenable to mapping by satellite-borne ocean color scanners. In
situ data complements remote sensed data by highlighting the role of thermal
structure in controlling the vertical distributions of phytoplankton, and rais-
ing questions about the relative importance of temperature, nutrient, and
light limitation and the effects of density stratification.
Widespread visible blooms (red tides) of N. scintillans were recorded
from January 22, consistent with the end stages of the bloom when senescent
cells become buoyant and accumulate along surface zones of convergence
(Ajani et al. 2000b).
Clearly, remote sensed ocean color together with SST supported by some
in situ observations provide the means to forecast algal bloom risk and
diagnose initiation sites, which in this case were distant from major anthro-
pogenic nutrient discharges off Sydney. Indeed during the summer of 1998
Figure 6.9 SeaWifS chlorophyll-a estimates during January 1998 indicate phytoplank-
ton accumulations along fronts in the lee of major changes in the orientation of the
coastline especially along the inner edge of the East Australian Current south of Port
Stephens which ultimately formed a plankton-rich cyclonic eddy on January 20, 1998.
Images courtesy of CSIRO Marine Laboratory.
SYDNEY
SYDNEY
SYDNEY
PT STEPHENS
8 JAN 1998
12 JAN 1998
20 JAN 1998
JERVIS BAY
JERVIS BAY
EDEN
PT STEPHENS
PT STEPHENS
CHLOR-A
(mg/m
3
)
SeaWiFS
ocean
colour
PH100
PH50
TRANSECT
1 JAN 1998
SYDNEY
SYDNEY
SYDNEY
PT STEPHENS
8 JAN 1998
12 JAN 1998
20 JAN 1998
JERVIS BAY
JERVIS BAY
EDEN
PT STEPHENS
PT STEPHENS
CHLOR-A
(mg/m
3
)
SeaWiFS
ocean
colour
PH100
PH50
TRANSECT
1 JAN 1998
3526_book.fm Page 219 Monday, February 14, 2005 1:32 PM
© 2005 by Taylor & Francis Group, LLC