Structure and Function in Agroecosystem Design and Management - Chapter 5 pdf
Bạn đang xem bản rút gọn của tài liệu. Xem và tải ngay bản đầy đủ của tài liệu tại đây (151.51 KB, 18 trang )
CHAPTER 5
Utilization of Biological Interactions
and Matter Cycling in Agriculture
Masae Shiyomi
CONTENTS
Introduction. . . . . . . . . . . . . . . . . . . . . . . . . . . . . . . . . . . . . . . . . . . . . . . . . . . . . . 95
From Agriculture Based on Fossil Energy to Agriculture Based on
the Use of Complex Biological Interactions . . . . . . . . . . . . . . . . . . . . . . . . 97
Plant-Grasshopper-Mantis-Bird Model. . . . . . . . . . . . . . . . . . . . . . . . . 98
Grasshopper-Mantis Model . . . . . . . . . . . . . . . . . . . . . . . . . . . . . . . . . . 99
The Importance of Matter Cycling in the New Agriculture. . . . . . . . . . . . . 101
Grassland Ecosystems . . . . . . . . . . . . . . . . . . . . . . . . . . . . . . . . . . . . . . 102
Upland Crop Field Ecosystems . . . . . . . . . . . . . . . . . . . . . . . . . . . . . . 106
Paddy Field Ecosystems . . . . . . . . . . . . . . . . . . . . . . . . . . . . . . . . . . . . 107
Conclusions . . . . . . . . . . . . . . . . . . . . . . . . . . . . . . . . . . . . . . . . . . . . . . . . . . . . . 108
References . . . . . . . . . . . . . . . . . . . . . . . . . . . . . . . . . . . . . . . . . . . . . . . . . . . . . . 110
INTRODUCTION
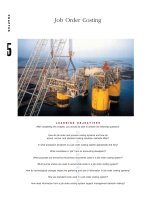
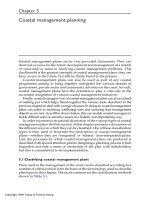
For the 50 years following the Second World War, agricultural produc-
tion markedly increased. Examples are shown in Figure 5.1 for corn in the
U.S. and rice in Japan (Uchijima, 1990). In the U.S., the use of F
1
hybrid corn
in the 1960s led to a rapid increase in production per hectare. Although the
production of rice in Japan has not made such rapid strides as that of corn in
the U.S., the production per unit area has gradually increased from 1900 to
the very high present level, especially in the last 50 years.
Modern agriculture, which depends on the consumption of large quanti-
ties of fossil fuel, is now being forced to change to an alternative system in
95
0-8493-0904-2/01/$0.00+$.50
© 2001 by CRC Press LLC
920103_CRC20_0904_CH05 1/13/01 10:48 AM Page 95
96 STRUCTURE AND FUNCTION IN AGROECOSYSTEMS DESIGN AND MANAGEMENT
Corn, United States
Rice, Japan
Yield t ha
-1
1890 1900 1910 1920 1930 1940 1950 1960 1970 1980 1990
7
6
5
4
3
2
5
4
3
2
Figure 5.1 Corn and rice yields in the U.S. and Japan in the last 100 years (Uchijima,
1990).
which the interactions between organisms and environment and matter
cycling in agricultural ecosystems are properly utilized (Edwards et al., 1990;
Shiyomi, 1993). First we discuss the problems everyone is presently facing.
There are three reasons for making such a change. One reason is the
depletion of readily available fossil fuel resources. According to the Tokyo
newspaper Asahi-shinbun (December 25, 1994),
Energy problem is serious. The Central Institute of Electric Power Industry,
Japan, predicts that the annual energy demand in the world in 2050 will
reach an equivalent of 13 to 24 billion tons of petroleum. If the present rate
of consumption of fossil fuel continues, all presently known oil deposits will
have been mined by 2040, and all deposits to be found in the future will be
mined by 2080, too. Natural gas will be exhausted by 2080.
An American entomologist, D. Pimentel, stated (Pimentel 1992),
“Unfortunately throughout the world more fossil energy is being used in
order to increase food production for the ever expanding world population.
While the world population grows, the known supplies of fossil energy are
being rapidly drawn down. For example, most world oil and natural gas
reserves will be consumed during the next 35 years.” Although the time
920103_CRC20_0904_CH05 1/13/01 10:48 AM Page 96
UTILIZATION OF BIOLOGICAL INTERACTIONS AND MATTER CYCLING IN AGRICULTURE 97
when the fossil deposits would have been exhausted differs among the
reports, someday they will disappear.
A second reason for change is that as the amount of fertilizers and agro-
chemicals used increases, increase in the growth and yield of crops decreases
exponentially, and eventually the growth and yield level off. Furthermore, to
these reduced marginal rates of return from input use, it is unlikely that new
strains or varieties can be developed that will respond more effectively to an
increase in input.
Another reason for change is that the consumption of fossil fuel energy
has led to the degradation of the environment. According to Pimentel (1992),
“In addition, the heavy use of pesticides, especially in developed countries,
is having widespread impact on aquatic and terrestrial ecosystems.
Worldwide an estimated 2.5 billion kg of pesticide is applied to agriculture.
Yet, less than 0.1% of this pesticide reaches the target pests, with the remain-
der negatively affecting humans, livestock, and natural biota. Just in the U.S.,
it is estimated that pesticides cause $8 billion in damage to the environment
and public health each year. Million of wild birds, mammals, fishes, and ben-
eficial natural enemies are destroyed each year because of the recommended
use of pesticides in the U.S.”
It is clear that modern agricultural practices, which depend on inputs of
fossil energy, have exerted a variety of harmful effects on both the local
ecosystems and the global biosphere.
This chapter discusses two topics. The first concerns the importance of
the use of complex biological interactions as an alternative to the heavy use
of fossil energy in modern agriculture. The second discusses the impor-
tance of matter cycling in agricultural ecosystems and uses examples of car-
bon and nitrogen budgets in ecosystems of grassland, upland field and
paddy field.
FROM AGRICULTURE BASED ON FOSSIL ENERGY TO
AGRICULTURE BASED ON THE USE OF COMPLEX
BIOLOGICAL INTERACTIONS
As mentioned above, the increases in agricultural production in
advanced countries from the 1950s to the 1970s were largely due to large
increases in the use of fossil fuel energy. Specifically, the increases have been
due to the increased use of fertilizers, agricultural chemicals, and big
machines that are produced and operated with fossil energy sources, and to
the breeding of new varieties of crops that are responsive to and compatible
with such chemical inputs and cultural practices (Pimentel et al., 1973).
Researchers have also promoted this agricultural system by focusing on
research on improving crop yield through the direct use of these fertilizers,
agrochemical inputs, and machinery. Indeed, these research programs have
been very efficient and have led to the increase of both crop and livestock
production. The use of intra- and interspecific interactions and interactions
920103_CRC20_0904_CH05 1/13/01 10:48 AM Page 97
98 STRUCTURE AND FUNCTION IN AGROECOSYSTEMS DESIGN AND MANAGEMENT
between organisms and the environment, such as climatic factors and soils,
have no particular place in the current agricultural system. In modern agri-
culture, these interactions are viewed as production constraints that must be
overcome to make high production possible. Since the direct effects of the use
of fossil fuel energy and products on agricultural production have been so
powerful, reliable, and dramatic, little attention has been paid to the complex
networks of interactions operating in agricultural ecosystems. For example,
competition between phytophagous insects, the effects of insect pathogens
and other natural enemies on these phytophagous species, and antagonisms
between them have intentionally been ignored. Because of the clear, direct
effectiveness of agrochemicals, it seemed that insect pests, plant pathogens,
and weeds could be controlled at sufficiently low levels without considering
the biological functions and interactions in agricultural ecosystems. And
because of the clear, direct effectiveness of fertilizers, it seemed that high crop
yields could be guaranteed without the help of the subtle actions of soil-
borne microorganisms. Complex intercroppings have been excluded so that
machinery can be operated more efficiently. However, this modern agricul-
ture has led to the three problems stated above. In the alternative type of agri-
culture, instead of modern agriculture, analyses of indirect effects operating
among the complex networks of biological interactions and between organ-
isms and the environments in place of the direct effects must be considered.
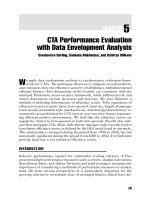
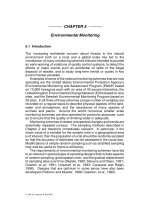
Plant-Grasshopper-Mantis-Bird Model
Because of the complexity of biological interactions, such interactions are
most effectively understood by the use of system analysis (Edwards, 1990).
To demonstrate this concept, I will use a 4-component system composed of
pasture plants, grasshoppers, mantes and birds (Figure 5.2) (Levins and
Vandermeer, 1990). Grasshoppers eat plants, mantes eat grasshoppers, and
birds eat both grasshoppers and mantes. The first system (Figure 5.2a) is
composed of only the three components, in which the population of
grasshoppers increases as the biomass of pasture plants increases. If the pop-
ulation of grasshoppers increases, the population of mantes increases, and
the biomass of plants decreases. Then, when the biomass of plants increases,
the populations of grasshoppers and mantes increase. When the population
of mantes increases, the population of grasshoppers decreases, and then the
plant biomass increases.
If we add birds as the fourth component in the system (Figure 5.2b), the
interactions operating among these components become much more compli-
cated because the birds kill both grasshoppers and mantes. As can be seen in
Figure 5.2c, the bird population increases as the grasshopper population
increases. In Figure 5.2d, I is an agrochemical. Farmers do not ordinarily use
agrochemicals if many mantes, which can kill most of the grasshoppers, live
there. It becomes increasingly difficult to understand intuitively the interac-
tions operating in such systems even in such a 4-component system like this
920103_CRC20_0904_CH05 1/13/01 10:48 AM Page 98
UTILIZATION OF BIOLOGICAL INTERACTIONS AND MATTER CYCLING IN AGRICULTURE 99
P
P
H
I
I
I
C
C
P
H
H
C
P
H
C
a
b
c
d
Figure 5.2 Plant-grasshopper-mantis-bird model. P, H, C and I indicate the numbers
of plants, grasshoppers, mantes and birds, respectively. In (d) I stands for
pesticide. Arrows and circles indicate positive and negative feedbacks,
respectively. (From Levins and Vandermeer, 1990.)
example. Indeed, even such a simple system may be too complicated for the
human brain to understand.
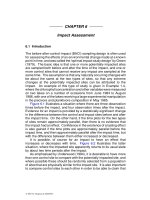
Grasshopper-Mantis Model
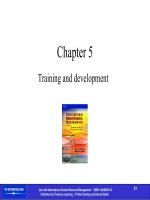
As another example for conceptualizing such simple systems, a 3-com-
ponent system, is shown in Figure 5.3. In this system, there are two kinds of
grasshoppers and one kind of mantis, where mantes eat both kinds of
grasshoppers. The two kinds of grasshoppers compete with each other for
resources. The time-dependent changes in these three components are
expressed by the following equations (Levins and Vandermeer, 1990):
dH
1
/dt ϭ H
1
(r
1
Ϫ a
11
H
1
Ϫ a
12
H
2
Ϫ a
13
C) (5.1)
dH
2
/dt ϭ H
2
(r
2
Ϫ a
22
H
2
Ϫ a
21
H
1
Ϫ a
23
C) (5.2)
dC/dt ϭ C(r
3
ϩ a
32
H
2
ϩ a
31
H
1
). (5.3)
920103_CRC20_0904_CH05 1/13/01 10:48 AM Page 99
100 STRUCTURE AND FUNCTION IN AGROECOSYSTEMS DESIGN AND MANAGEMENT
Grasshoppers 1Grasshoppers 2Mantes
600
400
200
1000
500
0
200
100
100
200
200
300
400
400
500
600
800
800
600
400
200
0
1000
0
0
0
0
100 200 300 400 500
100 200 300 400 500
0
0
Time
Time
(b)
(a)
A
B
a
13
a
23
a
32
a
31
a
21
a
12
a
11
a
22
H1
H2
C
Figure 5.3 Grasshopper-mantis model (Levins and Vandermeer, 1990). There are
two kinds of competitive grasshoppers and one kind of mantis. H
1
, H
2
,
and C indicate the numbers of the two kinds of grasshoppers and
mantes, respectively. The simulated results on the left and right sides
depict the cases for r
3
ϭϪ1.25 and Ϫ1.0, respectively. A large negative
r
3
indicates large cannibalism by mantes.
920103_CRC20_0904_CH05 1/13/01 10:48 AM Page 100
UTILIZATION OF BIOLOGICAL INTERACTIONS AND MATTER CYCLING IN AGRICULTURE 101
Here, H
1
, H
2
, and C denote the densities of the two kinds of grasshoppers and
mantes, respectively, and a and r are positive constants, except for r
3
which
denotes cannibalism by the mantes and has a negative value. Time is
expressed by t. Equation 5.1 indicates that the population growth rate of
grasshopper 1 is proportional to the quantity indicated in parentheses, where
r
1
is a growth coefficient assuming the absence of interspecific competition
and predation. The negative terms are corrections to r
1
due to interactions
with each of the three organisms. Equation 5.2 for grasshopper 2 is very sim-
ilar to the first equation. Equation 5.3 applies to the mantis, whose popula-
tion increases in proportion to the quantities of the two kinds of
grasshoppers, and decreases with their own cannibalism.
In the first simulation, r
3
was set at Ϫ1.25. The results are shown on the
left side of Figure 5.3. What changes will occur if r
3
increases to Ϫ1 (i.e., can-
nibalism decreases)? Intuitively, one would expect an increase in the popula-
tion of mantes and a decrease in the population of grasshoppers due to
increased predation. However, as shown in Figure 5.3 (right panel), the pop-
ulation of mantes did not increase, and the population dynamics of grasshop-
pers were very different from our expectation. This phenomenon is known as
an example of a chaotic event. The above two examples, the 4-component
and 3-component systems, indicate that even in such simple systems it is not
easy to predict how the individual components interact with each other.
Predicting the behavior of and properly managing an actual agricultural
ecosystem may be too difficult without appropriate methods such as system
simulations (Edwards, 1990).
THE IMPORTANCE OF MATTER CYCLING IN THE NEW
AGRICULTURE
To grow crops with reduced amounts of fertilizers in agricultural ecosys-
tems in the next generation, it is important to develop methods to accelerate
nutrient cycling, and there are two approaches: activation of inactive ele-
ments that are stored in the ecosystem, such as inactive nitrogen and phos-
phorus in the soil; and acceleration of the turnover rate. Examples of the
former are utilization of phosphorus by plants after solubilization by phos-
phate-solubilizing soil microorganisms (Kimura et al., 1991) and utilization
of mineralized nitrogen from microbial biomass and organic matter by dry-
ing and heating of soil (Okano, 1990), although they have not been developed
as a technology yet.
Iwama et al. (1992) reported an example of improvement of nutrient
turnover rate through the introduction of intermittent grazing. At the
National Grassland Research Institute, Nagano, Japan, a pasture was seeded
in 1966 with tall fescue, orchard grass, timothy, red clover, and white clover.
The grass was then cut three times a year. Starting in 1973, grazing was
allowed in one part of the pasture after the second cutting each year. Dry
920103_CRC20_0904_CH05 1/13/01 10:48 AM Page 101
102 STRUCTURE AND FUNCTION IN AGROECOSYSTEMS DESIGN AND MANAGEMENT
matter plant yield was found to be dramatically higher in the grazed pasture
than in the ungrazed pasture. Although no direct, numerical data were
provided, the nutrient turnover rate in the pasture where grazing was intro-
duced was clearly accelerated through the animal-excreta-soil microbial-
plant interactions. In this section, we present examples of carbon and
nitrogen flow in agroecosystems.
Grassland Ecosystems
Energy flow and nutrient cycling have been analyzed in various ecosys-
tems for the past twenty years. These analyses are essential to obtain a more
detailed description of a system’s productivity and nutrient cycling. In agri-
cultural ecosystems, solar energy is converted into chemical energy by pho-
tosynthesis in crops. Some of the energy is used by the plant for respiration,
and the remainder is fixed as net primary production. The energy of net pri-
mary production is passed on to the other compartments, and finally it flows
out from the system to the inorganic environment in various ways.
Understanding the balance between the energy or carbon inflow and outflow
and also the transfer functions is essential for the study of the dynamic
behavior of an ecosystem. The energy or carbon budget in an agricultural
ecosystem indicates the degree of stability of the soil fertility or the sustain-
ability of the agricultural ecosystem. To explore these ideas, we discuss the
carbon and nitrogen budgets in grasslands and then compare them with the
corresponding budgets in upland and paddy fields.
Surveys of energy and matter budgets in a grassland have been carried
out at the National Grassland Research Institute, located in central Japan, a
region where the livestock industry has predominated on the main island of
Japan, since 1974. These budgets have been measured at the plant, animal,
and ecosystem levels on a yearly basis (Akiyama et al., 1984; Koyama et al.,
1986; Takahashi et al., 1989). Based on these measurements, an energy, or car-
bon, and nitrogen flow model was constructed (Shiyomi et al., 1988; Shiyomi
et al., 2000). The outline of the model is as follows: we assume that the
amounts of energy and nitrogen and their time-dependent variations in each
compartment are determined by their fluxes into and out of each of these
compartments. Thus, the time-dependent variation in the amounts of energy
and nitrogen at time t, x(t)’s, can be described by dx(t)/dt’s although the
equations are omitted here. The concept of the model is illustrated in Figures
5.4a and 5.4b.
Key parameters in the model are as follow:
1. Global solar radiation, Q, which changes over the course of a year
according to a sine curve (kJ m
Ϫ2
day
Ϫ1
).
2. Conversion efficiency of global solar radiation to photosynthesis
f ϭ [1 Ϫ (2.4L ϩ 1) Ϫ 1]a(aQ ϩ 1)
Ϫ1
, where L is the leaf area index
and a is a constant.
920103_CRC20_0904_CH05 1/13/01 10:48 AM Page 102
UTILIZATION OF BIOLOGICAL INTERACTIONS AND MATTER CYCLING IN AGRICULTURE 103
A Light intensity
Leaf
area index
Sun
Grazing
intensity
Digestibility
Amount of
standing dead
material
Amount of
available
herbage
Amount of
unavailable
herbage
Amount of
herbage intake
by cattle
Body
weight of
cattle
Air
temperature
Amount of
feces
Respiration
Amount of
belowground
portions
Soil
organisms
Soil organic
matter
Tu r nover
rate of soil
organisms
Water content
Amount of
litter
Figure 5.4a Energy flow compartment model for grazing grassland (Shiyomi et al.,
1988). “A” indicates the link between energy and nitrogen models.
3. Respiration-loss energy by plants is expressed by a linear relation
of daily air temperature, and heat-loss energy from cattle is a func-
tion of body weight, digestibility, etc. (kJ m
Ϫ2
day
Ϫ1
).
4. The herd ingests each day an amount of herbage (dry weight)
equivalent to 2.5% of live cattle body weight (kJ m
Ϫ2
day
Ϫ1
).
5. Theenergy accumulation ina cattlebody is given by (herbage intake,
kgDM) ϫ (digestibility) ϫ 0.414, where 41.4% of digested energy is
accumulated in the cattle body. Digestibility is given by the equa-
tion 619.6/(herbage biomass, kJ m
Ϫ2
) ϩ 0.398 (Koyama et al., 1986).
6. The total amount of nitrogen lost from the soil, which includes the
amounts absorbed by plants and runoff/leaching, is expressed by
linear functions of the number of days counted from March 1.
7. A 100 kg heifer excretes 58.0 gN as dung and 26.8 gN as urine each
day.
920103_CRC20_0904_CH05 1/13/01 10:48 AM Page 103
104 STRUCTURE AND FUNCTION IN AGROECOSYSTEMS DESIGN AND MANAGEMENT
Mortality rate
Amount in above-
ground portion
A
Ingestion rate
Amount ingested
by cattle
Cattle
body
Amount in standing
dead material
T/R
balance
Amount in
litter
Decomposition
rate
Soil organic
matter
Soil organisms
Rate
from standing
dead material
to litter
Amount in below-
ground portion
Amount in
soil
Turnover rate
Fixation
Legume biomass
Volatilization,
leaching etc.
Application
Amount in
excreta
Volatilization
rate etc.
Crop growth
rate
Figure 5.4b Nitrogen flow compartment model for grazing grassland (Shiyomi et al.,
1988). “A” indicates the link between energy and nitrogen models.
8. Legumes fix 0.011 to 0.012 gN m
Ϫ2
day
Ϫ1
.
9. The nitrogen concentration in plant leaves affects the leaf area
index, which is expressed by a logistic function of nitrogen concen-
tration.
An annual gain of 1 ton cattle body weight ha
Ϫ1
was attained in an inten-
sively managed pasture (IMP) at the National Grassland Research Institute,
Tochigi, in 1986 (Kobayashi et al., 1989). The carbon and nitrogen budgets
estimated using the systems model for the ecosystem in this pasture were
compared with those estimated in an extensively managed pasture (EMP).
In a computer simulation of the IMP, seven young Holstein oxen were
grazed on a 1-ha orchard grass-white clover pasture, where 160 kgN ha
Ϫ1
yr
Ϫ1
was applied, for a period of 200 days from April onward. Likewise, in a com-
puter simulation of the EMP, three young Holstein oxen were grazed on a 1-
ha orchard grass-tall fescue-red top-white clover pasture, where 50 kgN ha
Ϫ1
yr
Ϫ1
was applied, for the same grazing period. The results are shown in Table
5.1. If we suppose that the amounts of carbon in plant bodies in both the EMP
and IMP do not change between the successive two years in the simulations,
920103_CRC20_0904_CH05 1/13/01 10:48 AM Page 104
UTILIZATION OF BIOLOGICAL INTERACTIONS AND MATTER CYCLING IN AGRICULTURE 105
Table 5.1 Carbon and Nitrogen Budgets at the Ecosystem Level in a Grazing
Pasture in the Kanto District, Japan
Input Carbon, g m
؊2
yr
؊1
Nitrogen, g m
؊2
yr
؊1
Item IMP EMP Item IMP EMP
Carried-forward Carried-forward 294.6 294.6
from previous from the
year previous year
by plant bodies 470 470 Fixation 4.1 3.2
by organic C 11088 11088
in soil Dry/wet deposition 2.0 2.0
Net primary 677 671 Fertilizer 16.0 5.4
production
Supplement 14 0 Supplement 1.4 0.0
(hay supply) (hay supply)
Rain 9 9
Total 12258 12237 Total 318.1 305.2
Output Carbon, g m
؊2
yr
؊1
Nitrogen, g m
؊2
yr
؊1
Item IMP EMP Item IMP EMP
Cutting 57 0 Secondary net 2.9 1.7
Heat production production
by animals 230 118 Cutting 10.4 0.0
Soil respiration 203 184 Runoff/leaching, 9.2 11.3
Net secondary 30 16 etc.
production Carried-forward 295.6 292.2
Runoff 4 4 to the next year
Carried-forward Total 318.1 305.2
to the next
year
by plant bodies 470 470
by organic C 11264 11446
in soil
Total 12258 12237
the amounts of organic carbon of 176 and 258 gC m
Ϫ2
, respectively, increased
in the soil per year. These results suggest that a grassland ecosystem or the
soil accumulates carbon year by year, in contrast to an annual upland crop
field.
The nitrogen inflow to the pasture markedly affected the nitrogen
dynamics in the EMP and IMP. On the other hand, the outflow of nitrogen
from the pasture, such as runoff, leaching, denitrification, and volatilization,
might also exert a considerable effect on the nitrogen dynamics. Nitrogen
removal from the pasture by cattle also exerted a significant effect on the
nitrogen dynamics. Under an application of a given amount of fertilizer
Source: Shiyomi, M. et al., 1988. Bull. Nat’l. Grassland Res. Inst., (Japan) 39:24–39.
920103_CRC20_0904_CH05 1/13/01 10:48 AM Page 105
106 STRUCTURE AND FUNCTION IN AGROECOSYSTEMS DESIGN AND MANAGEMENT
(about 80 kgN ha yr
Ϫ1
in our case), we found in the simulations that these two
grassland ecosystems could keep a balance between the inflow and outflow
of nitrogen.
Upland Crop Field Ecosystems
The investigations of carbon dynamics were carried out from June 1985
to May 1988, in upland fields in the Tsukuba area in Ibaraki Prefecture in cen-
tral Japan (36°08Ј N, 140°10Ј E, 28 m asl) (Koizumi et al., 1992). Three double-
cropping agroecosystems were set up: upland rice-barley, peanut-wheat, and
corn-Italia ryegrass systems. The mean annual precipitation in this area was
1202 mm and the mean annual temperature was 13.1°C during the period
from 1985 to 1987; the warmth index was 103.7 degree-months.
Figure 10.1 in Chapter 10 illustrates the carbon dynamics of an agro-
ecosystem. CO
2
from the atmosphere that is incorporated into crops by pho-
tosynthesis is designated as gross primary production. Some of the gross
primary production is used by plants for respiration. The remaining gross
production corresponds to fixed carbon as the net primary production, which
is consumed by other trophic levels such as predators and decomposers. On
the other hand, the carbon balance of the soil can be outlined as follows: the
inflow consists of various organic materials, such as litter, stubble and roots
of crops, and stable manure. The outflow consists of respiration caused by the
decomposition of organic matter in the soil. Based on the above data, we can
estimate the values for each of the compartments indicated in the figure.
Table 5.2 compares the annual carbon budgets between the three double-
cropping systems. The amount of carbon supplied to the soil as organic matter
was 338–382 gC m
Ϫ2
for the food crops and 420 gC m
Ϫ2
for the forage crops. The
carbon respired by the heterotrophs was 716–798 gC m
Ϫ2
and 1050 gC m
Ϫ2
,
respectively. Therefore, the annual carbon balance was from Ϫ378 to Ϫ415 gC
m
Ϫ2
for the two food crop systems and Ϫ630 gC m
Ϫ2
for the forage crop sys-
tem. The consumption of soil carbon in the forage crop system was about 1.5
times larger than that in the food crop systems. This difference in carbon bal-
ance was caused by difference in the organic matter supplied to the soil.
Comparison of the carbon balances between summer and winter crop
systems showed that the carbon losses were larger in the summer crop sys-
tems than in the winter crop systems (Koizumi et al., 1993). These differences
are caused by the differences in the amounts of CO
2
evolved by the respira-
tion of the heterotrophs in summer and winter; i.e., the respiration activities
of the heterotrophs are higher in summer than in winter. In the fallow period,
moreover, the amount of carbon respired by the heterotrophs accounted for
15–29% of the annual carbon losses in all the double-cropping systems.
Similar results were obtained in single summer crops by Beck (1991), sug-
gesting that effective measures must be taken to maintain the carbon balance
in agricultural ecosystems in order to maintain soil fertility for the cultivation
of crop fields. These results also suggest that upland field ecosystems are con-
920103_CRC20_0904_CH05 1/13/01 10:48 AM Page 106
UTILIZATION OF BIOLOGICAL INTERACTIONS AND MATTER CYCLING IN AGRICULTURE 107
Table 5.2 Annual Carbon Budget (gC m
؊2
; means of three years) of Each
Component in Three Double-cropping Ecosystems.
Corn-Italian
Item/System Rice-Barley Peanut-Wheat Ryegrass
Carbon in crops
Gross production 1070 1315 2910
Net production 615 626 1357
Removal by harvest 278 244 1084
Residual in/on soil 338 382 274
Removal by predation nil nil nil
Respiration by crops 454 689 1553
Carbon in soil
Storage in the upper 70 cm layer 20030 18950 10480
Supply as manure 0 0 146
Supply as litter, stubbles and roots 338 382 274
Respiration by heterotrophs 716 798 1050
Balance at ecosystem level Ϫ378 Ϫ415 Ϫ630
(Koizumi et al., 1992)
tributing to the increase in the carbon dioxide content of the atmosphere
because a proportion of the carbon stored in the soil is released continuously.
The contribution is significant in view of the area of upland cropland in Japan
(about 1.25 million ha).
Paddy Field Ecosystems
In Japan, rice has been cultivated for more than 2000 years. In 1990, the
total area used for growing rice was more than 2 million hectares, the total
yield was more than 10 million tons, and the average yield was about 5000 kg
ha
Ϫ1
. In many areas, rice has been cultivated in the same fields for several
hundreds of years.
Enormous amounts of research data have been accumulated and have
resulted in very high paddy rice yields. However, we cannot find even one
experiment that measured the complete budget of carbon and nitrogen of
rice. All that appears to be available on this subject are the above-mentioned
studies on upland crop fields grown such as wheat, barley, and maize, and
grassland. At present, two studies are attempting to estimate the carbon and
nitrogen budgets at the National Institute of Agro-Environmental Sciences,
Japan.
I will summarize one of the experiments on carbon cycling (Koizumi,
personal communication). Several assumptions are made about the carbon
dynamics in the paddy field ecosystem with respect to the inflow of car-
920103_CRC20_0904_CH05 1/13/01 10:48 AM Page 107
108 STRUCTURE AND FUNCTION IN AGROECOSYSTEMS DESIGN AND MANAGEMENT
bon through irrigation to the paddy field, the outflow through runoff of
above- and underground water from the paddy field, and fixation of carbon
by rice plants and algae growing in the paddy field (see Figure 10.2 in
Chapter 10).
Field observations revealed that the surface of the paddy field was
absorbing CO
2
from the atmosphere in the daytime and releasing it at night,
regardless of the season. The inflow and outflow of the CO
2
were small until
the end of June, after which they increased with the increase of plant biomass.
The inflow and outflow reached their maximum values in July and then
gradually decreased with the deterioration in the light environment. CO
2
was
absorbed by the water of the paddy field in June and July because of the activ-
ity of the algae in the water, but there was a net loss of CO
2
from the water
surface starting in late August.
The low temperature and low pH of paddy water suppress the decom-
position of organic matter in the water, and these conditions decrease the CO
2
emission from the paddy field. The annual carbon budget in paddy field
ecosystems has not yet been completed, but these experiments clarified that
the inflow of carbon in paddy field ecosystems exceeded the inflow of carbon
in upland cropland ecosystems because algae living in the paddy field fix car-
bon. This suggests that paddy field ecosystems are more sustainable than
upland crop field ecosystems in terms of soil fertility.
Torigoe et al. (1991), using a simulation model of a long-term nitrogen
cycle in paddy field ecosystems, showed that paddy field ecosystems in
Japan are sustainable. An outline of the simulation model is shown in Figure
5.5. Nitrogen in the paddy soil is categorized into the following five classes:
(1) effective nitrogen, (2) nitrogen contained in easily decomposable organic
matter such as protein, (3) nitrogen contained in hardly decomposable
organic matter such as cellulose and lignin, (4) nitrogen contained in live soil
organisms, and (5) nitrogen in plants.
The model incorporates three types of outflow of nitrogen from the
paddy field ecosystem (decomposition of easily or hardly decomposable
organic matter, harvest, and other losses due to runoff, volatilization, leach-
ing, and denitrification) and five types of inflow of nitrogen (fertilization,
manuring, wet or dry deposition, microbial fixation, and irrigation).
The results of the simulation (Figure 5.6) show that the nitrogen dynam-
ics reached a stationary level in the first ten years, and this state continued
permanently.
CONCLUSIONS
Until the 1930s, agriculture based on the use of complex biological inter-
actions was most common even in the present developed countries; for
example, in Ohio in the U.S., 57% of soybean cultivation involved intercrop-
ping with corn (Vandermeer, 1990). In developing countries even today,
920103_CRC20_0904_CH05 1/13/01 10:48 AM Page 108
N contained in hardly
decomposable organic matter
N contained
in easily
N contained in plants
decomposable organic matter
Microbial
decomposition
Harvest
Effective
N
Microbial decomposition
Manure
N contained in
live soil organisms
Manure
Microbial fixation
Release by decomposition
of organic matter
Fertilization
Runoff
Wet or dry deposition Irrigation
Volatilization
Leaching
Denitrification
AN
NF
NS
NMB
Figure 5.5 Structure of a nitrogen flow model of a paddy field (Torigoe et al., 1991). EN: effective nitrogen; NEDOM: nitrogen contained
in easily decomposable organic matter; NHDOM: nitrogen contained in hardly decomposable organic matter; NLSO: nitrogen
in live soil organisms; NP: nitrogen contained in plants.
920103_CRC20_0904_CH05 1/13/01 10:48 AM Page 109
UTILIZATION OF BIOLOGICAL INTERACTIONS AND MATTER CYCLING IN AGRICULTURE 109
110 STRUCTURE AND FUNCTION IN AGROECOSYSTEMS DESIGN AND MANAGEMENT
1500
1125
750
375
0
05
10 15 20
( y e a r )
( N . K g / h a )
1 : Effective N
2 : NEDOM
3 : NHDOM
4 : NLSO
33
33
33
3
1
1
1
1
1
1
1
2
2
2
2
2
2
2
4
4
4
4
4
44
Time
Figure 5.6 Simulated nitrogen dynamics in a paddy field (Torigoe et al., 1991). The
unit is expressed in kgN ha
Ϫ1
. EN: effective nitrogen; NEDOM: nitrogen
contained in easily decomposable organic matter; NHDOM: nitrogen
contained in hardly decomposable organic matter; NLSO: nitrogen in live
soil organisms.
intercropping is the most prevailing type of cultivation. After the Second
World War, the use of fossil energy in modern agriculture increased world-
wide, but, as mentioned above, a reassessment of such a type of agriculture
is now essential. Little is known about advanced agricultural technology
based on the use of complex biological interactions and matter cycling
because such types of agriculture have not been developed during the 50
years after the war. Thus, it is important to elucidate the structure and func-
tion and to use complex biological interactions and matter cycling in agricul-
tural ecosystems (Shiyomi, 1993).
The world population was 2.8 billion in 1945, and it doubled in the fol-
lowing 50 years. It is predicted that the world population will again double
in the next 50 years. Much progress has been made in agriculture during
these 50 years. It is the duty of agricultural scientists to attain a high level of
technology in food production. To achieve this objective, we must (1) control
the increase of the world population, (2) use fossil fuels judiciously, (3) find
more efficient ways to utilize natural energy, including solar energy, and (4)
develop an agriculture that is not dependent on fossil energy but on complex
biological interactions and matter cycling.
REFERENCES
Akiyama, T., S. Takahashi, M. Shiyomi and T. Okubo. 1984. Energy flow at the pro-
ducer level, the energy dynamics of grazed grassland 1.
OIKOS 42: 129–137.
920103_CRC20_0904_CH05 1/13/01 10:48 AM Page 110
UTILIZATION OF BIOLOGICAL INTERACTIONS AND MATTER CYCLING IN AGRICULTURE 111
Beck, Y. 1991. Soil Respiration and Carbon Budget in Upland Crop Ecosystems.
Master’s Thesis, Tsukuba University (Japanese, English summary).
Edwards, C.A. 1990. The importance of integration in sustainable agricultural sys-
tems. In: C.A. Edwards, R. Lal, P. Madden, R.H. Miller, and G. House, Eds.,
Sustainable Agriculture Systems, Soil and Water Conservation Society, Iowa.
249–264.
Edwards, R. Lal, P. Madden, R.H. Miller, and G. House. 1990.
Sustainable Agriculture
Systems.
Soil and Water Conservation Society. Iowa. 287–296.
Gaston, G.G., T. Kolchugina, and T.S. Vinson. 1993. Potential effect of no-till manage-
ment on carbon in the agricultural soils of the former Soviet Union.
Agric.
Ecosystems & Environ.
45: 295–309.
Iwama, H., H. Murakami, N. Kitahara, and K. Okamoto. 1991. Increase in rate of nutri-
ent cycling in meadow in introduction of seasonal grazing.
Bulletin of National
Grassland Research Institute
(Japan) 46: 61–71. (Japanese, English summary)
Kimura, R., M. Nishio, and K. Katoh. 1992. Utilization of phosphorus by plant after
solubilization by phosphate-solubilizing microorganisms in soil.
Trans. 14th Int.
Cong. Soil Sci.
3: 228–229.
Kirita, H., Y. Saito, Y. Yamamoto, and N. Nishimura. 1988. Dynamics of soil organic
matter in a grassland vegetation-soil system. In:
Bulletin of Green Energy Program,
Group 3 (No.4). Agriculture, Forestry and Fisheries Research Council Secretariat,
MAFF. Tokyo. 16–42. (Japanese, English summary)
Kobayashi, H., K. Ochiai, S. Shioya, Y. Togamura, T. Ami, N. Harashima, K. Sato, and
M. Nashiki. 1989. New grazing animal production system in Japan.
Proc. 16th Int.
Grassland Cong.
The French Grassland Society. Versailles. 1139–1140.
Koizumi, H., Y. Usami, and M. Satoh. 1993. Carbon dynamics and budgets in three
double-cropping agro-ecosystems in Japan.
Agric. Ecosystems & Environ. 43:
235–244.
Koyama, N., M. Shiyomi and M. Tsuiki. 1986. Energy flow on grazing pasture. 2.
Energy and nitrogen budgets.
Bull. Natl. Grassland Res. Inst. (Japan) 33: 17–26.
(Japanese, English summary)
Levins, R. and J.H. Vandermeer. 1990. The agroecosystem embedded in a complex
ecological community. In: C.R. Carroll, J.H. Vandermeer and P.M. Rosset, Eds.
Agroecology, McGraw-Hill Publishing Company, New York. 341–362.
Okano, S. 1990. Availability of mineralized nitrogen from microbial biomass and
organic matter after drying and heating of grassland soils.
Plant and Soil 129:
219–225.
Pimentel, D. 1992. Preface. In: M. Shiyomi, E. Yano, H. Koizumi, D.A. Andow, and N.
Hokyo, Eds.,
Ecological Processes in Agro-Ecosystems. NIAES, Yokendo Publishers,
Tsukuba, Tokyo. 3–4.
Pimentel, D., L.E. Hurd, A.C. Bellotti, M.J. Forster, I.N. Oka, O.D. Scholes, and R.J.
Whitman. 1973. Food production and the energy crisis.
Science 182: 443–449.
Shiyomi, M., N. Koyama, M. Tsuiki, T. Akiyama, and S. Takahashi. 1988. A prelimi-
nary study of nitrogen dynamics in a grazing pasture ecosystem. (2) A model for
energy and nitrogen flow.
Bull. Natl. Grassland Res. Inst. (Japan) 39: 24–39.
Shiyomi, M., H. Kirita, and S. Takahashi. 1992. Energy, nitrogen, phosphorus and car-
bon budgets at plant, animal and ecosystem levels in grazing grasslands in the
Nishinasuno Area, Japan. In: M. Shiyomi, E. Yano, H. Koizumi, D.A. Andow, and
N. Hokyo, Eds.,
Ecological Processes in Agro-Ecosystems. NIAES, Yokendo
Publishers, Tsukuba, Tokyo. 173–188.
920103_CRC20_0904_CH05 1/13/01 10:48 AM Page 111
112 STRUCTURE AND FUNCTION IN AGROECOSYSTEMS DESIGN AND MANAGEMENT
Shiyomi, M. 1993. From agriculture based on fossil energy to agriculture based on the
use of complex bio-interactions.
Japanese Agricultural Systems Society 9(1): 7–21.
(Japanese, English summary)
Shiyomi, M., S. Takahashi, and H. Kirita. 2000. Roles of plant biomass and vegeta-
tional heterogeneity, and energy-matter cycling in grassland sustainability.
Ecol.
Modelling
132: 135–149.
Takahashi, S., T. Akiyama, M. Shiyomi, and T. Okubo. 1989. The energy dynamics of
grazed grassland. 2. Energy flow at the herbivore level.
Bull. Natl. Grassland Res.
Inst.
(Japan) 42: 41–48.
Torigoe, Y., N. Furuya, M. Shiyomi, Y. Yamagata, and H. Koizumi. 1991. A nitrogen
cycling model in paddy field ecosystems.
Japanese Agricultural Systems Society
7(1): 88–89. (Japanese)
Uchijima, Z. 1990.
Crisis in the Global Environment. Godo-Shuppan, Tokyo. p. 170.
(Japanese)
Vandermeer, J.V. 1990. Intercropping. In: C.R. Carroll, J.H. Vandermeer and P.R.
Rosset, Eds.,
Agroecology. McGraw-Hill Publishing Company. New York. 341–362.
920103_CRC20_0904_CH05 1/13/01 10:48 AM Page 112