Biochemical, Genetic, and Molecular Interactions in Development - part 9 potx
Bạn đang xem bản rút gọn của tài liệu. Xem và tải ngay bản đầy đủ của tài liệu tại đây (1.26 MB, 45 trang )
342 Conway
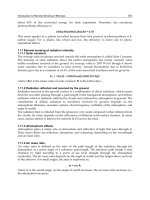
Fig. 3. Histological analysis of the pathogenesis of the midface cleft. Transverse sections through the heads of
10.5-dpc wild-type (+/+), male homozygous (Sp
2H
/Sp
2H
), and homozygous Patch (Ph/Ph) mutant embryos. At 10.5
dpc, the wild-type telencephalic (tele) vesicle is intact within the forehead region and there is a large open cham-
ber. The communication between the optic stalk and intra-retinal space is intact and there is space between the
walls of the third ventricle, plus the chamber of the fourth ventricle (4th Vent) is intact. Note that while the Ph/Ph
mutant head is grossly normal at 10.5 dpc, the Sp
2H
/Sp
2H
mutant head is already malformed. There is a large mid-
face cleft (indicated by *), the space of the telencephalon and third chamber is missing and the neuroepithelial
walls of the telencephalon and third chamber abut each other. Also, this embryo has exencephaly (ex) and the
chamber of the fourth ventricle is lost. (Bar = 0.18 mm.)
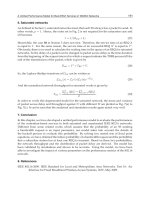
Fig. 4. Apoptotic cell death. TUNEL analysis in wild-type and homozygous (Sp
2H
/Sp
2H
) mutant male 10.5-dpc
embryos, as detected by the whole death method. The wild-type (+/+) embryo (viewed frontally) has a seam of
apoptotic cells along the frontonasal region of the anterior neuropore (indicated by arrowheads), following fusion
of the neural folds. Also note that there are normal levels of apoptosis within the heart (h) and in the remodeling
somites. There are equivalent levels of apoptotic cells within both the Sp
2H
/Sp
2H
) mutant frontonasal regions,
even though one mutant (middle embryo) has a closed anterior neuropore and exencephaly (ex) whereas the other
mutant (right) has an open anterior neuropore and a mid-face cleft (indicated by *). It is interesting to note that
there are still apoptotic cells along the neural folds in the cleft-face mutant, even in the absence of fusion.
mouse mutant models (28,53). In the absence of pronounced cell death, it appears that retinoic acid can
possibly produce deleterious effects on the precursors of craniofacial primordia, such as the neural
crest, by misexpression of developmentally important genes. Given these results, we addressed the
questions as to whether apoptosis was affected in Sp
2H
/Sp
2H
mutant embryos, whether endogenous
Pax3 and PDGF-_ Receptor 343
levels of retinoic acid were altered in Sp
2H
/Sp
2H
mutant embryos, and what role the cranial neural
crest play in the pathogenesis of the Sp
2H
/Sp
2H
mutant facial clefting.
Apoptotic cell death was examined at 9.5, 10.5, and 13.5 dpc by the “whole death” procedure. No
significant difference between wild-type and Sp
2H
/Sp
2H
mutant embryos was observed, even when
facial clefts were evident (Fig. 4). Both wild-type and Sp
2H
/Sp
2H
mutant embryos have a seam of apop-
totic cells along the frontonasal region of the anterior neuropore and histological sections through the
cephalic region did not reveal any differences in the localization or extent of apoptosis (not shown).
This result suggests that mid-face clefts are not caused by elevated apoptotic levels, but are more
likely due to a different cause.
Endogenous retinoic acid levels were assessed by breeding the Sp
2H
/Sp
2H
/+ mice to a retinoic acid
responsive reporter mouse, that expresses
`
-galactasidase in the presence of retinoic acid (37).
`
-
galactasidase expression was examined at 9.5–13.5 dpc by whole embryo staining, and the levels of
expression were unchanged in the Sp
2H
/Sp
2H
craniofacial region (Fig. 5). Similarly, retinoic acid sig-
naling and the role of the neural crest were assessed at 9.5–13.5 dpc by using molecular markers. A
retinoic acid-responsive transcription factor, Ap-2, (42) and cellular retinoic acid-binding protein-1
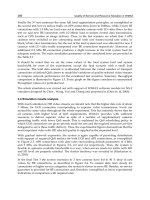
Fig. 5. Analysis of the endogenous levels of retinoic acid within homozygous (Sp
2H
/Sp
2H
) mutant embryos. At
11.0 dpc, retinoic acid-mediated
`
-gal staining is prominent along the anterior-posterior axis of the spinal cord,
and within the eyes and regions of the frontonasal primordia. Note that in the Sp
2H
/Sp
2H
mutant embryos. LacZ
expression is reduced in the tail (around the region of spina bifida), and there is ectopic staining of one of the
vagal branches in the cardiothoracic region (indicated by arrow), but the endogenous levels (as shown by lacZ
expression) are unchanged in the craniofacial region. A similar pattern of lacZ expression is observed in the 13.5-
dpc mutants.
344 Conway
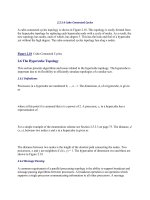
Fig. 6.
Expression of neural crest cell marker genes in both
Sp
2H
/Sp
2H
and Ph/Ph
mutant embryos. Left panels,
Sp
2H
/Sp
2H
, Ph/Ph
mutant, and littermate
control embryos were analyzed for
CRABP-1
mRNA expression by whole-mount
in situ hybridization. Note that
CRABP-1 is normally expressed within the
craniofacial region of 10.5-dpc
Sp
2H
/Sp
2H
mutant embryos (indicated by *) with a midface cleft (indicated by large white arrow head) and exencephaly but that
CRABP-1
is significantly downregulated in 9.5-dpc
Ph/Ph mutant craniofacial region (indicated by *). Also note that
CRABP-1 is misexpressed within the
cardiac neural crest cell region in
Sp
2H
/Sp
2H
mutant embryo, as instead of the normal three streams of migrating neural crest cells (indicated by three small white
arrows in +/+), there is only a single stream of migrating neural crest cells in the mutant embryo (indicated by single small w
hite arrow in mutant) Middle panels,
Enlarged Sp
2H
/Sp
2H
and wild-type (+/+) littermate control embryo were analyzed for
AP-2
mRNA expression by whole-mount
in situ
hybridization. Note that
Ap-2 is normally expressed within the craniofacial region of 10.5-dpc
Sp
2H
/Sp
2H
mutant embryo (indicated by *) with exencephaly. Right panels,
Sp
2H
/Sp
2H
, Ph/
Ph, mutant and littermate control embryos were analyzed for
Prx2
mRNA expression by whole-mount
in situ
hybridization. Note that
Prx2 is normally
expressed within the craniofacial region of 11.5-dpc
Sp
2H
/Sp
2H
mutant embryos (indicated by *), but that
Prx2 is significantly downregulated in 10.5-dpc
Ph/Ph
mutant craniofacial region (indicated by *).
344
Pax3 and PDGF-_ Receptor 345
(CRABP-1; ref. 47) are two genes that respond to retinoic acid that are also expressed within migrat-
ing neural crest cells (30,46). Both Ap-2 and CRABP-1 expression are unaffected in Sp
2H
/Sp
2H
mutant
craniofacial region but is downregulated in Ph/Ph mutants (Fig. 6).
The aristaless-related homeobox gene Prx2 is known to be required for normal skeletogenesis and
Prx1/Prx2 double mutants have a reduction or absence of skeletal elements in the skull and face (54).
Given this association and that Prx2 is expressed in neural crest cells as they are undergoing terminal
differentiation, we used the Prx2 molecular marker to determine whether there was a lack of cranial
neural crest cells present within the frontonasal primordia. Prx2 expression was unchanged in the
Sp
2H
/Sp
2H
mutant embryos but is downregulated in Ph/Ph mutants (Fig. 6), suggesting that the Sp
2H
/
Sp
2H
facial clefts are not caused by a lack of neural crest-derived mesenchyme.
These data suggest that Sp
2H
/Sp
2H
mutant midface clefts are not caused by the same neural crest-
associated mechanism as in Ph/Ph embryos and that neither retinoic acid levels and/or retinoic acid
signaling is perturbed within the Sp
2H
/Sp
2H
mutant embryo heads. Furthermore, these data indicate
that a lack of complete neural fold closure is the underlying cause of the Sp
2H
/Sp
2H
craniofacial malfor-
mations. Thus, the Sp
2H
/Sp
2H
mutant mice provides us with a new model for the study of facial clefting
and importantly demonstrates that craniofacial malformations are not solely caused by neural crest-
associated defects. It also has been demonstrated that similar abnormal phenotypes can be caused by
completely different mechanisms. This will be important when trying to understand the embryologi-
cal pathogenesis of many clinically complex and diverse human syndromes. Especially as the human
genome project continues, the understanding of facial clefting and its syndromes may continue to
improve. Such knowledge could advance diagnosis and treatment of the patient and counseling of the
affected family (8).
ACKNOWLEDGMENTS
I would like to thank Jian Wang, Rhonda Rogers, Eileen Dickman, and Kristi Singletary for their
excellent technical assistance and mouse husbandry. Additionally, we are grateful to Melissa Colbert
(Cincinnati Children’s Hospital Medical Center) for providing the RARE-lacZ reporter mice and Penny
Roon for help with the electron microscope. This work was supported by NIH grants HL60714 and
HL60104 to S. J. C.
REFERENCES
1. Wilkie, A. O. and Morriss-Kay, G. M. (2001) Genetics of craniofacial development and malformation. Nat. Rev. Genet.
2, 458–468.
2. Thorogood, P. (1993) The problems of building a head. Curr. Biol. 3, 705–708.
3. Schutte, B. C. and Murray, J. C. (1999) The many faces and factors of orofacial clefts. Hum. Mol. Gene 8, 1853–1859.
4. Richman, J. M. and Tickle, C. (1992) Epithelial-mesenchymal interactions in the outgrowth of limb buds and facial
primordia in chick embryos. Dev. Biol. 154, 299–308.
5. Young, D. L., Schneider, R. A., Hu, D., and Helms, J. A. (2000) Genetic and teratogenic approaches to craniofacial
development. Crit. Rev. Oral. Biol. Med. 11, 304–307.
6. Nuckolls, G. H., Shum, L., and Slavkin, H. C. (1999) Progress toward understanding craniofacial malformations. Cleft
Palate Craniofac. J. 36, 12–26.
7. Gruneberg, H. (1975) How do genes affect the skeleton? in New approaches to the evaluation of abnormal embryonic
development (Neuberg, D. and Merker, H. J., eds.), Georg Thieme, Stuttgart, pp. 354–359.
8. Coleman, J. R. Jr. and Sykes, J. M. (2001) The embryology, classification, epidemiology, and genetics of facial clefting.
Facial Plast. Surg. Clin. North. Am. 9, 1–13.
9. Johnston, M. C. and Bronsky, P. T. (1991) Animal models for human craniofacial malformations. J. Craniofac. Genet.
Dev. Biol. 11, 277–291.
10. Johnston, M. C. and Bronsky, P. T. (1995) Prenatal craniofacial development: new insights on normal and abnormal
mechanisms. Crit. Rev. Oral. Biol. Med. 6, 368–422.
11. Noden, D. M. (1975) An analysis of migratory behavior of avian cephalic neural crest cells. Dev. Biol. 42, 106–130.
12. Le Douarin, N. M., Ziller, C., and Couly, G. F. (1993) Patterning of neural crest derivatives in the avian embryo: in
vivo and in vitro studies. Dev. Biol. 159, 24–49.
13. Kontges, G. and Lumsden, A. (1996) Rhombencephalic neural crest segmentation is preserved throughout craniofacial
ontogeny. Development 122, 3229–3242.
346 Conway
14. Francis-West, P., Ladher, R., Barlow, A., and Graveson, A. (1998) Signaling interactions during facial development.
Mech. Dev. 75, 3–28.
15. Sulik, K. K., Cook, C. S., and Webster, W. S. (1988) Teratogens and craniofacial malformations: relationships to cell
death. Development 103, 213–231.
16. Satokata, I. and Maas, R. (1994) Msx1 deficient mice exhibit cleft palate and abnormalities of craniofacial and tooth
development. Nat. Genet. 6, 348–356.
17. Houzelstein, D., Cohen, A., Buckingham, M. E., and Robert, B. (1997) Insertional mutation of the mouse Msx1
homeobox gene by an nlacZ reporter gene. Mech. Dev. 65, 123–133.
18. Proetzel, G., Pawlowski, S. A., Wiles, M. V., Yin, M., Boivin, G. P., Howles, P. N., et al. (1995) Transforming growth
factor-beta 3 is required for secondary palate fusion. Nat. Genet. 11, 409–414.
19. Kaartinen, V., Voncken, J. W., Shuler, C., Warburton, D., Bu, D., Heisterkamp, N., et al. (1995) Abnormal lung devel-
opment and cleft palate in mice lacking TGF-beta 3 indicates defects of epithelial-mesenchymal interaction. Nat.
Genet. 11, 415–421.
20. Kaartinen, V., Cui, X. M., Heisterkamp, N., Groffen, J., and Shuler, C. F. (1997) Transforming growth factor-beta3
regulates transdifferentiation of medial edge epithelium during palatal fusion and associated degradation of the base-
ment membrane. Dev. Dyn. 209, 255–260.
21. Sun, D., Vanderburg, C. R., Odierna, G. S., and Hay, E. D. (1998) TGFbeta3 promotes transformation of chicken palate
medial edge epithelium to mesenchyme in vitro. Development 125, 95–105.
22. Helms, J. A., Kim, C. H., Hu, D., Minkoff, R., Thaller, C., and Eichele, G. (1997) Sonic hedgehog participates in
craniofacial morphogenesis and is down-regulated by teratogenic doses of retinoic acid. Dev. Biol. 187, 25–35.
23. Chiang, C., Litingtung, Y., Lee, E., Young, K. E., Corden, J. L., Westphal, H., et al. (1996) Cyclopia and defective
axial patterning in mice lacking Sonic hedgehog gene function. Nature 383, 407–413.
24. Gruneberg, H. and Truslove, G. M. (1960) Two closely linked genes in the mouse. Gen. Res. 1, 69–90.
25. Soriano, P. (1997) The PDGF alpha receptor is required for neural crest cell development and for normal patterning of
the somites. Development 124, 2691–2700.
26. Beverdam, A., Brouwer, A., Reijnen, M., Korving, J., and Meijlink, F. (2001) Severe nasal clefting and abnormal
embryonic apoptosis in Alx3/Alx4 double mutant mice. Development 128, 3975–3986.
27. Schorle, H., Meier, P., Buchert, M., Jaenisch, R., and Mitchell, P. J. (1996) Transcription factor AP-2 essential for
cranial closure and craniofacial development. Nature 381, 235–238.
28. Nottoli, T., Hagopian-Donaldson, S., Zhang, J., Perkins, A., and Williams, T. (1998) AP-2-null cells disrupt morpho-
genesis of the eye, face, and limbs in chimeric mice. Proc. Natl. Acad. Sci. USA 95, 13714–13719.
29. Davies, A. F., Imaizumi, K., Mirza, G., Stephens, R. S., Kuroki, Y., Matsuno, M., et al. (1998) Further evidence for the
involvement of human chromosome 6p24 in the aetiology of orofacial clefting. J. Med. Genet. 35, 857–861.
30. Conway, S. J., Henderson, D. J., Kirby, M. L., Anderson, R. H., and Copp, A. J. (1997) Development of a lethal
congenital heart defect in the splotch (Pax3) mutant mouse. Cardiovascular Res. 36, 163–173.
31. Dickman, E. D., Rogers, R., and Conway, S. J. (1999) Abnormal skeletogenesis occurs coincident with increased
apoptosis in the Splotch (Sp2H) mutant—putative roles for Pax3 and PDGFR_ in rib patterning. Anat. Rec. 255,
353–361.
32. Henderson, D. J., Conway, S. J., and Copp, A. J. (1999) Rib truncations and fusions in the Sp
2H
mouse reveal a role for
Pax3 in specification of the ventro-lateral and posterior part of the somite. Dev. Bio. 209, 143–158.
33. Magnaghi, P., Roberts, C., Lorain, S., Lipinski, M., and Scambler, P. J. (1998) HIRA, a mammalian homologue of
Saccharomyces cerevisiae transcriptional co-repressors, interacts with Pax3. Nat. Genet. 20, 74–77.
34. Maschhoff, K. L. and Baldwin, H. S. (2000) Molecular determinants of neural crest migration. Am. J. Med. Genet. 97,
280–288.
35. Lindsay, E. A. (2001) Chromosomal microdeletions: dissecting del22q11 syndrome. Nat. Rev. Genet. 2, 858–868.
36. Conway, S. J., Henderson, D. J., and Copp, A. J. (1997) Pax3 is required for cardiac neural crest migration in the mouse:
evidence from the (Sp
2H
) mutant. Development 124, 505–514.
37. Colbert, M. C., Linney, E., and LaMantia, A. S. (1993) Local sources of retinoic acid coincide with retinoid-mediated
transgene activity during embryonic development. Proc. Natl. Acad. Sci. USA 90, 6572–6576.
38. Koushik, S. V., Wang, J., Rogers, R., Moskofidis, D., Lambert, L., Creazzo, T., et al. (2001) Targeted inactivation of
the sodium-calcium exchanger (Ncx1) results in the lack of a heartbeat and abnormal myofibrillar organization. FASEB
J. 15, 1209–1211.
39. Payne, J., Shibasaki, F., and Mercola, M. (1997) Spina bifida occulta in homozygous Patch mouse embryos. Dev. Dyn.
209, 105–116.
40. Wehrle-Haller, B., Morrison-Graham, K., and Weston, J. A. (1996) Ectopic c-kit expression affects the fate of melano-
cyte precursors in Patch mutant embryos. Dev. Biol. 177, 463–474.
41. Greenlee, A. R., Krisher, R. L., and Plotka, E. D. (1998) Rapid sexing of murine preimplantation embryos using a
nested, multiplex polymerase chain reaction (PCR) Mol. Reprod. Dev. 49, 261–267.
42. Mitchell, P. J., Timmons, P. M., Hebert, J. M., Rigby, P. W., and Tjian, R. (1991) Transcription factor AP-2 is expressed
in neural crest cell lineages during mouse embryogenesis. Genes Dev. 5, 105–119.
43. Stoner, C. M. and Gudas, L. J. (1989) Mouse cellular retinoic acid binding protein: cloning, complementary DNA
sequence, and messenger RNA expression during the retinoic acid-induced differentiation of F9 wild type and RA-3–
10 mutant teratocarcinoma cells. Cancer Res. 49, 1497–1504.
44. Kern, M. J., Argao, E. A., Birkenmeier, E. H., Rowe, L. B., and Potter, S. S. (1994) Genomic organization and chromo-
some localization of the murine homeobox gene Pmx. Genomics 19, 334–340.
Pax3 and PDGF-_ Receptor 347
45. Conlon, R. A., Reaume, A. G., and Rossant, J. (1995) Notch1 is required for the coordinate segmentation of somites.
Development 121, 1533–1545.
46. Conway, S. J., Bundy, J., Chen, J., Dickman, E., Rogers, R., and Will, B. M. (2000) Abnormal neural crest stem cell
expansion is responsible for the conotruncal heart defects within the Splotch (Sp
2H
) mouse mutant. Cardiovasc. Res.
47, 314–328.
47. Copp, A. J., Brook, F. A., Estibeiro, J. P., Shum, A. S., and Cockroft, D. L. (1990) The embryonic development of
mammalian neural tube defects. Prog. Neurobiol. 35, 363–403.
48. Sah, V. P., Attardi, L. D., Mulligan, G. J., Williams, B. O., Bronson, R. T., and Jacks, T. (1995) A subset of p53-
deficient embryos exhibit exencephaly. Nat. Genet. 10, 175–180.
49. Asher, J. H. Jr, Harrison, R. W., Morell, R., Carey, M. L., and Friedman, T. B. (1996) Effects of Pax3 modifier genes on
craniofacial morphology, pigmentation, and viability: a murine model of Waardenburg syndrome variation. Genomics
34, 285–298.
50. Gunn, T. M., Juriloff, D. M., and Harris, M. J. (1995) Genetically determined absence of an initiation site of cranial
neural tube closure is causally related to exencephaly in SELH/Bc mouse embryos. Teratology 52, 101–108.
51. Morrison-Graham, K., Schatteman, G. C., Bork, T., Bowen-Pope, D. F., and Weston, J. A. (1992) A PDGF receptor
mutation in the mouse (Patch) perturbs the development of a non-neuronal subset of neural crest-derived cells. Devel-
opment 115, 133–142.
52. Morriss-Kay, G. M. and Sokolova, N. (1996) Embryonic development and pattern formation. FASEB J. 10, 961–968.
53. Lohnes, D., Mark, M., Mendelsohn, C., Dolle, P., Decimo, D., LeMeur, M., et al. (1995) Developmental roles of the
retinoic acid receptors. J. Steroid Biochem. Mol. Biol. 53, 475–486.
54. ten Berge, D., Brouwer, A., Korving, J., Martin, J. F., and Meijlink, F. (1998) Prx1 and Prx2 in skeletogenesis: roles in
the craniofacial region, inner ear and limbs. Development 125, 3831–3842.
348 Conway
Achondroplasia and Hypochondroplasia 349
349
From: The Skeleton: Biochemical, Genetic, and Molecular Interactions in Development and Homeostasis
Edited by: E. J. Massaro and J. M. Rogers © Humana Press Inc., Totowa, NJ
23
Genetics of Achondroplasia and Hypochondroplasia
Giedre Grigelioniene
PHENOTYPE AND GENETIC DEFECTS
Clinical Features
Achondroplasia and hypochondroplasia are relatively common skeletal dysplasias characterized
by disproportionate short stature, rhizomelic shortening of the limbs, and increased head circumfer-
ence. Short stature and body disproportion are usually severe and uniform in achondroplasia, whereas
phenotype in hypochondroplasia varies from severe achondroplasia-like forms to mild shortness and
body disproportion. Mild forms of hypochondroplasia are on clinical grounds difficult to differenti-
ate from idiopathic short stature or normal height at the shorter end of the height spectrum.
Achondroplasia
Achondroplasia has a rather constant phenotype and is easily diagnosed at birth because of the
infant’s short arms and legs, macrocephaly with a relatively small face, depressed nasal bridge, and
frontal bossing. The length at birth is slightly decreased (mean at about <1.7 SDS*), and weight is nor-
mal. The growth failure usually becomes obvious in a few months and the loss of body height is severe
during the first 3 yr of life (Fig. 1; Hertel, N. T., Kaitila, I., and Hagenäs L., manuscript in preparation).
The proximal parts of the limbs are especially affected and the short stature is thus called rhizomelic.
In contrast with extremities, the length of the trunk is affected to a minor extent. Hands and feet are
short and broad because of short metacarpals and phalanges, with the hand having a characteristic
appearance that is often called “trident hand.” Extension and rotation defects of elbows are common.
Muscular hypotonia and ligament laxity are often noticed at birth and later on are associated with
delayed gross motor development. The head is larger than normal usually as the result of true megal-
encephaly, but in some cases it might be combined with hydrocephalus. Intelligence and cognitive
development are normal (1). Thoracolumbar kyphosis is common during the first year of life and is
replaced by lumbar lordosis when the child begins to walk. Bowed tibia (varus deformity) usually
develops during childhood and may require correcting surgery. Narrowing of the foramen magnum
is common and may cause neurological symptoms, for example, sleep apnea during infancy. Spinal
stenosis may cause neurological symptoms during adulthood. Radiological features include (1) large
neurocranium, (2) small slit-shaped foramen magnum, (3) shortened skull base, (4) caudally narrowing
interpedicular distance, (5) short broad pelvis, and (6) short thick long bones and are in detail described
elsewhere (2,3). Final adult height for males is 118–145 cm and for females, 112–136 cm (4).
*Standard deviation score shows the relationship of the analyzed data to the standard population mean. SDS is the
ratio of the difference between body height or segment size of the subject and the 50th percentile value of the popula-
tion standard for same age and sex to the corresponding standard deviation.
350 Grigelioniene
Hypochondroplasia
Hypochondroplasia is a skeletal dysplasia phenotypically similar to but usually milder than achondro-
plasia. Because the phenotypic deviations are mild at birth, this dysplasia is usually diagnosed later
in childhood. Patients with hypochondroplasia are sometimes characterized as having stocky build,
lumbar lordosis, relative macrocephaly with normal facies, genu varum (i.e., bowleg), and short broad
arms and feet. The diagnosis may be confirmed by radiological examination. The features commonly
used for radiological diagnosis of hypochondroplasia are (1) narrowing or unchanged interpedicular
distance in the lumbar spine going caudally from L1 to L5, (2) squared shortened ilia, (3) short broad
femoral neck, (4) shortening of long tubular bones with mild metaphyseal flare, and (5) mild brachydac-
tyly (5). Some of the above described features may be subtle or absent in milder cases of hypochon-
droplasia, especially in young children, rendering diagnostic difficulties. Hypochondroplasia-specific
metacarpophalangeal profile is available and might be important in confirming the diagnosis (5,6).
Body disproportion and short stature is mild in infants and toddlers with hypochondroplasia and usually
becomes more obvious with age (7). Absence or decrease of pubertal growth spurt is thought to be
common in hypochondroplasia (8,9), but data on this issue are sparse. Final adult height for males is
145–165 cm and for females, 133–151 cm (8). It has to be emphasized that no consensus opinion exists
regarding which and how many of the above-described clinical and radiological features must be pres-
Fig. 1. The loss of the body height expressed in standard deviation score (SDS) in achondroplasia during the
first 3 yr of life. The figure is based on 910 measurements from 72 children with achondroplasia and was kindly
provided by Hertel et al. (manuscript in preparation).
Achondroplasia and Hypochondroplasia 351
ent to confirm the diagnosis of hypochondroplasia. Consequently, establishing the diagnosis of hypo-
chondroplasia by radiological and clinical-auxological means might be difficult in milder cases. In
these cases differentiation among hypochondroplasia, idiopathic short stature, and other skeletal dyspla-
sias with mild short stature and body disproportion (e.g., dyschondrosteosis) should be regarded. In some
of these cases, early diagnosis might be possible only on the basis of molecular-genetic examination.
Inheritance
The prevalence of achondroplasia is reported to be 1:10,000–30,000 (10,11), whereas the preva-
lence of hypochondroplasia is unknown, although probably higher than that of achondroplasia. This
could be explained by the phenotypic variability in hypochondroplasia and its overlap with that of
normal short stature. Both achondroplasia and hypochondroplasia are inherited in an autosomal-domi-
nant manner. Most cases of achondroplasia and hypochondroplasia are the result of de novo mutation.
The germ-line frequency of achondroplasia mutation has been estimated to be 5.5–28 × 10
<6
, and the
base where this mutation occurs is considered to be among the most mutable nucleotides in the human
genome (12). This high mutation rate could be partially explained by the fact that it occurs in a con-
text of CpG dinucleotide. The rate of achondroplasia mutation is slightly increasing with paternal age
and has been molecularly confirmed to occur exclusively in the paternal allele (13,14). Gonadal mosaic-
ism has also been reported in a few cases with achondroplasia (15,16). Evidence that hypochondro-
plasia and achondroplasia were allelic disorders was first suggested by the observation of a child who
was born to a hypochondroplastic mother and achondroplastic father (17). This child had clinical and
radiological features that were more severe than in heterozygous achondroplasia or hypochondropla-
sia but milder than in homozygous achondroplasia.
Molecular Genetics
Achondroplasia and hypochondroplasia were mapped to the short arm of chromosome 4 (4p16.3)
in 1994, and mutations in the FGFR3 gene were then rapidly found in both dysplasias (12,18,19). Almost
all achondroplasia cases were found to be caused by C1177A or C1177G transversions (according to
GenBank accession no. M58051), occurring in the first base of the codon 380, which results in a gly-
cine to arginine substitution (Gly380Arg). This mutation is located in the region coding for the trans-
membrane domain of the FGFR3. For hypochondroplasia, C1659A and C1659G transversions in the
third base of the codon 540, converting it from asparagine to lysine codon (Asn540Lys), have been
described in 40–70% of the cases selected for genetical examination (19–25). Other FGFR3 mutations
were later described in a few families with hypochondroplasia. Most of hypochondroplasia muta-
tions are located in the gene region coding for the tyrosine kinase domain of the receptor. The known
mutations in the FGFR3 associated with achondroplasia and hypochondroplasia are summarized in
Table 1 and Fig. 2.
It has to be emphasized that in a significant proportion of cases that on clinical and radiological
grounds are classified as hypochondroplasia mutations have not yet been identified. Genotyping a
few informative pedigrees have excluded the involvement of FGFR3 in hypochondroplasia pheno-
type of these families (6,22,26). Thus, hypochondroplasia is a genetically heterogeneous disorder,
that is, more than one gene is responsible for this skeletal dysplasia. The actual proportion of locus
heterogeneity in hypochondroplasia is difficult to establish because most of the cases are sporadic,
which makes genotyping analysis impossible. Sequencing of the whole FGFR3 gene has been per-
formed only in a few hypochondroplasia cases; thus, some of the yet unidentified mutations still might
be localized in this gene.
Genotype–Phenotype Correlation
Given the uniformity of the achondroplasia phenotype, in both physical appearance and radiographic
features, it is not surprising that almost 100% of the cases are caused by a single mutation, the Gly380Arg
352 Grigelioniene
substitution. In contrast to the uniformity of achondroplasia, hypochondroplasia is characterized by
varying phenotype and genetic heterogeneity. The studies on genotype and phenotype correlation in
hypochondroplasia suggest that patients with the Asn540Lys mutation are more disproportionate,
have a bigger head circumference, and tend to have more of the characteristic radiological features
than those without this mutation (6,22–24). Consequently, the children with the Asn540Lys mutation
Table 1
FGFR3 Mutations in Achondroplasia and Hypochondroplasia
Nucleotide triplets Codon Reference Comments
Achondroplasia
GGC A TGC Gly375Cys (61,62) A couple of cases reported so far.
GGG A CGG Gly380Arg (18) Less common achondroplasia mutation.
GGG A AGG Gly380Arg (18) The most common achondroplasia mutation.
Hypochondroplasia
AAC A ATC Asn328Ile (63) A single family reported.
TC A GTC Ile538Val (64) A single family reported.
AAC A AAA Asn540Lys (19–25)
40–70% of the patients reported in several studies.
AAC A AAG Asn540Lys (20)
AAC A AGC Asn540Ser (65) A single family reported.
AAC A ACC Asn540Thr (66) A single family reported.
AAG A AAT Lys650Asn (43) A single individual reported.
AAG A AAC Lys650Asn (43) Three unrelated probands reported.
AAG A CAG Lys650Gln (43) A single individual reported.
Fig. 2. Mutations responsible for achondroplasia (ACH) and hypochondroplasia (HCH) in the FGFR3 gene
and their corresponding locations in the protein (modified from Bellus et al. [43] ). FGFR3 protein is drawn sche-
matically and the areas of currently known achondroplasia and hypochondroplasia mutations are shown in detail.
tm, transmembrane domain; tk, tyrosine kinase domains; I, II, and III, immunoglobulin-like domains.
Achondroplasia and Hypochondroplasia 353
come to medical attention earlier compared with hypochondroplastic children without this mutation
(24). However, considerable phenotype variability has been observed even among the individuals with
Asn540Lys mutation (23,27). An individual with hypochondroplasia, cloverleaf skull deformity, and
Asn540Lys mutation has been reported, further illustrating the phenotypic heterogeneity in hypochon-
droplasia (28).
MOLECULAR INTERACTIONS AND DEVELOPMENT OF THE GROWTH
PLATE IN ACHONDROPLASIA FAMILY OF SKELETAL DYSPLASIAS
Longitudinal Bone Growth and FGFR3
The template for the longitudinal bone growth is the cartilaginous anlagen of the embryonic bones
and epiphyseal growth plates after the endochondral ossification is established. FGFR3 gene expres-
sion has been found in these structures, indicating its importance for skeletal development (29–31). It
is has been demonstrated that FGF8 and FGF17 act as FGFR3 ligands during embryonic bone devel-
opment, whereas FGF2 and FGF9 are involved in the regulation of the growth plate (32,33).
The structure of the growth plate is briefly described below. The growth plate consists of chon-
drocytes and the extracellular matrix and exhibits spacial polarity. It is divided into four zones: rest-
ing, proliferative, hypertrophic and mineralization (Fig. 3). The chondrocytes occupying different
zones of the growth plate are in different phases of their life cycle. The stem cells of the resting zone
divide and form strictly organized chondrocytic columns in the proliferative zone. The proliferative
chondrocytes then increase their volume and form the hypertrophic zone. The hypertrophic chon-
drocytes mature, stop dividing, and finally undergo a programmed cell death. The extracellular matrix
in the end of the hypertrophy zone is mineralized and invaded by blood vessels and bone forming
osteoblasts (the mineralization zone). The overall rate of longitudinal bone growth is determined by
the progression of the chondrocytes through the aforementioned developmental stages. Thus chondro-
cyte growth, proliferation, and differentiation (chondrogenesis) in the growth plate are tightly coupled
to vascular invasion of the matrix and mineralization (osteogenesis). Many hormones and growth fac-
tors control chondrogenesis and osteogenesis. A delicate balance between proliferation and differen-
tiation of chondrocytes and ossification of the epiphyseal growth cartilage is necessary for normal
Fig. 3. Schematic representation of the epiphyseal growth plate and its cellular organization.
354 Grigelioniene
longitudinal bone growth. FGFR3 is one of the key regulators of the longitudinal bone growth and is
involved in proliferation, differentiation and apoptosis of chondrocytes as well as ossification of the
growth plate. As described below, mutations of the FGFR3 disturb the highly controlled regulation
of the growth plate, which results in growth failure and skeletal dysplasia.
Achondroplasia Family of Skeletal
Dysplasias Result from Activation of the FGFR3
Mutations in the FGFR3 gene have been found in rhizomelic skeletal dysplasia syndromes, includ-
ing achondroplasia, hypochondroplasia, thanatophoric dysplasia, and severe achondroplasia with
developmental delay and acanthosis nigricans (SADDAN) (19,20,34–37). These syndromes are now
grouped into the achondroplasia family of skeletal dysplasias. The transgenic mouse models with inacti-
vated Fgfr3 indicated that the receptor is a negative regulator of bone growth because Fgfr3 knockout
mice have longer bones than the wild-type mice (38,39). The phenotypic differences between skeletal
overgrowth in Fgfr3 knockout mice and short stature in FGFR3-related human skeletal dysplasias strongly
suggested that the mutations responsible for short stature activate the receptor. Indeed, further experi-
ments have demonstrated that FGFR3 activation is responsible for the spectrum of the phenotypes in
achondroplasia family of skeletal dysplasias (40–43). Mutations responsible for different clinical
entities were found to cluster to certain domains of the receptor. For example, mutations in the extra-
celullar domain of the receptor are involved in thanatophoric dysplasia type I, whereas mutations in the
transmembrane domain of the receptor are responsible for achondroplasia. Interestingly, different amino
acid substitutions occurring at the same position can activate the receptor to different levels and the
degree of FGFR3 activation correlates to the severity of the clinical phenotype. The Lys650Asn and
Lys650Gln mutations causing hypochondroplasia occur in the same codon as mutations reported in than-
atophoric dysplasia type II (Lys650Glu) and SADDAN syndrome (Lys650Met). The hypochondropla-
sia mutations Lys650Asn/Gln cause less severe FGFR3 activation than the mutations described in than-
atophoric dysplasia type II and SADDAN (43). Thus, all these studies suggest a correlation between
the degree of receptor activation and severity of skeletal dysplasia.
FGFR3 Activation Is Achieved in Several Ways
The mechanisms by which mutations cause the increased level of signaling through FGFR3 are
partly different. The thanatophoric dysplasia type I mutation, Arg248Cys, and achondroplasia muta-
tion, Gly375Cys, activate FGFR3 by forming a disulfide linked receptor homodimer, which constitu-
tively stimulate the cells in the absence of ligand (41,44). The achondroplasia mutation (Gly380Arg)
has been shown to cause ligand-independent activation of the receptor (40), as well as to increase its
responsiveness to the ligand (42). Mutations in the tyrosine kinase domain (Asn540Lys, Lys650Glu,
and Lys650Met) are thought to affect the intracellular kinetics of the FGFR3. In cells expressing the
mutations of the tyrosine kinase domain the amount of the mature (membrane bound, glycosylated,
p170) FGFR3 receptor form is decreased, whereas the immature (intracellular, unglycosylated, p130)
exhibits abnormally strong ligand-independent tyrosine phosphorylation (42). Furthermore, the mutant
FGFR3 containing the achondroplasia mutations is more resistant to ligand-induced internalization
and downregulation compared with that of the wild type, which results in increased receptor levels at
the plasma membrane (44,45). This mechanism seems to be involved in thanatophoric dysplasia as
well, because increased FGFR3 expression has been observed in the growth plates of thanatophoric
dysplasia fetuses (46).
In summary, the increased signaling through FGFR3 in the achondroplasia family of skeletal dys-
plasias is accomplished in at least three different ways, all resulting in disturbed regulation of the
growth plate: (1) ligand-independent (constitutive) activation; (2) increased receptor responsiveness
to the ligand; and (3) change in the intracellular kinetics of the receptor.
Achondroplasia and Hypochondroplasia 355
Overactivation of the FGFR3 Disturbs
Normal Cell Development in the Growth Plate
Transgenic animal models for achondroplasia and thanatophoric dysplasia and morphological
studies of the growth plates from human thanatophoric dysplasia fetuses have provided some insight
on how the overactivation of FGFR3 affects chondrocyte life cycle in the growth plate. The growth
plates of the transgenic mice with achondroplasia and thanatophoric dysplasia type II mutations were
diminished with significant decrease and disturbed columnar organization of the proliferative zone
and shortening of the hypertrophic zone (44,47–51). Moreover, similarly to human thanatophoric dys-
plasia (46,52), mice with achondroplasia mutation have foci of abnormal vascularization and transverse
tunneling of the growth plate cartilage (51). These findings indicate that activating FGFR3 mutations
decrease chondrogenesis and stimulate osteogenesis. This is further supported by data on increased
expression of genes related to osteoblast differentiation (osteocalcin, osteopontin and osteonectin) in
mice with achondroplasia mutation Gly375Cys (44). Moreover, thanatophoric dysplasia type I muta-
tions have been shown to promote chondrocyte apoptosis (53). Thus, different types of mutations seem
to affect different stages of chondrocyte life cycle when causing disturbed longitudinal bone growth.
Interestingly, developmental differences have been observed in the regulation of chondrocyte pro-
liferation by normal and mutant FGFR3. In contrast with both prenatal and postnatal inhibition of dif-
ferentiation, proliferation of chondrocytes might even be increased prenatally. It was demonstrated that
thanatophoric dysplasia type II mutation in mice (Lys644Glu) enhanced chondrocyte proliferation at
embryonic day 15 but not at embryonic day 18 (50). In vitro studies of chondrocytes from thanato-
phoric dysplasia type I fetuses suggest that at least during fetal development, cell differentiation is
more affected than cell proliferation (53). The presence of two FGFR3 isoforms with different affini-
ties for FGF1 and FGF2 during chondrogenic differentiation (54) further supports the hypothesis that
FGFR3 might have different functions during different developmental stages.
Molecular Pathways Used by Normal and Mutant FGFR3
As presented below, activating FGFR3 mutations responsible for the achondroplasia group of skel-
etal dysplasias involve different signaling pathways. These molecular mechanisms vary not only with
regard to mutation type (and thus specific clinical entity) but also depend on developmental period.
Activation of Cell-Cycle Inhibitors and Disturbance of PTHrP/Ihh Signaling Loop
The transgenic animal models as well as expression of both normal and mutated FGFR3 in cell
lines have been used to highlight intracellular signaling pathways, involved in pathogenesis of the
achondroplasia family of skeletal dysplasias. The Fgfr3 containing achondroplasia and thanatophoric
dysplasia mutations activates STAT1, 5a and 5b (signal transducers and activators of transcription
responsible for antiproliferative effects), and ink4 family cell cycle inhibitors and in this way decreases
cell proliferation (44,48,55).
Several studies suggest that parathyroid hormone-related protein and Indian hedgehog (PTHrP/
Ihh) signaling loop, a major coordinator of the growth plate, is also affected by mutations causing the
achondroplasia family of skeletal dysplasias. Sox9 is a target of PTHrP signaling (56,57), and both
normal and mutant FGFR3 stimulate expression of the transcription factor Sox9 (58). Sox9 is neces-
sary for differentiation of mesenchyme cells to chondrocytes and subsequently for arresting the tran-
sition of chondrocytes from the proliferative to the hypertrophic stage (56,57). Thus, an increased
expression of Sox9 in the achondroplasia family of skeletal dysplasias may contribute to decreased
hypertrophy of growth plate chondrocytes. Moreover, the signaling pathways for induction of Sox9 and
activation of the cell cycle inhibitor STAT1 seem to be independent of each other (58), indicating that
several intracellular pathways are involved in the pathogenesis of the achondroplasia family of skeletal
dysplasias. In addition, Fgfr3 signaling downregulates the expression of Ihh and bone morphogenetic
356 Grigelioniene
protein 4 in transgenic mice with achondroplasia mutation (47). Ihh is known to be impor-tant for the
chondrocyte proliferation and their longitudinal stacking in the proliferative zone (59), whereas bone
morphogenetic protein 4 might serve as a link coordinating chondrogenesis and osteogenesis in the
growth plate.
The above-described activation of the cell cycle inhibitors and downregulation of Ihh contribute
to decreased proliferation and affected columnar organization of the chondrocytes, whereas increased
expression of Sox9 probably confer decreased hypertrophy of the cells. All these molecular processes
explain the morphological changes of the growth plates in human thanatophoric dysplasia as well as
in the transgenic models of achondroplasia and thanatophoric dysplasia. Interestingly, neither altered
expression of Ihh nor STAT protein activation has been found in prenatal mice with thanatophoric
dysplasia II mutation, suggesting that different molecular pathways are important for bone growth
during different developmental stages (50).
Activation of MAPK Pathway,
Altered Integrin Expression, and Triggering of Apoptosis
One of the important signaling molecules in the tyrosine kinase pathway is mitogen-activated pro-
tein kinase. This molecule is activated in a ligand-dependent manner in achondroplasia, hypochondro-
Fig. 4. A schematic summary of cellular and molecular mechanisms involved in the disturbance of bone growth
in the achondroplasia family of skeletal dysplasias. Cell cycle progression is regulated by assembly of cyclins,
cyclin-dependent kinases (cdk), and cdk inhibitors with subsequent regulation of retinoblastoma protein, pRb. Cells,
in this case chondrocytes, are kept in growth arrest by active pRb. pRb can be phosphorylated and by cyclin com-
plex E-cdk2/D-cdk4, which leads to inactivation. Cdks are blocked by so called cell cycle inhibitors, among which
p21 has a broad spectrum, whereas ink4 has a narrow spectrum (inhibits only D-cdk4 and D-cdk6). The increased
expression of p21 blocks the E-cdk2, which in turn cannot phosphorylate (inactivate) pRb. The active pRb does
not allow the cell to enter S-phase. Ihh stimulates chondrocyte proliferation and regulates their longitudinal stack-
ing in the proliferative zone, thus a decreased amount of this factor may cause disorganization of the cellular struc-
ture in the growth plate. The regulation of apoptosis involves Bax and Bcl-2 proteins. Bax is a proapoptotic protein,
whereas Bcl-2 is an antiapoptotic protein. STATs are also involved in the inhibition of proliferation and in the acti-
vation of apoptosis. Integrins provide a link between the extracellular matrix and the cytoskeleton, functioning as
important transducers of mechanical stimuli. Integrin binding stimulates intracellular signaling, which can affect
gene expression and regulate chondrocyte function. Thus, changes in integrin expression pattern might affect
cell-matrix interactions and integrin-related signaling pathways.
Achondroplasia and Hypochondroplasia 357
plasia, and thanatophoric dysplasia (42,53). In contrast to mitogen-activated protein kinase signal-
ing, STAT1 signaling pathway is activated in a ligand-independent manner in thanatophoric dyspla-
sia type I (53). The latter is likely involved in triggering premature apoptosis of the growth plate
chon-drocytes by decreasing Bcl-2 levels (53).
Another mechanism involved in the pathogenesis of the achondroplasia is disturbed cell–matrix
interaction because chondrocytes containing FGFR3 with achondroplasia mutation change the pat-
tern of integrin expression (60). Integrins function as a link between the extracellular matrix and the
cytoskeleton and can transduce signals into the cells. Consequently, changes in integrin expression
affect not only chondrocyte interaction with the surrounding extracellular matrix but also integrin
signaling into the cell. Celullar and molecular mechanisms involved in the pathogenesis of the achon-
droplasia family of skeletal dysplasias are summarized in Fig. 4.
ACKNOWLEDGMENTS
This work has been supported by Foundation of Society for Children Care. Associated Prof. Lars
Hagenäs and Dr. Thomas Hertel are gratefully acknowledged for revision of this manuscript.
REFERENCES
1. Hecht, J. T., Thompson, N. M., Weir, T., Patchell, L., and Horton, W. A. (1991) Cognitive and motor skills in achon-
droplastic infants: neurologic and respiratory correlates. Am. J. Med. Genet. 41, 208–211.
2. Langer, L. O., Jr., Baumann, P. A., and Gorlin, R. J. (1967) Achondroplasia. Am. J. Roentgenol. Radium Ther. Nucl.
Med. 100, 12–26.
3. Scott, C. I. Jr. (1976) Achondroplastic and hypochondroplastic dwarfism. Clin. Orthop. Jan./Feb., 18–30.
4. Horton, W. A., Rotter, J. I., Kaitila, I., et al. (1977) Growth curves in achondroplasia. Birth Defects Orig. Artic. Ser. 13,
101–107.
5. Hall, B. D. and Spranger, J. (1979) Hypochondroplasia: clinical and radiological aspects in 39 cases. Radiology 133,
95–100.
6. Grigelioniene, G., Eklof, O., Laurencikas, E., Ollars, B., Hertel, N. T., Dumanski, J. P., and Hagenas, L. (2000)
Asn540Lys mutation in fibroblast growth factor receptor 3 and phenotype in hypochondroplasia. Acta Paediatr. 89,
1072–1076.
7. Brook, C. G. and de Vries, B. B. (1998) Skeletal dysplasias. Arch. Dis. Child. 79, 285–289.
8. Appan, S., Laurent, S., Chapman, M., Hindmarsh, P. C., and Brook, C. G. (1990) Growth and growth hormone therapy
in hypochondroplasia. Acta Paediatr. Scand. 79, 796–803.
9. Bridges, N. A., Hindmarsh, P. C., and Brook, C. G. (1991) Growth of children with hypochondroplasia treated with
growth hormone for up to three years. Horm. Res. 36, 56–60.
10. Orioli, I. M., Castilla, E. E., and Barbosa-Neto, J. G. (1986) The birth prevalence rates for the skeletal dysplasias. J.
Med. Genet. 23, 328–332.
11. Martinez-Frias, M. L., Cereijo, A., Bermejo, E., Lopez, M., Sanchez, M., and Gonzalo, C. (1991) Epidemiological
aspects of Mendelian syndromes in a Spanish population sample: I. Autosomal dominant malformation syndromes.
Am. J. Med. Genet. 38, 622–625.
12. Bellus, G. A., Hefferon, T. W., Ortiz de Luna, R. I., Hecht, J. T., Horton, W. A., Machado, M., et al. (1995) Achondro-
plasia is defined by recurrent G380R mutations of FGFR3. Am. J. Hum. Genet. 56, 368–373.
13. Stoll, C., Roth, M. P., and Bigel, P. (1982) A reexamination on parental age effect on the occurrence of new mutations
for achondroplasia. Prog. Clin. Biol. Res. 104, 419–426.
14. Wilkin, D. J., Szabo, J. K., Cameron, R., Henderson, S., Bellus, G. A., Mack, M. L., et al. (1998) Mutations in fibro-
blast growth-factor receptor 3 in sporadic cases of achondroplasia occur exclusively on the paternally derived chromo-
some. Am. J. Hum. Genet. 63, 711–716.
15. Bowen, P. (1974) Achondroplasia in two sisters with normal parents. Birth Defects Orig. Artic. Ser. 10, 31–36.
16. Henderson, S., Sillence, D., Loughlin, J., Bennetts, B., and Sykes, B. (2000) Germline and somatic mosaicism in
achondroplasia. J. Med. Genet. 37, 956–958.
17. McKusick, V. A., Kelly, T. E., and Dorst, J. P. (1973) Observations suggesting allelism of the achondroplasia and
hypochondroplasia genes. J. Med. Genet. 10, 11–16.
18. Shiang, R., Thompson, L. M., Zhu, Y. Z., Church, D. M., Fielder, T. J., Bocian, M., et al. (1994) Mutations in the trans-
membrane domain of FGFR3 cause the most common genetic form of dwarfism, achondroplasia. Cell 78, 335–342.
19. Bellus, G. A., McIntosh, I., Smith, E. A., Aylsworth, A. S., Kaitila, I., Horton, W. A., et al. (1995) A recurrent mutation
in the tyrosine kinase domain of fibroblast growth factor receptor 3 causes hypochondroplasia. Nat. Genet. 10, 357–359.
20. Prinos, P., Costa, T., Sommer, A., Kilpatrick, M. W., and Tsipouras, P. (1995) A common FGFR3 gene mutation in
hypochondroplasia. Hum. Mol. Genet. 4, 2097–2101.
358 Grigelioniene
21. Bonaventure, J., Rousseau, F., Legeai-Mallet, L., Le Merrer, M., Munnich, A., and Maroteaux, P. (1996) Common
mutations in the fibroblast growth factor receptor 3 (FGFR 3) gene account for achondroplasia, hypochondroplasia,
and thanatophoric dwarfism. Am. J. Med. Genet. 63, 148–154.
22. Rousseau, F., Bonaventure, J., Legeai-Mallet, L., Schmidt, H., Weissenbach, J., Maroteaux, P., et al. (1996) Clinical
and genetic heterogeneity of hypochondroplasia. J. Med. Genet. 33, 749–752.
23. Prinster, C., Carrera, P., Del Maschio, M., Weber, G., Maghnie, M., Vigone, M. C., et al. (1998) Comparison of
clinical-radiological and molecular findings in hypochondroplasia. Am. J. Med. Genet. 75, 109–112.
24. Ramaswami, U., Rumsby, G., Hindmarsh, P. C., and Brook, C. G. (1998) Genotype and phenotype in hypochondro-
plasia. J. Pediatr. 133, 99–102.
25. Tsai, F. J., Wu, J. Y., Tsai, C. H., and Chang, J. G. (1999) Identification of a common N540K mutation in 8/18 Taiwan-
ese hypochondroplasia patients: further evidence for genetic heterogeneity. Clin. Genet. 55, 279–280.
26. Stoilov, I., Kilpatrick, M. W., Tsipouras, P., and Costa, T. (1995) Possible genetic heterogeneity in hypochondroplasia.
J. Med. Genet. 32, 492–493.
27. Prinster, C., Del Maschio, M., Beluffi, G., Maghnie, M., Weber, G., Del Maschio, A., et al. (2001) Diagnosis of
hypochondroplasia: the role of radiological interpretation. Italian Study Group for Hypochondroplasia. Pediatr. Radiol.
31, 203–208.
28. Angle, B., Hersh, J. H., and Christensen, K. M. (1998) Molecularly proven hypochondroplasia with cloverleaf skull defor-
mity: a novel association. Clin. Genet. 54, 417–420.
29. Wuechner, C., Nordqvist, A. C., Winterpacht, A., Zabel, B., and Schalling, M. (1996) Developmental expression of
splicing variants of fibroblast growth factor receptor 3 (FGFR3) in mouse. Int. J. Dev. Biol. 40, 1185–1188.
30. Peters, K., Ornitz, D., Werner, S., and Williams, L. (1993) Unique expression pattern of the FGF receptor 3 gene during
mouse organogenesis. Dev. Biol. 155, 423–430.
31. Delezoide, A. L., Benoist-Lasselin, C., Legeai-Mallet, L., Le Merrer, M., Munnich, A., Vekemans, M., et al. (1998)
Spatio-temporal expression of FGFR 1, 2 and 3 genes during human embryo- fetal ossification. Mech. Dev. 77, 19–30.
32. Ornitz, D. (2000) Fibroblast Growth Factors, Chondrogenesis, and Related Clinical Disorders, in Skeletal Growth
Factors (Canalis, E., ed.). Lippincott Williams and Wilkins, Philadelphia, pp. 197–209.
33. Weksler, N. B., Lunstrum, G. P., Reid, E. S., and Horton, W. A. (1999) Differential effects of fibroblast growth factor
(FGF) 9 and FGF2 on proliferation, differentiation and terminal differentiation of chondrocytic cells in vitro. Biochem.
J. 342, 677–682.
34. Tavormina, P. L., Shiang, R., Thompson, L. M., Zhu, Y. Z., Wilkin, D. J., Lachman, R. S., et al. (1995) Thanatophoric
dysplasia (types I and II) caused by distinct mutations in fibroblast growth factor receptor 3. Nat. Genet. 9, 321–328.
35. Burke, D., Wilkes, D., Blundell, T. L., and Malcolm, S. (1998) Fibroblast growth factor receptors: lessons from the
genes. Trends Biochem. Sci. 23, 59–62.
36. Bellus, G. A., Bamshad, M. J., Przylepa, K. A., Dorst, J., Lee, R. R., Hurko, O., et al. (1999) Severe achondroplasia
with developmental delay and acanthosis nigricans (SADDAN): phenotypic analysis of a new skeletal dysplasia caused
by a Lys650Met mutation in fibroblast growth factor receptor 3. Am. J. Med. Genet. 85, 53–65.
37. Vajo, Z., Francomano, C. A., and Wilkin, D. J. (2000) The molecular and genetic basis of fibroblast growth factor
receptor 3 disorders: the achondroplasia family of skeletal dysplasias, Muenke craniosynostosis, and Crouzon syn-
drome with acanthosis nigricans. Endocr. Rev. 21, 23–39.
38. Colvin, J. S., Bohne, B. A., Harding, G. W., McEwen, D. G., and Ornitz, D. M. (1996) Skeletal overgrowth and deaf-
ness in mice lacking fibroblast growth factor receptor 3. Nat. Genet. 12, 390–397.
39. Deng, C., Wynshaw-Boris, A., Zhou, F., Kuo, A., and Leder, P. (1996) Fibroblast growth factor receptor 3 is a negative
regulator of bone growth. Cell 84, 911–921.
40. Webster, M. K. and Donoghue, D. J. (1996) Constitutive activation of fibroblast growth factor receptor 3 by the trans-
membrane domain point mutation found in achondroplasia. EMBO J. 15, 520–527.
41. Naski, M. C., Wang, Q., Xu, J., and Ornitz, D. M. (1996) Graded activation of fibroblast growth factor receptor 3 by
mutations causing achondroplasia and thanatophoric dysplasia. Nat. Genet. 13, 233–237.
42. Raffioni, S., Zhu, Y. Z., Bradshaw, R. A., and Thompson, L. M. (1998) Effect of transmembrane and kinase domain
mutations on fibroblast growth factor receptor 3 chimera signaling in PC12 cells. A model for the control of receptor
tyrosine kinase activation. J. Biol. Chem. 273, 35250–35259.
43. Bellus, G. A., Spector, E. B., Speiser, P. W., Weaver, C. A., Garber, A. T., Bryke, C. R., et al. (2000) Distinct missense
mutations of the FGFR3 lys650 codon modulate receptor kinase activation and the severity of the skeletal dysplasia
phenotype. Am. J. Hum. Genet. 67, 1411–1421.
44. Chen, L., Adar, R., Yang, X., Monsonego, E. O., Li, C., Hauschka, P. V., et al. (1999) Gly369Cys mutation in mouse
FGFR3 causes achondroplasia by affecting both chondrogenesis and osteogenesis. J. Clin. Invest. 104, 1517–1525.
45. Monsonego-Ornan, E., Adar, R., Feferman, T., Segev, O., and Yayon, A. (2000) The transmembrane mutation G380R
in fibroblast growth factor receptor 3 uncouples ligand-mediated receptor activation from down-regulation. Mol. Cell.
Biol. 20, 516–522.
46. Delezoide, A. L., Lasselin-Benoist, C., Legeai-Mallet, L., Brice, P., Senee, V., Yayon, A., et al. (1997) Abnormal
FGFR 3 expression in cartilage of thanatophoric dysplasia fetuses. Hum. Mol. Genet. 6, 1899–1906.
47. Naski, M. C., Colvin, J. S., Coffin, J. D., and Ornitz, D. M. (1998) Repression of hedgehog signaling and BMP4
expression in growth plate cartilage by fibroblast growth factor receptor 3. Development 125, 4977–4988.
48. Li, C., Chen, L., Iwata, T., Kitagawa, M., Fu, X. Y., and Deng, C. X. (1999) A Lys644Glu substitution in fibroblast
growth factor receptor 3 (FGFR3) causes dwarfism in mice by activation of STATs and ink4 cell cycle inhibitors. Hum.
Mol. Genet. 8, 35–44.
Achondroplasia and Hypochondroplasia 359
49. Wang, Y., Spatz, M. K., Kannan, K., Hayk, H., Avivi, A., Gorivodsky, M., et al. (1999) A mouse model for achondro-
plasia produced by targeting fibroblast growth factor receptor 3. Proc. Natl. Acad. Sci. USA 96, 4455–4460.
50. Iwata, T., Chen, L., Li, C., Ovchinnikov, D. A., Behringer, R. R., Francomano, C. A., et al. (2000) A neonatal lethal
mutation in FGFR3 uncouples proliferation and differentiation of growth plate chondrocytes in embryos. Hum. Mol.
Genet. 9, 1603–1613.
51. Segev, O., Chumakov, I., Nevo, Z., Givol, D., Madar-Shapiro, L., Sheinin, Y., et al. (2000) Restrained chondrocyte
proliferation and maturation with abnormal growth plate vascularization and ossification in human FGFR-3(G380R)
transgenic mice. Hum. Mol. Genet. 9, 249–258.
52. Rimoin, D. L. (1975) The chondrodystrophies. Adv. Hum. Genet. 5, 1–118.
53. Legeai-Mallet, L., Benoist-Lasselin, C., Delezoide, A. L., Munnich, A., and Bonaventure, J. (1998) Fibroblast growth
factor receptor 3 mutations promote apoptosis but do not alter chondrocyte proliferation in thanatophoric dysplasia. J.
Biol. Chem. 273, 13007–13014.
54. Shimizu, A., Tada, K., Shukunami, C., Hiraki, Y., Kurokawa, T., Magane, N., and Kurokawa-Seo, M. (2001) A novel
alternatively spliced fibroblast growth factor receptor 3 isoform lacking the acid box domain is expressed during chon-
drogenic differentiation of ATDC5 cells. J. Biol. Chem. 276, 11031–11040.
55. Su, W. C., Kitagawa, M., Xue, N., Xie, B., Garofalo, S., Cho, J., et al. (1997) Activation of Stat1 by mutant fibroblast
growth-factor receptor in thanatophoric dysplasia type II dwarfism. Nature 386, 288–292.
56. Bi, W., Deng, J. M., Zhang, Z., Behringer, R. R., and de Crombrugghe, B. (1999) Sox9 is required for cartilage forma-
tion. Nat. Genet. 22, 85–89.
57. Huang, W., Chung, U. I., Kronenberg, H. M., and de Crombrugghe, B. (2001) The chondrogenic transcription factor
Sox9 is a target of signaling by the parathyroid hormone-related peptide in the growth plate of endochondral bones.
Proc. Natl. Acad. Sci. USA 98, 160–165.
58. Murakami, S., Kan, M., McKeehan, W. L., and de Crombrugghe, B. (2000) Up-regulation of the chondrogenic Sox9
gene by fibroblast growth factors is mediated by the mitogen-activated protein kinase pathway. Proc. Natl. Acad. Sci.
USA 97, 1113–1118.
59. Karp, S. J., Schipani, E., St-Jacques, B., Hunzelman, J., Kronenberg, H., and McMahon, A. P. (2000) Indian hedgehog
coordinates endochondral bone growth and morphogenesis via parathyroid hormone related-protein-dependent and
-independent pathways. Development 127, 543–548.
60. Henderson, J. E., Naski, M. C., Aarts, M. M., Wang, D., Cheng, L., Goltzman, D., and Ornitz, D. M. (2000) Expression
of FGFR3 with the G380R achondroplasia mutation inhibits proliferation and maturation of CFK2 chondrocytic cells.
J. Bone Miner. Res. 15, 155–165.
61. Ikegawa, S., Fukushima, Y., Isomura, M., Takada, F., and Nakamura, Y. (1995) Mutations of the fibroblast growth
factor receptor-3 gene in one familial and six sporadic cases of achondroplasia in Japanese patients. Hum. Genet. 96,
309–311.
62. Superti-Furga, A., Eich, G., Bucher, H. U., Wisser, J., Giedion, A., Gitzelmann, R., et al. (1995) A glycine 375-to-
cysteine substitution in the transmembrane domain of the fibroblast growth factor receptor-3 in a newborn with achon-
droplasia. Eur. J. Pediatr. 154, 215–219.
63. Winterpacht, A., Hilbert, K., Stelzer, C., Schweikardt, T., Decker, H., Segerer, H., et al. (2000) A novel mutation in
FGFR-3 disrupts a putative N-glycosylation site and results in hypochondroplasia. Physiol. Genomics 2, 9–12.
64. Grigelioniene, G., Hagenas, L., Eklof, O., Neumeyer, L., Haereid, P. E., and Anvret, M. (1998) A novel missense
mutation Ile538Val in the fibroblast growth factor receptor 3 in hypochondroplasia. Mutations in brief no. 122. Online.
Hum. Mutat. 11, 333.
65. Mortier, G., Nuytinck, L., Craen, M., Renard, J. P., Leroy, J. G., and de Paepe, A. (2000) Clinical and radiographic fea-
tures of a family with hypochondroplasia owing to a novel Asn540Ser mutation in the fibroblast growth factor receptor
3 gene. J. Med. Genet. 37, 220–224.
66. Deutz-Terlouw, P. P., Losekoot, M., Aalfs, C. M., Hennekam, R. C., and Bakker, E. (1998) Asn540Thr substitution
in the fibroblast growth factor receptor 3 tyrosine kinase domain causing hypochondroplasia. Hum. Mutat. Suppl 1,
S62–S65.
360 Grigelioniene
Boric Acid Effects on Axial Skeleton 361
361
From: The Skeleton: Biochemical, Genetic, and Molecular Interactions in Development and Homeostasis
Edited by: E. J. Massaro and J. M. Rogers © Humana Press Inc., Totowa, NJ
24
Effects of Boric Acid on Hox Gene Expression
and the Axial Skeleton in the Developing Rat*
Michael G. Narotsky, Nathalie Wéry,
Bonnie T. Hamby, Deborah S. Best, Nathalie Pacico,
Jacques J. Picard, Françoise Gofflot, and Robert J. Kavlock
INTRODUCTION
The adult axial skeleton consists of the skull, ribs, and vertebrae. Based on their morphology, the
vertebrae can be divided into five distinct regions, that is, the cervical (C), thoracic (T), lumbar (L),
sacral (S), and caudal vertebrae. The number of vertebrae in each region varies across species within
the vertebrate phylum. In humans, the vertebral column normally consists of 7C, 12T, 5L, 5S, and
four or five caudal vertebrae, whereas rodents have 7C, 13T, 6L, 4S and varying numbers of caudal
vertebrae.
During embryonic development, positional information determining the craniocaudal identity of
the somites, the precursors to the vertebrae, is thought to be conferred by the hox genes. They encode
transcriptional regulators containing a homeodomain that mediates sequence-specific DNA binding.
These genes are clustered in four genomic loci, the HoxA, -B, -C, and -D complexes. Hox expression
in the paraxial mesoderm begins early, during gastrulation, before the formation of the somites. Hox
genes have overlapping domains of expression in the somites and prevertebrae (PV) that extend from
the caudal end of the embryo to a precise cranial limit that is correlated to the linear order of the genes
within a given cluster. This expression pattern along the craniocaudal axis of the embryo suggests a
combinatorial code according to which the expression of a given combination of hox genes will spe-
cify the identity of a vertebral segment (1–3).
Several agents have been reported to induce anomalies of the axial skeleton that resemble homeotic
transformations, that is, they induce the transformation of the anatomical structure of a vertebra to
that of an adjacent vertebra, thus leading to altered numbers of vertebrae or ribs. Boric acid (BA), an
essential plant micronutrient, is widely used industrially (cosmetics, pharmaceuticals, pesticides, glaz-
ing, ceramics) and widely distributed. Prenatal exposure to BA has been shown to cause reductions in
the number of ribs in rodents (4–8) as well as induce a missing cervical vertebra (7) with associated
*This document has been reviewed in accordance with the U.S. Environmental Protection Agency policy and
approved for publication. Mention of trade names or commercial products does not constitute endorsement or recom-
mendation for use.
362 Narotsky et al.
changes in hox gene expression (9). Although many agents, for example, valproic acid (10), retinoic
acid (11), salicylate (12), and acetazolamide (13), have been shown to cause supernumerary ribs in
rodents, very few agents cause a reduction in the number of ribs or vertebrae. In addition to BA, agents
or conditions in the latter category include arsenate (14), methanol (15), and hyperthermia (16). This
unusual effect on axial development has also been associated with changes in homeotic gene expres-
sion (17–19) as well as deletion of the bmi-1 proto-oncogene (20). In this study, we describe BA-
induced homeotic shifts by characterizing the morphological changes in the axial skeleton of rats after
prenatal exposure to BA and also report the changes in hox gene expression associated with BA expo-
sure shown to alter cervical vertebral development.
MATERIALS AND METHODS
Chemicals
BA (H
3
BO
3
; Lot no. 83H0843) was purchased from Sigma Chemical Co.; purity was reported to
be approx 99%. Dosing solutions were prepared in double-distilled deionized water at appropriate
concentrations to provide the desired dose (0 or 500 mg/kg) when given at 10 mL/kg.
Animals and Husbandry
For assessment of effects on full-term morphology, timed-pregnant Sprague–Dawley rats were
obtained from Charles River, Inc. and individually housed. For assessment of gene expression, male
and female Sprague–Dawley rats (Charles River, Inc.) were cohabited overnight and mated females
were housed two per cage. All animals were maintained in polycarbonate cages with heat-treated
wood shavings supplied as bedding. The day that evidence of mating (i.e., copulatory plug or vaginal
sperm) was detected was designated gestation day (GD) 0. The animals were provided feed (Purina
Lab Chow no. 5001) and tap water ad libitum, and a 12:12 light:dark cycle (lights on at 0600). Room
temperature and relative humidity were maintained at 22.2 ± 1.1°C and 50 ± 10%, respectively.
Experimental Design
Animals were assigned to treatment groups using a nonbiased procedure that assured a homoge-
neous distribution of body weights among groups (21).
Full-Term Morphology
BA was administered at 0 or 500 mg/kg twice daily (b.i.d.; approx 0700 and 1600 h). This experi-
ment was conducted in two blocks. In the first block, rats were dosed with BA on GD 6, 7, 8, or 9;
controls received vehicle on GD 6–9. In the second block, rats were dosed on GD 9, 10, or 11; con-
trols received vehicle on GD 9–11. Individual doses were based on GD 6 body weights. Animals were
weighed on GD 6–10, 13, 16, and 21. All rats were examined throughout the experimental period for
clinical signs of toxicity.
On GD 21, dams were killed by cervical dislocation, and the liver, kidneys, and gravid uterus were
weighed. Uterine implantation sites were counted and their relative positions were recorded. Each
implantation site was classified as a live fetus, dead fetus, or resorption. Each resorption site was
further classified as a macerated fetus, placenta (with no recognizable fetus), metrial gland (with no
placenta), or scar. Ovaries from live-bearing dams were examined and corpora lutea were counted.
Live fetuses were weighed individually, fixed in 95% ethanol, and subsequently double stained with
Alizarin red S and Alcian blue (22) for skeletal examination. Nongravid uteri were stained with 10%
ammonium sulfide to detect cases of full-litter resorption (21).
Skeletal examinations included evaluation of vertebral, costal, and skull morphology. Each side of
the specimen was evaluated independently. The pattern of costal cartilage attachment to the sternum
and the number of presacral vertebrae were recorded. The first thoracic vertebra (T1) was defined as
the most cephalad vertebra bearing a rib with a prominent costal cartilage. At the thoracolumbar junc-
Boric Acid Effects on Axial Skeleton 363
tion, all rib-bearing vertebrae were designated as thoracic, regardless of the length of the rib. The num-
ber of C, T, and L vertebrae were recorded for each side. Vertebrae in each region were further classi-
fied into subregions (normally represented by C1, C2, C3–5, C6, C7, T1, T2, T3–10, T11, T12–13,
L1–3, and L4–6; ref. 22). The morphological criteria for each subregion are presented in Table 1; the
cervical region of normal and abnormal specimens are pictured in Fig. 1. Because variations in the size
of the cartilaginous area on the lateral aspects of C3, C7, and T1 were observed in the first block, the
extent of the lateral cartilaginous aspect was scored from zero (normal for T1) to four (cartilage span-
ning the width of the arch, normal for C3 and C7) for the specimens of the second block.
STATISTICS
Females who died or had only one uterine implantation site were excluded from statistical analy-
ses. The litter was used as the statistical unit for the analysis of data regarding corpora lutea, implan-
tation sites, prenatal loss, fetal weights, and fetal examination findings. Maternal body weights and
litter data were analyzed using the General Linear Models procedure in SAS software versions 6.04
and 6.12. Because data from GD-9 exposure and controls were collected in two blocks, data were com-
pared across blocks using General Linear Models. Except for the incidence of fetuses with <6 sterne-
brae (observed only in the second block), all developmental end points were comparable between
blocks. Thus, data from the two blocks were combined. Fetal weights were analyzed with the number
of live fetuses as a covariate. Similarly, the number of implantation sites was used as a covariate in
the analysis of litter size. When a significant treatment effect was detected by analysis of variance,
Student’s t-test on least-squares means was used for pairwise comparisons between groups. No adjust-
ments were made for multiple comparisons. For vertebral-count distributions, inferential statistical
analyses were not conducted; instead, descriptive statistics were calculated for each side based on the
numbers of fetuses, not litters, in each group.
Hox Gene Expression
Pregnant rats were treated by gavage with BA at 0 or 500 mg/kg, b.i.d. (approx 0900 and 1800 h)
on GD 9. Females were killed by cervical dislocation on GD 13.5 and embryos were recovered in
Table 1
Key Morphological Criteria Used in Assessing Vertebral Regions on GD 21
Normal no.
Vertebral region of vertebrae Key features
Cervical 7
C1 (atlas) 1 Large arch, wide transverse process
C2 (axis) 1 Large arch, spinous process
C3-C5 3 Lateral cartilage
C6 1 Tuberculum anterium, lateral cartilage
C7 1 Lateral cartilage
Thoracic 13
T1 1 Cranial-most with rib and costal cartilage, rostrad diapophysis
T2 1 Prominent spinous process, rostrad diapophysis
T3-T10 8 High ossified arch, lateral cartilage
T11 1Blunted ossified arch, reduced lateral cartilage
T12-T13 2 Virtually no lateral cartilage
Lumbar 6
L1-L3 3 Reduced/absent pleurapophysis
L4-L6 3 Pleurapophysis projecting cephalad
364 Narotsky et al.
phosphate-buffered saline (PBS) from one control and two BA-treated dams. The embryos were dis-
sected from the decidua and membranes and fixed in 4% paraformaldehyde in PBS (pH 7.4) overnight
at 4°C. Embryos were washed in PBS and stored in 70% ethanol at room temperature.
IN SITU HYBRIDIZATION (ISH)
Embryos were dehydrated in a graded series of ethanol, cleared in benzene, and embedded in paraf-
fin by standard methods. Approximately 350 serial sagittal 6-µm sections were distributed into seven
groups. The first group was stained with toluidine blue, and the remaining slides were each hybrid-
ized with a different probe (approx 50 sections/probe/embryo), thus allowing direct comparisons of
expression domains of the different genes on neighboring sections of the same embryo (23). Although
all embryos were hybridized with the five or six probes, the number of embryos analyzed for each probe
Fig. 1. Top, Control fetal skeleton with forelegs disarticulated to show cervical vertebral subregions: C1 (atlas),
C2 (axis), C3–C5, C6 (with tuberculum anterium; arrow), and C7. The spinous process of T2 is also indicated
(arrowhead). Bottom, Fetus exposed to boric acid (500 mg/kg b.i.d.) on GD 9. The C3–C5 subregion (bracket)
has only two vertebrae rather than the normal complement of three. The C1, C2, “C6” (the fifth vertebra, with
tuberculum anterium, arrow), and “C7” (the sixth vertebra) subregions are intact. The spinous process of T2 is
also indicated (arrowhead).
Boric Acid Effects on Axial Skeleton 365
Table 2
Summary of Uterine Findings (Mean ± SE) at GD 21 Cesarean Section
No. of Implantation Postimplantation Fetal
dams sites Live fetuses loss (%) weight (g)
Control 15 12.8 ± 0.4 12.3 ± 0.5 4.6 ± 1.9 5.5 ± 0.1
GD 6 11 13.1 ± 0.5 12.4 ± 0.5 4.6 ± 2.1 5.5 ± 0.1
GD 7 11 13.7 ± 0.4 12.7 ± 0.5 7.5 ± 2.1 5.1 ± 0.1
a
GD 8 13 13.2 ± 0.6 12.2 ± 0.7 7.5 ± 2.6 5.3 ± 0.1
GD 9 15 13.4 ± 0.3 12.5 ± 0.5 8.2 ± 2.5 5.0 ± 0.1
b
GD 10 10 13.1 ± 0.4 12.1 ± 0.6 7.8 ± 3.3 4.8 ± 0.0
c
GD 11 10 12.4 ± 0.7 11.1 ± 1.0 12.3 ± 5.6 4.8 ± 0.2
a
a
Significantly different from control value (p < 0.05).
b
Significantly different from control value (p < 0.01).
c
Significantly different from control value (p < 0.001).
varied because of processing artifacts on some slides; a minimum of nine embryos were observed for
each probe. Analysis was restricted to the expression domain in the PV (the sclerotomal derivatives
of the somite).
ISH was performed as described by Duboule and Dolle (24) and reviewed by Picard et al. (23).
The single-strand antisense RNA probes were synthesized in a standard T7, T3, or SP6 polymerase
reaction using 35S-CTP, followed by partial alkaline hydrolysis to reduce the average probe length to
the optimal size of approx 150 nucleotides. Sections were pretreated with Proteinase K at 1 µg/mL for
30 min at 37°C. After ISH, the deposit of silver grain was visualized on a microscope using dark field.
PROBES
A fragment of the murine homeobox gene hoxa4 extending from an EcoRI site in the second exon
until the extremity of the 3' untranslated region was cloned in a pGEM11zf vector (Promega). The
probe for hoxa4 was then synthesized from the extremity of the 3' untranslated region of the gene until
a BglII site located in the second exon. The RNA probe for hoxd4 was prepared after subcloning a
cDNA fragment into a pBluescript KS (+/<) transcription vector (Stratagene). This sequence extended
up to 700 bp downstream of the homeobox BglII site (BglII–HindIII fragment; ref. 25). The probes for
hoxa5, hoxc5, and hoxc6 were described by Fibi et al. (26), Gaunt et al. (27), and Sharpe et al. (28),
respectively. The probe for hoxa6 was synthesized from a vector provided by P. Gruss and which con-
tained a 1.7 kb EcoRI insert in pSP65.
FALSE-COLOR DISPLAY OF ISH
To analyze the ISH signal, dark-field sections were visualized using a Laborlux S microscope (Leitz)
with an attached CCD camera (TK-890 E, JVC) and were processed using PC-based image analysis
software (vidas Res 2.1, Kontron Elektronik). For the expression-level analysis, the image analysis
system substituted a false-color look-up table for the 256 gray level look-up table initially used to dis-
play the ISH image. Gradients of increasing intensity of expression were thus converted to colors span-
ning from blue (corresponding to background), to green (a weak signal), to yellow (a clearly visible sig-
nal), to red (a very intense, saturated signal). Analyzers of expression levels were blind to treatment.
RESULTS
BA treatment had no effect on prenatal mortality; however, a slight, nonsignificant, increase in post-
implantation loss was noted after GD 11 treatment (Table 2). Fetal weights were reduced for groups
treated on GD 7, 9, 10, or 11. A variety of malformations (Table 3) involving the axial skeleton (small
366 Narotsky et al.
Table 3
Summary of Fetal Examination Findings
Treatment
Control GD 6 GD 7 GD 8
GD 9
GD 10 GD 11
No. litters (fetuses)
17 (211) 12 (150) 11 (140) 13 (162)
16 (201) 10 (121) 10 (111)
Mean fetal incidence per litter (%)
<26 presacral vertebrae
0 0.6 ± 1.4 0 8.5 ± 3.0
51.9 ± 6.5
c
57.2 ± 9.1
c
0
<7 cervical vertebrae
0
0
0 1.8 ± 1.4 88.3 ± 6.1
c
00
<13 ribs
0
0
0 1.3 ± 1.3
0
55.9 ± 8.4
c
0
>13 ribs
2.0 ± 1.1 2.4 ± 1.8 6.2 ± 2.4 7.4 ± 1.9
48.2 ± 5.6
c
00
<6 sternebrae
0 0.8 ± 0.8 0 2.7 ± 1.8 15.0
± 3.2 27.4 ± 8.8
c
1.5 ± 1.0
Cervical rib
0.4 ± 0.4 0 1.3 ± 0.9 3.8 ± 0.3
a
4.8 ± 1.5
b
1.6 ± 1.1 0
Sternoschisis (partial)
0
0
0
0
0
0 0.8 ± 0.8
Sternal agenesis
0
0
0
0
0.5 ± 0.5
0
0
Fused ribs
0.5 ± 0.5 0
0 4.1 ± 1.5
b
0
3.2 ± 2.4
a
0
Bifurcated ribs
0
0
0 1.8 ± 0.9
b
000
Fused vertebrae
0.5 ± 0.5 0.6 ± 0.6 0 8.9 ± 3.3
b
1.1 ± 0.7 5.9 ± 2.7
a
3.3 ± 3.3
Fused mandibles
0
0
0
0
0.5 ± 0.5
0
0
Small orbit
0
0 3.7 ± 2.5 0
0.5 ± 0.5
0
0
Fused costal cartilage
0
0
0 2.0 ± 1.5 18.4 ± 3.3
c
00
Asymmetric L-S junction
0 0.6 ± 0.6 0 3.1 ± 1.7 11.7
± 3.8
c
4.6 ± 2.6
c
0
Vestigial tail
0
0
0
0
0
0.9 ± 0.9
a
0
Umbilical hernia
0
0
0 0.5 ± 0.5
0
0
0
Agnathia and exophthalmia 0.5 ± 0.5 0
0
0
0
0
0
Extra rib cage, etc.
0 0.6 ± 0.6 0
0
0
0
0
Lateral cartilage score:
C3
3.9 ± 0.0 –
–
–
3.9 ± 0.1 3.9 ± 0.0 3.8 ± 0.1
C7
3.7 ± 0.1 –
–
–
3.9 ± 0.1 3.9 ± 0.1 3.8 ± 0.1
T1
0.0 ± 0.0 –
–
–
1.0 ± 0.5 0.1 ± 0.1 0.0 ± 0.0
a
Significantly different from control value (
p < 0.05).
b
Significantly different from control value (
p < 0.01).
c
Significantly different from control value (
p < 0.001).
366