BARRIER SYSTEMS for ENVIRONMENTAL CONTAMINANT CONTAINMENT and TREATMENT - PART 5 (end) ppsx
Bạn đang xem bản rút gọn của tài liệu. Xem và tải ngay bản đầy đủ của tài liệu tại đây (2.28 MB, 70 trang )
287
5
Subsurface Barrier
Verification
Prepared by*
David J. Borns
Sandia National Laboratories, Albuquerque,
New Mexico
Carol Eddy-Dilek
Westinghouse Savannah River Company,
Oxford, Ohio
John D. Koutsandreas
Florida State University, Tallahassee, Florida
Lorne G. Everett
L. Everett and Associates, LLC, Santa Barbara,
California
5.1 OVERVIEW
Waste containment system performance data are needed to conduct assessments
that reveal the integrity of the barrier and verify that the operational aspects of
the systems are functioning as designed. Biological, chemical, and physical
phenomena in the subsurface or some combination thereof can impact the per-
formance of subsurface barriers. To confirm the performance of the barrier and
possibly determine where a failure has occurred, a well-planned and implemented
monitoring system is required.
The design service life of a containment system can range from as little as
10 years for slurry walls to more than 1000 years for radioactive waste storage
structures. The longer the service life of a containment system, the greater the
* With contributions by William R. Berti, DuPont Central Research and Development, Newark,
Delaware; Skip Chamberlain, U.S. Department of Energy, Washington, DC; Thomas W. Fogwell,
Fluor Hanford, Richland, Washington; John H. Heiser, Brookhaven National Laboratory, Upton, New
York; John B. Jones, U.S. Department of Energy, North Las Vegas, Nevada; Eric R. Lindgren, Sandia
National Laboratories, Albuquerque, New Mexico; William E. Lowry, Science and Engineering
Associates, Inc., Santa Fe, New Mexico; Keri H. Moore, National Research Council, Washington,
DC; Horace K. Moo-Young, Jr., Villanova University, Villanova, Pennsylvania; Michael G. Serrato,
Westinghouse Savannah River Company, Aiken, South Carolina; Matthew C. Spansky, Westinghouse
Savannah River Company, Aiken, South Carolina;
4040_C005.fm Page 287 Wednesday, September 21, 2005 12:28 PM
© 2006 by Taylor & Francis Group, LLC
288
Barrier Systems for Environmental Contaminant Containment & Treatment
probability of system failure. Because most components of containment systems
exist underground, direct visual inspection is not tenable as a monitoring method.
Thus, several traditional and evolving techniques of indirect and direct observa-
tions need to be employed to obtain performance data.
In terms of containment system effectiveness, two types of failure categories
can be identified: structural failure and functional failure. Structural failure can
occur without functional failure, although it can eventually lead to functional
failure. Thus, verification monitoring of barrier structural and/or functional fail-
ures is essential over the life of the barrier. Long-term monitoring is an important
aspect in determining the integrity of the barrier over the lengthy lifetimes of
many contaminants. This chapter discusses the state-of-the-art monitoring tech-
nologies and recommends innovative methods such as
in
situ
sensors to improve
and reduce the cost of barrier monitoring.
5.2 GOALS
Subsurface verification is integral to achieving acceptance of covers, permeable
reactive barriers (PRBs), and subsurface barriers such as walls and floors. The
roles of subsurface verification in this process of acceptance are as follows:
• Meet or exceed regulatory requirements
•Verify performance of engineered barriers
•Verify conceptual models of contaminant fate and transport
•Verify models for containment systems
• Conduct long-term performance monitoring
• Ensure identification of trigger levels for contingency actions
At present, there are no specific regulations under the Comprehensive Envi-
ronmental Response, Compensation, and Liability Act (CERCLA) or the
Resource Conservation and Recovery Act (RCRA), and there is no regulatory
guidance on subsurface barrier integrity or performance validation. The only
regulatory standard for barriers is the RCRA requirement (40 CFR 264, Subpart
N, Landfills) of a 10
–7
cm/s hydraulic conductivity at a thickness of 0.91 m.
Additional standards may be added in the near term because the United States
Environmental Protection Agency (USEPA) Office of Emergency and Remedial
Response has launched the Superfund Initiative on Long Term Reliability of
Containment (Betsill and Gruebel, 1995). The USEPA is scheduled to work with
other U.S. agencies to develop technical guidance and methodologies to evaluate
containment technologies.
The American Society for Testing and Materials International (ASTM) has
standards pertaining to barrier monitoring. Reference to these standards should
be made when considering potential methods. The ASTM D18.21.02 committee,
chaired by Lorne G. Everett, on vadose zone monitoring standards is responsible
for publishing the list of vadose zone standards provided in Table 5.1.
4040_C005.fm Page 288 Wednesday, September 21, 2005 12:28 PM
© 2006 by Taylor & Francis Group, LLC
Subsurface Barrier Verification
289
5.3 VERIFICATION MONITORING
Monitoring plays a key role at all stages in environmental management — from
initial site discovery to site closure. Monitoring programs are essential in facili-
tating site characterization and risk assessment, adequately conducting experi-
mentation and evaluation, producing the data necessary for the performance
evaluation, determining whether residual contamination exists that will prevent
site closure, and verifying the effectiveness of containment structures. The focus
of monitoring programs is necessarily site and time specific. For example, a soil
remedial action may primarily require sampling during excavation and immedi-
ately after remediation work is complete (site closure). For sediment and ground-
water remedial actions, longer-term monitoring programs might be developed
that have their roots in initial site characterization activities, continue through
remediation, and extend for significant periods of time beyond termination of
active remediation. In the case of groundwater, most sites begin with an inherited
set of monitoring points already established and so part of the monitoring design
process also includes determining to what extent the existing network can be
used or must be abandoned or expanded. Depending on the selected remedial
action (Table 5.2), monitoring programs can represent the majority of remedial
action costs (e.g., monitored natural attenuation) or only a small percentage.
Traditional characterization and verification monitoring programs tend to pre-
specify sample numbers, locations, sampling frequency, and analytics (i.e., off-
site laboratory analyses). This traditional type of data collection presents several
TABLE 5.1
ASTM International Vadose Zone Monitoring Standards
Vadose zone terminology (final)
Soil pore-liquid monitoring (D 4696-92)
Soil core monitoring (D 4700-91)
Matrix potential determination (D 3404-91)
Neutron moderation (D 5220-92/97)
Soil gas monitoring (D 5314-93)
Hydraulic conductivity (D 5126-90)
Decontamination of field equipment (D 5088-90)
Flux determination by time domain reflectometry (D 6565)
Determining unsaturated and saturated hydraulic conductivity in porous media by steady-
state centrifugation (D 6527)
Horizontal applications of neutron moderation (D 6031)
Frequency domain capacitance (Z4302Z)
Field screening guidance standard (final)
Water content determination (draft)
Vadose zone borehole flow rate capacity test (draft)
Air permeability determination (outline)
Thermalcouple psychrometers (outline)
4040_C005.fm Page 289 Wednesday, September 21, 2005 12:28 PM
© 2006 by Taylor & Francis Group, LLC
290
Barrier Systems for Environmental Contaminant Containment & Treatment
TABLE 5.2
Progressive Monitoring Steps for a Remediation by Natural
Attenuation Program
Step Description Parties Involved
I Establish point of
compliance
Specify point of compliance and the point at which
monitoring must be conducted
Regional
administrator
II Define what is to
be monitored
Demonstrate that natural attenuation is occurring
according to expectations accomplished by
including steps to:
1. Identify any potentially toxic transformation
products; Determine if a plume is expanding
(either downgradient, laterally or vertically)
2. Ensure no impact to down gradient receptors
3. Detect new releases of contaminants to the
environment that could impact the
effectiveness of the natural attenuation remedy
4. Demonstrate the efficacy of institutional
controls that were put in place to protect
potential receptors
5. Detect changes in environmental conditions
(e.g., hydrogeologic, geochemical, micro-
biological, or other changes) that may reduce
the efficacy of any of the natural attenuation
processes
6. Verify attainment of cleanup objectives
Site operator and
regional administra-
tor (USEPA or the
state-implementing
agency)
III Establish the time
period for
monitoring
Continue as long as contamination remains above
required cleanup levels, continue for a specified
period (e.g., 1–3 years) after cleanup levels have
been achieved to ensure that concentration levels
are stable and remain below target levels.
Regional
administrator
(USEPA or the state-
implementing
agency)
IV Define how
monitoring is to
be done
Demonstrate of the monitoring approach being
appropriate and verifiables accomplished by
including steps to:
1. Specify methods for statistical analysis of data,
e.g., established tolerances, seasonal and
spatial variability
2. Establish performance standards:
• Information on the types of data useful for
monitoring natural attenuation performance
in the ORD publications (EPA/540/R-97/504,
EPA/600/R-94/162)
•EPA/600/R-94/123: a detailed document on
collection and evaluation of performance
monitoring data for pump-and-treat
remediation systems
Site operator and
regional
administrator
(USEPA or the state-
implementing
agency)
4040_C005.fm Page 290 Wednesday, September 21, 2005 12:28 PM
© 2006 by Taylor & Francis Group, LLC
Subsurface Barrier Verification
291
limitations, particularly in the context of subsurface characterization and moni-
toring. The costs are sometimes prohibitive, driven both by sample analytical
costs and the capital investment required for monitoring wells. High monitoring
costs, particularly for monitoring programs that extend over time, result in pres-
sures to limit data collection. Limited data collection, in turn, results in decision-
making that relies on data sets too sparse to adequately address the inherent
heterogeneities and uncertainties associated with subsurface barrier systems.
Finally, by prespecifying sample numbers and locations and relying on off-site
TABLE 5.2 (continued)
Progressive Monitoring Steps for a Remediation by Natural
Attenuation Program
Step Description Parties Involved
• Standard test methods such as described in
EPA SW-846, “Test Methods for Evaluating
Solid Waste - Physical/Chemical Methods” or
EPA publication, “Methods of Chemical
Analysis for Water and Wastes”
3. Establish a time interval agreed upon by
regional administrator or agency, including
reporting maps, tabulation of data and
statistical analysis, identification of trends,
recommendations for changes in approach,
evaluation of whether contaminants have
behaved as predicted, and whether other
remedies are required
V Define action
levels or process
to be observed for
monitoring
Establish metrics for the monitoring system:
1. Establish background levels
2. Define what criteria shows that a plume is
expanding or diminishing
3. Define what criteria shows that the conceptual
model is applicable to a site
4. Determine the metrics of cleanup objectives
and effectiveness
Site operator and
regional
administrator
(USEPA or the state-
implementing
agency)
VI Define actions to
be accomplished
when action
levels or
processes are
observed
Establishment of action plan to follow attainment
of metric:
1. Observe requirement to report to responsible
party or agency statistically significant
variance compared to background
2. Identify extent and nature of nonpredicted
behavior (e.g., release)
3. Re-evaluate conceptual model and evaluate
feasible corrective actions from previous and
evolving contingency plan
Site Operator will
provide details of the
monitoring program;
should be provided
to USEPA or the
state-implementing
agency as part of any
proposed monitored
natural attenuation
remedy
4040_C005.fm Page 291 Wednesday, September 21, 2005 12:28 PM
© 2006 by Taylor & Francis Group, LLC
292
Barrier Systems for Environmental Contaminant Containment & Treatment
laboratory analyses with long turnaround times for analytical results, traditional
characterization and monitoring programs are ill equipped to handle unexpected
results. Fortunately over the last several years, technological advances have
occurred in sensors, field analytics, and sample collection technologies that can
help to lower costs and/or increase the effectiveness of monitoring programs (see
Box 5.1). New approaches for designing and implementing environmental data
collection programs have also been developed. A few of those innovative barrier-
monitoring technologies are discussed in the subsections below.
5.3.1 M
ETHODS
Methods for barrier monitoring generally fall into broad classes such as measure-
ment of moisture change, collection of moisture and gas samples, temperature,
flow/velocity, barometric pressure, and settlement. An in-depth evaluation of
barrier-monitoring science and technology is provided in the National Department
of Energy Vadose Zone Science and Technology Roadmap [Idaho National Envi-
ronmental Engineering Laboratory (INEEL), 2001].
5.3.1.1 Moisture Change Monitoring Methods
A number of methods are available for barrier-monitoring moisture change in
soils (Everett et al., 1984; Wilson et al., 1995; Looney and Falta, 2000a,b). Many
of these measurement techniques require laboratory testing to develop calibration
curves relating instrument output to soil moisture content. Several of the more
commonly used methods are described below.
BOX 5.1
Rapid Field Characterization of Sediments
Rapid field characterization techniques have been developed to speed assessment and
reduce costs. These are field-transportable screening tools that provide measurements
of chemical, biological, or physical parameters on a real-time or near real-time basis.
Specific advantages include the ability to get rapid results to guide sampling locations,
the potential for high data mapping density, and a reduced cost per sample. The
approaches do have limitations including the nonspecific nature of some tests,
sensitivity to sample matrix effects, and some loss in accuracy over conventional
laboratory analyses. A variety of tools has been suggested for the rapid characterization
of sediments, as shown in the table below.
Screening-Level Analyses Recommended by the Assessment and Remediation
of Contaminated Sediments Program for Freshwater Sediments
Analytical Technique Parameter(s)
X-ray fluorescence spectrometry (XRF) Metals
UV fluorescence spectroscopy (UVF) Polycyclic aromatic hydrocarbons (PAHs)
Immunoassays PCBs, pesticides, PAHs
Microtox Acute toxicity
4040_C005.fm Page 292 Wednesday, September 21, 2005 12:28 PM
© 2006 by Taylor & Francis Group, LLC
Subsurface Barrier Verification
293
•
Neutron probe
— The neutron probe contains a source of neutrons
and detectors to measure backscattered neutrons. The magnitude and
energy of backscattering is primarily a function of the hydrogen content
of the material surrounding the probe. To take readings, the neutron
probe is lowered into the pipe and a continuous record of the response
is obtained. Changes in the readings over time at a particular depth
indicate changes in the number of hydrogen atoms, i.e., water content.
The neutron probe must be calibrated for specific soils. This method
•
Time domain reflectometer
— In this method, an electromagnetic
end of the cable, a portion of the signal is reflected. The amplitude and
travel time of the reflected portion depend on the dielectric properties
of the soil, which in turn are strongly dependent on soil moisture
content. The output is typically monitored on an oscilloscope or cable
tester. These probes can be monitored remotely and have no direct
analytical costs associated with them other than initial calibration. This
tends to minimize life-cycle costs.
•
Thermocouple psychrometer
— This instrument measures relative
humidity within the soil pores, from which soil water potential and
therefore moisture content can be calculated. Humidity is determined
by the observed difference in temperatures between two thermocou-
ples, one of which is exposed to the humidity in the surrounding soil
and experiences cooling; the other thermocouple is located adjacent to
the first but is isolated from the humidity. Moisture content is deter-
mined from relative humidity on the basis of laboratory calibration.
•
Electromagnetic Induction (EMI)
— EMI is a standard geophysical
technique (Chapter 4) that is used to measure the conductivity of soil
mass. At the ground surface, a transmitter coil generates an electro-
magnetic field that induces eddy currents in the underlying subgrade.
Secondary electromagnetic fields created by the eddy currents are
measured by a receiver coil that produces an output voltage related to
the subsurface conductivity. EMI is a rapid technique that is often used
to delineate contaminant plumes, buried wastes, and other features that
have conductivity contrasts with the surrounding soil.
•
Electrical resistivity tomography (ERT)
— ERT is based on a large
number of soil resistance measurements (Chapter 4) analyzed by math-
ematical methods (e.g., finite difference models employing inversion
techniques). Each resistance measurement involves several electrodes,
some to apply a current through the soil and some to measure the
voltage drop. The location and spacing of the electrodes determines
the soil volume being measured; in general, larger electrode spacings are
used at greater depth. Commonly, a linear series of electrodes is placed
on the ground surface or beneath a landfill. An automatic monitoring
4040_C005.fm Page 293 Wednesday, September 21, 2005 12:28 PM
© 2006 by Taylor & Francis Group, LLC
wave is transmitted along a transmission cable buried in soil. At the
is discussed in more detail in Section 5.9.1.1.
294
Barrier Systems for Environmental Contaminant Containment & Treatment
system excites various pairs of electrodes according to a programmed
sequence and measures the resistance between other pairs. When all
desired combinations have been read, the resulting data are analyzed.
The result is a two-dimensional contour map (i.e., a vertical or hori-
zontal slice) of soil resistivity along the electrode line. Changes in
moisture content over time appear as changes in resistivity. Laboratory
calibration of subgrade soil is required to develop quantitative relation-
ships. High-resolution resistivity has shown particular merit in both
cap and subsurface liner monitoring but is not developed to a stage
where it can be recommended in the near term.
•
Fiber-optic cable
— These systems could be considered as one of the
latest improvements in vadose zone sensor systems. Fiber-optic sys-
tems already are measuring strain, temperature, acoustics, moisture,
pH, flow, and chemicals. Fiber-optic cable could be included in the
future applications of a monitoring system. The cable could be
deployed in the perforated stainless-steel tubing laid down below the
bottom liner during construction. Consideration could be given to
including fiber-optic cable in the horizontal and vertical monitoring
orientations. The cost advantages expected with the use of fiber-optic
sensors are substantial. The risk of causing preferential flow paths
associated with installing a very small diameter fiber cable is small
relative to the other technologies.
5.3.1.2 Moisture Sampling Methods
There are processes other than leakage through the barrier liner system that could
cause changes in moisture content of the vadose zone. Examples include moisture
release from the admix layer as it consolidates under the load of the waste, and
vapor migration due to temperature changes caused by excavation, lateral mois-
ture, or vapor movement into the trench (from outside the trench), and removal
of subgrade soils. Moisture change resulting from such processes could be diffi-
cult to distinguish from leachate. In addition, those methods described above in
dissolved constituents as well as moisture content alone. In spite of these limi-
tations, in the case of a RCRA cap, which is designed as an impermeable cap,
elevated moisture migration rates alone can be used as an indicator of increased
infiltration through the cap.
To determine whether moisture is the result of leakage through the barrier
liner, samples are collected and analyzed for constituents known to occur in the
waste material. A number of techniques are available and are described in the
literature (Everett, 1980; Everett et al., 1984; Wilson et al., 1995; Looney and
Falta, 2000a,b).
•
Suction lysimeter
— The suction lysimeter consists of a porous cup
or plate attached to a small diameter tube leading to a sampling chamber.
4040_C005.fm Page 294 Wednesday, September 21, 2005 12:28 PM
© 2006 by Taylor & Francis Group, LLC
Section 5.3.1.1 that use electrical properties of the soil would be influenced by
Subsurface Barrier Verification
295
The lysimeter is buried in the soil at the location where a sample is
desired, and the tubing leads to an accessible location. To obtain a
sample, a reduced pressure is applied to the lysimeter. Water in the soil
matrix is sucked into the lysimeter and accumulates in the sampling
chamber. There are various modifications utilizing additional tubes,
check valves, and other components to allow samples to be retrieved
from depth, but the basic operating principle is the same.
•
Absorbent pads
— This method uses pads of absorbent material, such
as felt, to collect soil moisture. One commercially available system
(Flute) that has been used to collect samples beneath a radioactive
waste landfill at Los Alamos National Laboratory (New Mexico), uses
a cylindrical flexible membrane that holds the pads. The membrane is
initially inside out, or inverted, and is everted as it is placed in the
borehole so that the pads contact the borehole wall. After a period of
time, when the pads have reached equilibrium with the surrounding
material, the membrane is withdrawn, being inverted again during this
process so that the pads are not contaminated. In soil materials, where
an open borehole cannot be maintained over the long term, a permeable
casing is required.
•
Sodium iodide gamma detector
— This is a radiation-measuring
instrument that is lowered down an access pipe. Rather than returning
a sample to the ground surface, the detector measures the radioactivity
of the surrounding soil. This method identifies contaminants that are
gamma emitters in sufficient concentrations to be clearly detectable.
•
basin a few meters in dimension. It is lined with a geomembrane and
backfilled with vadose zone soil. The floor of the basin slopes to a
collection point, and a pipe leads from this point up to the ground
surface. When a sample is required, a sampling pump is lowered down
the pipe, where quantifiable measurements can be obtained.
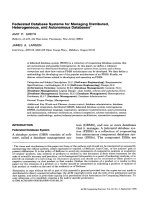
5.3.1.3 Vadose Zone Monitoring Considerations
To monitor flow and transport in covers, walls and floors, point-type probes such
as tensiometers, time-domain reflectometry probes (TDR), suction lysimeters,
and thermistors can be used as well as geophysical imaging methods such as
seismic surveys, ground penetrating radar (GPR), and three-dimensional (3-D)
ERT (Hubbard et al., 1997). Point-type probes may or may not intersect single
flow paths (Figure 5.1). The shortcoming of point-type probe measurements is
the difficulty of combining their responses in a meaningful way, such as integrat-
ing or volume averaging responses from a number of point measurements. Geo-
physical imaging methods complement point-type measurements by providing a
spatially distributed view of subsurface conditions. Each measurement represents
an average over space and time; however, the volume affected cannot be determined.
4040_C005.fm Page 295 Wednesday, September 21, 2005 12:28 PM
© 2006 by Taylor & Francis Group, LLC
Basin lysimeter — The basin lysimeter consists of a broad, shallow
For additional details, refer to the discussion in Section 5.5.2.1.
296
Barrier Systems for Environmental Contaminant Containment & Treatment
The shortcomings of geophysical methods are their lack of spatial resolution in
detecting small barrier leaks, and the difficulty of correlating values such as
electromagnetic responses and seismic velocities to hydrogeologic parameters
governing fluid flow. Neither method can be used to observe flow in single
fractures of fluid movement at the fracture matrix interface in sufficient detail to
accurately represent transport through barriers.
5.4 VERIFICATION SYSTEM DESIGN
One of the key issues discussed at the workshop was integrating the verification
system design into the overall barrier design. The barrier must have a set of
performance requirements that are site specific and risk based. Without a risk-
based performance objective, the barrier is either intact and good or breached
and unusable. As stated previously, none of the regulatory agencies has a set of
criteria for a barrier.
De facto
, the regulators take a risk-based approach to
approving such structures. Risk-based performance objectives are crucial to the
successful deployment of subsurface barriers.
This fact is demonstrated when comparing two identical failures in a barrier
at distinctly different locations. Suppose an obstruction blocks the flow of grout
during installation of a barrier wall, resulting in a 1 m
2
hole in the barrier wall.
In one case the hole occurs within 1.2 m of the uppermost (shallowest) region
of the barrier. In the other case, the hole is located at the bottom region of the
barrier. Water flux through the waste site would result in contaminant mobilization
FIGURE 5.1
Schematic of the performance of local-type and cross-borehole monitoring
methods in a heterogeneous formation (
In Situ Remote Sensors and Networks,
1999e).
1. Tenslometers, ER probes,
TDR provide local (6–20 om)
measurements
2. Vacuum water
sampling and neutron
logging affect the 30–40 om
near borehole
3. Cross-hole radar and
3D ER; tomography are
effective within the
zone of up to 10–12 m
Preferred water
1
1
2
2
3
3
4040_C005.fm Page 296 Wednesday, September 21, 2005 12:28 PM
© 2006 by Taylor & Francis Group, LLC
Subsurface Barrier Verification
297
and transport with the water. Water flow would occur mostly in a vertical direction
due to gravity. Near the surface of the barrier, horizontal spread would be minimal
and the likelihood that water will transport out of a hole near the top of the barrier
is small. At the bottom of the barrier, water would collect and any hole in this
region would serve as a drain, similar to a bathtub. These two nearly identical
flaws in the barrier have extremely different consequences. One would require
repair and the other could be ignored entirely.
When designing a verification/monitoring system, it is crucial that a set of
failure criteria be established. This may necessitate implementing an iterative
approach to barrier and verification designs. Once the performance requirements
are established for the barrier and a conceptual model is developed, a conceptual
verification system can be designed. The conceptual barrier design may need to
be modified to accept the verification design (e.g., use of plastic components
instead of metal to allow for the use of ground penetrating radar). Once conceptual
models for both have been developed, the failure mechanisms of the barrier need
to be identified. Using risk assessment models, the failure scenarios can be
simulated to determine what constitutes unacceptable failure of the barrier.
Depending on the results, the verification/monitoring system may require
changes, which can result in further modifications to the barrier design and so
forth. This process continues until an acceptable combination of barrier design
and verification/monitoring system is achieved.
5.5 MOVING FROM STATE OF THE PRACTICE
TO STATE OF THE ART
Subsurface verification suggests that containment design and implementation
move toward the state of the art rapidly from the current state of the practice. In
1976, Everett et al. recommended neutron probes and suction lysimeters for cap
and floor barrier monitoring. Thirty years later, these same two techniques are
still primarily used for barriers in California. The basic steps to accomplish this
badly needed state-of-the-art transition are twofold:
1. Take a full system approach in which design, implementation, charac-
terization, and verification are iterative, inter-connected, and ongoing.
This integrated approach includes optimizing the verification activities,
defining the performance goals and action levels, and using methods
to quantify uncertainty.
2. Move implementation toward the smart structure approach now used
in buildings, bridges, roads, and other structures in which sensors and
telemetry are incorporated during construction. This smart structure
approach will affect a lowering of cost through
in
situ
analysis and
help achieve the end state at many sites that are expected to have no
on-site restoration personnel.
4040_C005.fm Page 297 Wednesday, September 21, 2005 12:28 PM
© 2006 by Taylor & Francis Group, LLC
298
Barrier Systems for Environmental Contaminant Containment & Treatment
5.5.1 S
YSTEM
A
PPROACH
The technical process of total system performance assessment (i.e., integration
design, prediction, and data collection) may appear complex initially. However,
such processes are used in our everyday lives (e.g., buying a car, selecting an
area where to live, choosing a career). The approach here is to build on the
familiar everyday aspects to develop a process that can be rigorously and defen-
sibly applied to environmental remediation (Borns, 1997). The predictive tools
and data needs from subsurface monitoring programs for boosting long-term
containment system performance are part of an integrated system of data collec-
tion, decision analysis, and uncertainty analysis. The engineering process of
decision analysis and uncertainty analysis bridges the gap of predictive tools used
between the engineering design and the long-term performance assessment meth-
ods (tens of years to thousands of years of performance). Decision analysis and
uncertainty analysis also provide a basis for an integrated and interactive approach
using design, predictive models, and the analysis of the accumulated data at
different stages of the project.
All projects, engineering and environmental, have built-in decision processes
that involve varying risk-reward scenarios (Lockhart and Roberds, 1996). These
processes can be based on intuitive, analytic, numerical, and expert judgment
approaches. Developers, end-users, and stakeholders evaluating
in
situ
stabilization
and containment systems are faced with a similar problem of selection. However,
the time periods of predicted performance are longer, and the consequences of
failure are higher than these everyday examples of system prediction. The pre-
dictive tools and the data, which are used to ascertain long-term performance,
are required to be rigorous, documented, and defensible. Such predictions of
long-term performance are based on conceptual models of system design and the
geological environment (natural system) that encompasses the system. These
conceptual models and the adequacy of the performance prediction reflect the
uncertainties and data quality that describe natural and designed containment
system performance.
5.5.1.1 Links to Modeling and Prediction
An example of the important link among landfill design, modeling, and perfor-
mance assessment is in the realm of permeable reactive barriers. Morrison et al.
(2001) described the importance of reaction path modeling to predict and verify
PRB performance. Similarly, Roh et al. (2000) demonstrated the importance of
modeling the corrosion, precipitation, redox reactions, and sorption in predicting
PRB material performance. Hydrologic modeling was identified by Gupta and
Fox (1999) as essential for barrier design (including location, width, and material
selection) and for evaluating scenarios for performance predictions. These sepa-
rate modeling activities should be linked into a system with the data flowing from
the subsurface or other verification activities. The overall system can be linked
as in Figure 5.2.
4040_C005.fm Page 298 Wednesday, September 21, 2005 12:28 PM
© 2006 by Taylor & Francis Group, LLC
Subsurface Barrier Verification
299
5.5.1.2 Optimization
The integration of verification data and modeling permits another important step,
which is the optimization of the integrated system. An optimization approach for
verification is a set of tools, at this time conceived to be computer programs, that
tells the PRB user or designer where and how often measurements or samples
need to be obtained to determine (1) whether the remedial system is operating
properly, and (2) if risks have increased. The goal is to monitor in space and time
to achieve the following:
• Meet regulatory requirements and/or assess residual risks using a min-
imum number of monitoring stations located where the contaminant
or surrogate variable is most likely to be.
• Sample at a frequency that captures contaminant movement to confirm
that all processes are operating effectively or trigger any necessary
contingency action.
Gupta and Fox (1999) describe how hydrologic data combined with modeling
define the optimal monitoring well locations and range of variation in flow
direction and flux needed for verification.
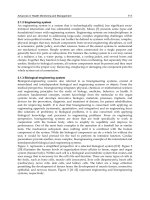
5.5.1.3 Decision and Uncertainty Analysis
The decision analysis process (Figure 5.2) of Lockhart and Roberds (1996) can
be used as an example to identify the predictive tools and data needs for subsurface
containment projects. This process also provides a basis for implementing an
integrated and interactive approach using design, predictive models, and the
analysis of the accumulated data at different project stages. The tables are pro-
vided to give an understanding of the types of parameters and processes that need
to be determined to apply risk decision analysis processes to a given problem.
The evaluation of remediation sites demonstrates the difficulties in obtaining
data and the uncertainties of important parameters. Water balance modeling,
FIGURE 5.2
The decision–analysis process of Lockhart and Roberds (1996) (
Civil Engi-
neering
, April, 62–64).
Optimum
decision
Implementation
& feedback
Potential
Consequences
Potential
Data
Parameter
Definitions
Mathematical
Models
Conceptual
Models
Sensitivity studies
Parameter
Assessments
Potential
consequences
Data
Project description
Project
alternatives
Decision
criteria
Screening &
trade-offs
Stake-
holders
4040_C005.fm Page 299 Wednesday, September 21, 2005 12:28 PM
© 2006 by Taylor & Francis Group, LLC
300
Barrier Systems for Environmental Contaminant Containment & Treatment
which is a significant component in transport modeling, provides an example of
the difficulties in evaluation. Such difficulties are due to the level of understanding
of the process and the adequacy of the data to support the evaluation. For water
balance modeling, it must be recognized that evaporation (or evapo-transpiration)
cannot be reliably calculated in either humid or arid environments. The best
estimates for the evaporation parameters are for humid environments. Even for
the best of these estimates, a great deal of empirical judgment is required, and
the uncertainties are large. The resulting recharge estimates are in error by as
much as 100% or more. It is virtually impossible to calculate evaporation for arid
environments. Errors of two to three orders of magnitude or more are not uncom-
mon. Because the understanding of processes is incomplete and because of the
high degree of uncertainty for important parameters, there is no preferred code
or set of codes for hydrologic modeling at arid sites. Hydrologic models for arid
sites are still being tested and calibrated.
5.5.2 S
MART
S
TRUCTURES
As barriers have become more complex, there is an ever-increasing need to build
intelligence into them so that they can sense and react to environmental changes
and impacts. To achieve this, a nervous system is required that performs in a
manner analogous to those living things sensing the environment, conveying the
information to central processing unit (the brain), and reacting appropriately.
A number of sensor technologies are being modified for use in verification
monitoring systems for barriers. These sensors can be embedded into the barriers
or in close proximity to the barriers, resulting in smart barriers with a built-in
nervous system. These smart barrier systems offer the prospect of adding effective
monitoring systems that are responsive to barriers but also are able to localize
failures and take appropriate action (Borns, 1997). Sensors incorporated into
barrier construction have the following advantages:
• They are inexpensive and can be placed in numerous positions where
previously only one data point was captured through expensive mon-
itoring wells.
• They can be designed to change out easily upon failure.
• They reduce the sampling waste created in conventional monitoring
programs.
• They can be placed in difficult to reach locations and possibly eliminate
exposure to contaminated mediums for field workers who would nor-
mally have to collect samples.
• Through the iterative process, they improve the model.
• Because most barriers will outlive most monitoring sensors, Everett
and Fogwell (2003) have stressed the importance of long-term access
to critical subsurface monitoring locations. These locations for caps
and liners are discussed later in this chapter.
4040_C005.fm Page 300 Wednesday, September 21, 2005 12:28 PM
© 2006 by Taylor & Francis Group, LLC
Subsurface Barrier Verification
301
One of the most effective monitoring technologies currently being employed
is fiber optics. Fiber-optic systems involve fiber-optic sensors and communication
links that allow the measurements of critical parameters of materials, structures,
liquids, and gasses. Surrogate parameters are good indicators of barrier perfor-
mance and are easily achievable with fiber-optic sensors. Surrogate measurements
such as moisture, pH, temperature, flow/velocity, and barometric pressure are
good indicators of barrier failures. The monitored moisture data facilitates site-
specific understanding of the transport pathways and processes that influence
contaminant movement.
The technical discussions of how fiber-optic sensors operate are not discussed
in this chapter because a number of manufacturing options exist. Simply stated,
fiber-optic sensors rely on the interaction of a light beam in the core of the fiber-
optic cable with the parameter to be measured or some interaction thereof. The
cladding on the fiber-optic cable can also be treated to produce the desired results.
The advantages of this technology include lightweight systems, immunity to
electromagnetic interference, and the ability to be imbedded into hostile environ-
ments with extremely high bandwidth capability. Fiber-optic sensor systems can
sense environmental changes within or around the barriers, interpret the measure-
ments, and initiate an appropriate reaction to these changes. Some of the param-
eters that are being measured using this technology include strain, temperatures,
acoustics, moisture, pH, flow, and chemicals (Udd, 1995).
Representative distributed fiber-optic sensors allow measurements of specific
parameters and can help determine the location of where the measured-induced
change occurs (Udd, 1995). Distributed chemical sensors can be constructed by
coating an optical fiber with indicator chemicals. The chemical to be sensed
diffuses into the cladding, modifying the absorption of the dye and accordingly
changing the attenuation of the fiber laser or light beam, which represents the
chemical to be measured. Additional information can be found in the bibliography
of Udd (1995).
For example, fiber-optic sensors have the potential to enable smart barriers
that would be difficult or impossible to implement using conventional electronic
technology. High priority barrier-monitoring parameters discussed at the Long-
Term Monitoring Sensor and Analytical Methods Workshop sponsored by the
United States Department of Energy (USDOE) and its Characterization, Moni-
toring, and Sensors Technology (CMST) Program include moisture content, mois-
ture flux, and moisture potential (USDOE/CMST, 2001). Engineering goals for
long-term monitoring sensors include making the sensors easy to understand,
install, calibrate, operate, and maintain with a capability to service. Monitoring
systems could easily be automated with data transmission via telemetry for remote
control and data processing capability. Many sensors that meet short-term needs
for barrier performance could be used as springboards for long-term monitoring
sensor development. Most costs would be significantly less than the current
baseline cost for a deployable system with a replacement cycle every two years
(USDOE/CMST, 2001).
4040_C005.fm Page 301 Wednesday, September 21, 2005 12:28 PM
© 2006 by Taylor & Francis Group, LLC
302
Barrier Systems for Environmental Contaminant Containment & Treatment
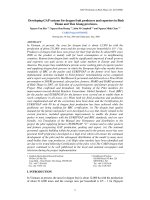
5.5.2.1 Long-Term, Post-Closure Radiation Monitoring
Systems (LPRMS)
An example of a new monitoring approach is the LPRMS that uses commercially
available components in a reliable, low-cost, multipoint system for real-time,
long-term, unattended monitoring of closed waste sites. The system measures a
wide range of radionuclides and activity levels applicable to a large number of
USDOE sites.
The LPRMS is designed for gamma detection in subsurface soils. The radi-
ation probe consists of a sealed assembly that contains a butt-coupled, thallium-
doped sodium iodide NaI (TI) scintillator/photomultiplier tube (PMT) and a
multi-channel analyzer (MCA). This assembly, termed the nanoprobe, can be
dropped into polyvinyl chloride (PVC) casings that are pushed into the soil using
cone penetrometer technology (CPT). At the surface, solar-powered remote sta-
tions (Figure 5.3) at each measurement location incorporate the system power
supply and a cell phone modem to communicate to an off-site host computer,
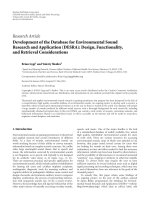
which can be located hundreds or thousands of miles away. A large number of
remote stations can each operate independently (Figure 5.4) and, without human
intervention, send their daily or weekly results to the host computer for analysis,
FIGURE 5.3
Conceptual drawing of installed system (
In Situ Remote Sensing and Net-
works,
1999a).
6-17
System Architecture
1.5" × 6" NaI detector
PMT and MCA
Power & digital
Communication
Cable
OFF-SITE
HOST COMPUTER
Cell phone
communication
tower
PVC Pipe
(installed using CPT)
Land line to
host computer
Environmental
enclosure
4" Schedule 40 steel
protective well cover
2" schedule 80 PVC
well casing
Concrete pad
Cell phone modem
antenna
824–896 MHz
Enclosure to well cover
adapter and gasket
Split cable grip
Deep cycle
battery
Cell phone
modem
Solar panel
48 to 54"
Excess nanoprobe
cable storage
Modem power switch
& RS485 to RS232
converter
REMOTE DETECTOR
STATION
Modem
Mast
Battery
charge
controller
4040_C005.fm Page 302 Wednesday, September 21, 2005 12:28 PM
© 2006 by Taylor & Francis Group, LLC
Subsurface Barrier Verification
303
data trending, and alarming. If required, the nanoprobes are easily serviceable
through retrieval from the PVC casing for repair or replacement.
This system is designed to be capable of monitoring large numbers of per-
manently installed probes over long-term periods. The above ground location of
most of the electronic components and the absence of below ground components
that require maintenance minimizes long-term costs.
This technology can remain unattended for long time periods while providing
automated data generation, analysis, formatting, and reporting from many mon-
itoring locations. Additional advantages are as follows:
• Real-time detection of nine typical (within USDOE) radionuclides in
the media surrounding the sensor eliminates the long turnaround time
encountered with conventional sampling and laboratory analysis.
• Sensor-based automated data generation, although not currently as
sensitive as typical laboratory analysis, reduces the potential for error
FIGURE 5.4
Schematic of System Components (In Situ Remote Sensing and Networks,
1999a).
Conceptual drawing of installed
system
Antenna
Cell phone
communication
tower
Remote detector
stations
Solar
panel
Environmental
enclosure
NaI detector
and MCA
PVC Casing
4040_C005.fm Page 303 Wednesday, September 21, 2005 12:28 PM
© 2006 by Taylor & Francis Group, LLC
304
Barrier Systems for Environmental Contaminant Containment & Treatment
from manual sampling, sample tracking, laboratory data generation,
analysis, and reporting.
• Minimal long-term manpower is required to operate the LPRMS when
compared with the baseline conventional sampling program.
5.5.2.2 Environmental Systems Management, Analysis,
and Reporting (E-SMART™) Network
Another example of an intelligent new verification system is the E-SMART
network. The E-SMART network installation includes the application of sensors
that detect and measure contaminants in groundwater and soil gas as well as
physical parameters such as barometric pressure, pH, and temperature.
Conventional monitoring systems suffer from limited expandability. The goal
of the E-SMART network is to eliminate these incompatibilities by defining an
open standard for constructing modular monitoring networks. This vision of
compatible environmental sensors, sampling devices, control systems, and data
analysis systems is shown in Figure 5.5.
The E-SMART network integrates diverse monitoring and control technolo-
gies by using a modular, “building block” design approach to allow for flexible
system configuration. The network treats each smart device — whether a sensor,
sampler, or actuator — as a black box that obeys the standard communication
protocols and electrical interfaces for the network. This approach allows multiple
vendors to produce different sensors that meet the same functional specification
and that can be interchanged without impacting operation.
Each E-SMART sensor or actuator contains its own microprocessor brain
that provides it with a means of storing calibration, control, status, and quality
FIGURE 5.5
E-SMART Vision (
In Situ Remote Sensing and Networks,
1999b).
Workstation
Plume
Smart sensors
Sampler
E-Smart network
management system
4040_C005.fm Page 304 Wednesday, September 21, 2005 12:28 PM
© 2006 by Taylor & Francis Group, LLC
Subsurface Barrier Verification
305
assurance data. This brain communicates using the network protocol, manages
data, and controls operation of the smart device. Because the sensor manufacturer
embeds the sensor-specific information within the smart device, the E-SMART
user is not required to develop calibration or control programs for specific sensors.
5.5.2.3 Direct Push Technologies
Direct push technologies have proven to be effective site characterization and
verification tools in recent demonstrations at the USDOE Hanford site (Wash-
ington) and U.S. Air Force sites at Harrison Air Force Base (AFB) (Indiana)
(closed since 1995), Misawa Air Base (Japan), and Kirtland AFB (New Mexico).
CPT has met refusal in some geologies before being advanced to the desired
depths at dense nonaqueous phase liquid (DNAPL) sites. A sonic CPT system
combines the speed and high penetration capabilities of sonic drilling with the
economic, continuous data logging of CPT, thus allowing access through difficult
strata. An important application of CPT is to install monitoring points. Percussion-
driven probes have been enhanced by integration with a laser-induced fluores-
cence spectrometer and other sensors, providing a less expensive and more easily
deployed system. Successful integration of real-time DNAPL chemical sensing
and geophysical instrumentation with horizontal directional drilling technology
will allow characterization of DNAPL-contaminated strata without introducing a
vertical conduit to underlying formations and other obstacles such as buildings
and barrier floors. Direct push technology is an excellent platform for making
continuous measurements of contamination: it is useful in pushing sensing sys-
tems into the subsurface; for installing monitoring wells and points; and for
obtaining gas, water, and soil samples for environmental testing.
CPT-associated sensor technologies such as soil strength stain gauges, resis-
tivity, soil moisture, pore pressure, gas chromatography/mass spectrometry
(GC/MS), multi-gas and organic vapor monitoring, and laser-induced fluores-
cence (LIF) (Kram et al., 2001a,b), provide enhanced site characterization, and,
while still on-site, can quickly and cost efficiently install monitoring wells.
Kram’s group (Kram and Keller, 2004a,b; Kram et al., 2004) has optimized
several laser excitation sources for specific carbon ranges using LIF, allowing
real-time profiling of petroleum hydrocarbon and some DNAPLs. By including
a CPT well installation component during verification, plume delineation efforts
can be accomplished within one field mobilization. When compared with con-
ventional approaches, this seamless method of optimizing well placement reduces
time and avoids additional data review, permitting, and mobilization/demobiliza-
tion costs. Recent work by the U.S. Navy (Kram and Keller, 2004a,b; Kram et al.,
2004) compares conventional well performance with pre-packed direct-push well
installations. If successful, this approach referred to as a Site Characterization
and Analysis Penetrometer System (SCAPS) and shown in Figure 5.6 will result
in significant verification monitoring cost savings.
4040_C005.fm Page 305 Wednesday, September 21, 2005 12:28 PM
© 2006 by Taylor & Francis Group, LLC
306
Barrier Systems for Environmental Contaminant Containment & Treatment
FIGURE 5.6
SCAPS.
SCAPS-Site characterization and
penetration system
Shaw e Shaw Group Inc.
Pipe
handling
space
20-ton push truck
Data
processing
space
VEHICLE
DATA ACQUISITION
AND ANALYSIS
• Push probe
configurations
-Sensors
-Sampling
• Grouting capability
• Equipment decontamination
• Hazardous environment
protection
• Acquisition
• Sensors
• Analysis
• Visualization
Trailer
4040_C005.fm Page 306 Wednesday, September 21, 2005 12:28 PM
© 2006 by Taylor & Francis Group, LLC
Subsurface Barrier Verification
307
5.5.2.4 Nanotechnology Sensors
Nanotechnology enables the creation of functional materials, devices, and systems
by controlling matter at the atomic and molecular scales to exploit novel prop-
erties and phenomena. Most chemical and biological sensors, as well as some
physical sensors, depend on interactions occurring at these levels. Potential appli-
cations under development include chemical sensors and probe tips. Nanotech-
nology such as carbon nanotechnology will impact almost every aspect of our
lives including fuel cells, portable X-ray machines, extremely lightweight strong
fabrics, and artificial muscles. The discovery of carbon nanotubes (CNT) —
extremely narrow, hollow cylinders made of carbon atoms — by Sir Harold Kroto
(Florida State University Nobel laureate) and his colleagues initiated an entirely
new field of chemistry research aimed at understanding the properties of these
unusual molecules. The characteristics of and the ability to grow CNTs at specific
locations and manipulate them afterward make it likely that the tubes will have
considerable impact on electronics and sensors (Smith and Nagel, 2003).
High levels of integration made possible by nanotechnology give the sensor
the ability to be the device and possibly also the system. Nanotechnology takes
the complexity out of the system and puts it into the material. Fluorescence and
other means of single molecule detection are being developed. Nanotechnology
will enable the design of sensors that are much smaller, less power hungry, and
more sensitive than current micro- or macro-sensors. Sensing applications will
thus enjoy benefits far beyond those offered by micro-electromechanical systems
(MEMS) and other types of micro-sensors. The ability to install hundreds of
sensors in a small space allows malfunctioning devices to be ignored in favor of
the remaining good ones, thus prolonging a system’s useful lifetime.
Examples of current work include development of a miniaturized gas ioniza-
tion detector that could be used for gas chromatography. Nanotube hydrogen
sensors have been incorporated in a wireless sensor network to detect hydrogen
concentrations in the atmosphere. In addition, a chemical sensor based on CNT
has been developed for gaseous molecules such as nitrogen dioxide (NO
2
) and
ammonia (NH
3
).
Nanotechnology is certain to improve existing sensor applications and be a
strong force in developing new ones. Nanoscale materials and devices are begin-
ning to be integrated into real-world systems, and the future looks bright in
particular for integrating the wireless smart sensors into hazardous waste barriers
and containment systems.
5.5.3 A
DVANCED
E
NVIRONMENTAL
M
ONITORING
S
YSTEM
(AEMS)
Toshiba Corporation is providing technical coordination to an international con-
sortium of academic institutions and companies working to develop AEMS, a
continuous, automated monitoring of groundwater pollutants. The consortium
seeks to bring the know-how of its member organizations to the development and
commercialization of a system providing enhanced monitoring and identification
4040_C005.fm Page 307 Wednesday, September 21, 2005 12:28 PM
© 2006 by Taylor & Francis Group, LLC
308
Barrier Systems for Environmental Contaminant Containment & Treatment
of pollutants in the groundwater and subsoil below manufacturing facilities,
including pharmaceutical, chemical, and food-processing facilities. AEMS is
expected to detect and identify leaks of contaminants at the source and in real
time to support the very earliest deployment of measures to clean up polluted
groundwater and soil. In practical applications, AEMS will comprise an array of
on-site biosensor systems installed in wells drilled around a monitored barrier.
These wells feed groundwater samples to the systems and provide the means for
continuous monitoring of groundwater contamination around the designated area.
The biosensor is bio-mimetic and consists of two layers of artificial lipid mem-
branes that are used to evaluate the toxicity of chemicals in the groundwater. The
membranes generate specific responses to different types of organic compounds
in pollutants, allowing identification of hazardous substances. The sensitivity of
the biosensor has been improved to the point where it is capable of detecting
hazardous substances, such as trichloroethylene (TCE), in concentrations as low
as one part per billion (10
–9
or 0.001 milligrams per liter).
5.5.4 A N
EW
DOE B
ARRIER
D
ESIGN
C
ODE
Under the direction of Dr. Thomas W. Fogwell, Scientific Director at Fluor
Hanford, Richland, Washington, a modification of the transport modeling code,
STOMP (Subsurface Transport Over Multiple Phases), is in development in
support of surface barrier designs. The need for a new code is driven by design
requirements for approximately 200 new surface barriers needed to close many
of the waste sites on the Hanford Central Plateau. Several different surface barrier
designs have been proposed based on a graded approach that fits degree of
protection with site risk. There is a clear need to be able to evaluate and compare
design alternatives, while considering waste site-specific needs in view of tech-
nical, regulatory and economic issues. Because all of the designs cannot be built
and evaluated over the appropriate spatial and temporal scales, computational
models offer an opportunity to perform side-by-side comparisons over the design
life for a range of conditions. The overall objectives of this work are as follows:
• Extend the plant-soil atmosphere dynamics module to 3-D space.
• Add capabilities to analyze the effects of dynamic structural and hydrau-
lic properties that may result from deformation. (This will require the
addition of algorithms for static and dynamic localized grid refinement.)
• Calibrate and validate the model using data from Pacific Northwest
National Laboratory’s (PNNL) Field Lysimeter Test Facility (FLTF),
the prototype Hanford Barrier, and other selected experimental capil-
lary barriers in the western U.S.
• Perform a sensitivity analysis to determine the influence of key param-
eters and model discretization on model predictions, and identify the
key model parameters.
• Provide a barrier design tool as well as technical guidance and docu-
mentation to support the preconstruction performance evaluation of
candidate barriers.
4040_C005.fm Page 308 Wednesday, September 21, 2005 12:28 PM
© 2006 by Taylor & Francis Group, LLC
Subsurface Barrier Verification
309
New code to modify STOMP was completed at the end of fiscal year 2003.
The code was calibrated in January and February 2004 and scheduled to be ready
for application by October 2005.
5.6 DRIVERS FOR IMPLEMENTATION
OF NEW APPROACHES
A major issue in verification monitoring technology development is identifying
what motivates stakeholders, end users, and regulators to move from state of the
practice to state of the art. Such drivers are often a reduction in risk and a reduction
in cost. In the realm of subsurface verification, the drivers for change are cost
and development of methods that enable the desired end states for remediation
sites. Only recently has the USDOE begun to design verification systems that
meet or exceed the regulatory requirements for barriers. Most communities still
use old state-of-practice barrier verification systems. This chapter discusses sub-
surface verification and monitoring for several types of barriers: landfill covers,
PRBs, and walls and floors. The discussion here begins with landfill covers, which
to date are the most common containment barrier in use. But first, the drivers for
implementation of new approaches must be explored.
5.6.1 C
OSTS
For the 30 years or more life span of some sites that use covers or other barriers,
long-term monitoring costs can be larger than the initial barrier implementation
costs. The system approach described in Section 5.4.1 allows several opportunities
to affect life-cycle costs of remediation.
This first of these opportunities is optimization. Optimization, with its imbed-
ded use of predictive tools, permits (1) the selection of the parameters to measure,
(2) the selection of the sensitivities of sensors, (3) the location and timing of
monitoring, and (4) the selection of appropriate action criteria. With optimization,
the appropriate actions for a given site can be made, and, therefore, a cookie-
cutter approach need not be followed.
The other major cost opportunity in applying state-of-the-art approaches is
in
situ
physical and chemical analysis. In the mid-1990s, the USDOE was spend-
ing more than $200 million on chemical analysis to support its environmental
management and remediation activities. As an example, the USDOE Savannah
River site (Aiken, South Carolina) requires 40,000 groundwater samples a year
at $100 to $1,000 per sample for off-site analysis (i.e., a total of $4 million to
$40 million per year) (Ho and Lohrstorfer, 2001).
5.6.2 E
NABLING
D
ESIRED
E
ND STATES
Environmental remediation has begun to move toward different end states such
as brownfield rather than greenfield use (reapplication of the remediated lands
for industrial use), wildlife preserves, or other forms of public/private lands.
INEEL led an inter-agency effort to develop the Long-Term Stewardship Science
4040_C005.fm Page 309 Wednesday, September 21, 2005 12:28 PM
© 2006 by Taylor & Francis Group, LLC
310 Barrier Systems for Environmental Contaminant Containment & Treatment
and Technology Roadmap (2001) that suggests that remediated sites will be
transferred to locations that are minimally staffed with remediation personnel or
nonmanned. These sites will be required to be remotely monitor waste movement
by relying on in situ sensors.
5.7 COVERS
This section discusses some potential deployments of the barrier verification
deployment methods is not meant to be exhaustive, but represents some of the
possible configurations to move from state of the practice to state of the art. The
data quality objectives (DQO) of the monitoring systems would need to be clearly
identified, and the methods applied would provide a means of monitoring a landfill
after closure in lieu of certain groundwater monitoring. In addition to this dis-
cussion, two USDOE case histories are portrayed: one in New Mexico and another
in Ohio.
5.7.1 MOVING FROM STATE OF THE PRACTICE TO STATE OF THE ART
5.7.1.1 Methods
A review of other hazardous waste facilities by Everett and Fogwell (2003) shows
that where barrier monitoring is applied below the liner system, the primary
method uses basin lysimeters of variable sizes. Basin lysimeters generally have
proven regulatory acceptance, reduced cost, ease of installation, and the ability
to collect quantifiable results. A typical design would be a basin lysimeter made
up of 100-mil high-density polyethylene (HDPE) installed under the bottom
sump. The lysimeter can extend 1.52 m beyond the perimeter of the bottom sump
and can be designed with an access pipe that allows the removal of any liquid
collected. Due to the lateral flow patterns normally generated near capillary
barriers and those that exist at the interface between contrasting soil textures,
such a basin lysimeter could be expected to detect most leaks in the bottom liner
of a landfill.
Time-proven technologies like neutron moderation can be considered below
the barrier liner systems of cells. As new technologies are developed and old
technologies improved, consideration should be given to deploying or improving
these new options. Particular reference could be made to emerging volume-
integrating technologies like high-resolution resistivity and cross-borehole ERT.
This strategy of being prepared to employ future technologies as they develop
could be facilitated by installing access tubing (probably perforated) beneath the
bottom liners of new construction, providing a relatively inexpensive method of
accommodating new technologies as they become available. Of the new technol-
ogies, those giving volumetric information seem to be the most promising. The
main advantage of such a tubing network would be that ERT methods could be
used to provide a spatial distribution of any detected leakage.
4040_C005.fm Page 310 Wednesday, September 21, 2005 12:28 PM
© 2006 by Taylor & Francis Group, LLC
methods mentioned in Section 5.3 that are applicable to covers. This list of
Subsurface Barrier Verification 311
Even with today’s technologies, horizontally emplaced perforated access
tubes could be used for measuring parameters such as soil moisture movement,
gamma detection, soil pore water sampling, and soil gas. The perforated tool
access tubes should span the entire length of a cell buried in a 1.22- to 1.83-m
deep trenches along the bottom of each cell and located in areas of potential liner
failure. The multi-purpose, perforated access tubes could use the following types
of barrier-monitoring technologies in measuring the above-mentioned parameters:
a neutron probe, a sodium iodide gamma detector, and absorbent pads for eval-
uating soil pore water quality. The value of this monitoring approach is that it
represents a cost-effective graded method that would allow spatial monitoring
below the landfill in order to locate liner failure positions. Soil moisture alone
could be used as a cost-effective sentinel parameter, which could be supported
with other parameters if required. Perforated casing below the landfill might
permit the collection of soil gas samples and could be used as part of a leakage
or performance check of both the barrier liner and the caps.
5.7.1.2 Verification Measurement Systems
Vertically emplaced perforated access tubes (open-holed at bottom) can be
installed (for measuring soil moisture movement, gamma detection, and for col-
lecting soil pore water samples). The access tubes can extend from the surface,
through the barrier closure cover and the waste, but not through the bottom liner.
These access tubes can be used for detecting vertical moisture changes throughout
the waste, function as an access port for various other types of geophysical tools
(e.g., neutron and gamma logging tools), provide access for absorbent pads, and
permit access for direct soil sampling through the open hole at the bottom. It is
imperative that a good seal be completed around the perimeter of the access tubes
to prevent preferential flow between the access tubes and soil material. The
following are other sensors that can be used with such a vertical tube system:
• TDR probe monitoring stations for each vertical access casing can be
installed for measuring volumetric soil moisture.
• Heat dissipation probe monitoring stations (co-located with the TDR
probes) can be installed on each of the vertical access casings to
measure matrix potential, which is the driving force for unsaturated
moisture movement.
• Suction lysimeters in a vertical profile can be installed to collect soil
pore water samples for chemical and radiological analysis.
5.7.1.3 Barrier Cap Monitoring
At closure, instruments should be installed in the final barrier cover to measure
its effectiveness of the cover in restricting moisture movement. There are many
potential designs. Some involve instrumentation of just the cap and some schemes
involve vertical neutron access tubes installed in the cover and through the waste
4040_C005.fm Page 311 Wednesday, September 21, 2005 12:28 PM
© 2006 by Taylor & Francis Group, LLC