Ozone Reaction Kinetics for Water and Wastewater Systems - Chapter 6 ppsx
Bạn đang xem bản rút gọn của tài liệu. Xem và tải ngay bản đầy đủ của tài liệu tại đây (820.85 KB, 37 trang )
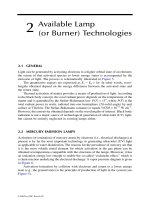
©2004 CRC Press LLC
6
Kinetics of the
Ozonation of
Wastewaters
The application of ozone is not addressed solely to the treatment of natural waters
for the preparation of drinking water. For a long time ozone has been applied to
the treatment of wastewater. Although the general objective of ozonation in waste-
water treatment is disinfection after the secondary biological treatment
1,2
ozone
also plays a variety of other roles, mainly to improve the efficiency of other unit
operations such as coagulation–flocculation–sedimentation
3,4
or carbon filtration;
5,6
remove biologically refractory or toxic compounds to improve biological oxidation
units,
7,8
or reduce the amount of sludge generated in these latter systems.
9,10
Specific
literature concerning the application of ozone in the treatment of wastewater (mainly
industrial wastewater) dates back to the 1970s, when Rice and Browning
11
pub-
lished a compendium of cases of ozone application. Thus, industries related to both
inorganic and organic compounds have used ozone for decontamination or disin-
fection purposes. Rice and Browning
11
classified these industries in 21 categories
as listed in Table 6.1. Also, other wastewater such as those produced in the pesticide
manufacturing and use, rinsing of wood chips contaminated with pentachlorophenol
or other wastes containing 1,4-dioxane, marine aquaria, swine marine slurries from
stored livestock wastes, leachates, etc., have been treated with ozone.
12–17
Among
the numerous industrial wastewater mentioned, ozone is specially applied to those
containing phenols that are present in numerous industrial processes (coke plants,
petroleum refinery, plastics, pulp and paper, textiles, soaps and detergents, food
and beverage, etc.). Other wastewater containing surfactant compounds and dyes
have also been treated with ozone.
18,19
In Table 6.2 a list of recent papers of the
last 7 years dealing with the use of ozone in wastewater treatment is presented.
Many compounds present in most of these wastewaters do directly react with ozone
in reactions with very high rate constants. Thus, one expects that ozone is a truly
recommended oxidant to reduce or even eliminate the contamination of these
wastewater. However, a rather different result would be obtained if ozonation is
applied as the main operation to decontaminate wastewater. The problem of ozone
use in wastewater arises from two facts: the high concentration of fast ozone reacting
compounds (phenols, dyes, some surfactants of benzene sulphonate acid type, etc.)
and the presence of other substances (i.e. salts, carbonates, etc.). On one hand, the
high concentration of fast ozone reacting compounds makes mass transfer limit the
ozonation rate (see later Table 6.3) and, on the other hand, the presence of ozone
decomposition–inhibiting compounds or hydroxyl free–radical scavengers stops the
ozonation rate when ozone indirect reactions are the main way of pollutant
©2004 CRC Press LLC
removal (a situation that happens when the concentration of fast ozone-reacting
compounds have been reduced so that the kinetic regime of their ozonation reactions
becomes slow). As a result, ozonation is not usually a cost-effective technology if
used as the main treatment operation of wastewater due to the high amount of ozone
needed. As a consequence, ozone is recommended in wastewater treatment as a
complementary agent of other processes to mainly increase biodegradability, reduce
toxicity of recalcitrant compounds, etc.
67
TABLE 6.1
List of Wastewater Treated with Ozone According to Rice and Browning
11
Industry Objectives or Compounds Present
Aquaculture Shellfish depuration, marine water quality, disease prevention, toxicity
Electric power
manufacturing
Biofouling control
Electroplating Removal of cyanides and cyanates. Metal complexe cyanides with O
3
/UV
Food and kindred products Sterilization of water for bottle washing, COD reduction of brines,
disinfection of processing water
Hospital wastewater Shower, operating room, kitchen, chemical lab, x-ray lab. Target COD
for water reuse = 10 mgL
–1
Municipal wastewater,
Inorganics containing water
Chloro–alkali production
Removal of Fe and Mn, heavy metals: Hg, Cr(III), ammonia (among
others)
Iron and steel, coke plants Cyanides, cyanates, phenols, sulfide (among other)
Leather tanneries Removal of colorants, sulfide
Organic chemical
manufacturing plants
Salicylic acid, caprolactam synthesis, alkylamines, organic dyes,
chelating agents, etc.
Paints and varnishes Phenols, methylene chloride
Petroleum refineries Oils, hydrocarbons, nitroaromatics, phenols, ammonia, mercaptans, etc
Pharmaceutical industries Little information available
Photoprocessing Surfactants, sulfate, phosphates, cyanates, heavy metals
Plastics and resins Phenol, formaldehyde, synthetic polmers (unsaturated organics,
alkylnaphthalene sulfonates), leathers (Zn, phenols.), rubber (olefins,
mercaptans.)
Pulp and paper Bleaching, odor control, mill wastewater treatment, spent sulfite liquor
treatment
Soaps and detergents Alkylbenzene sulfonate surfactants, reduce foaming
Textiles Organic dyestuff, sizing agents, surfactants, organic and inorganic acids,
azoic dyes, azobenzenes
a
Phenols were also classified as an independent group due to their importance in many wastewater
treatment industries as shown above.
Source:
From Rice, R.G. and Browning, M.E.,
Ozone Treatment of Industrial Wastewater
, Noyes Data
Corporation, Park Ridge, N.J., 1981.
©2004 CRC Press LLC
TABLE 6.2
Recent Literature concerning Works on Wastewater Ozonation
Wastewater Type Reacting Features
Reference #
and Year
Textile and dye effluent
combined with
domestic effluent
Pilot plant system: 3 contact columns, pH 7–7.4, Anionic
surfactants and non-ionic detergents: 3–4 , COD: 150–200
19, 1995
Pulp mill effluents Batch and semicontinuous ozonation, Filtrate bleaching
process wastewater COD = 3060, BOD
5
= 540, pH 9.65;
Aerated stabilization basin wastewater: COD = 1440,
BOD
5
= 25, pH 7.1
20, 1995
Oil shale Semibatch ozonation, pH 10, COD: 4000, BOD
5
/COD: 0.23,
Phenols: 450, O
3
/H
2
O
2
, and other AOP tested
21, 1995
Mechanical and
chemical pulp mill
Semibatch ozonation, pH 7 (adjusted). Different effluents:
COD: 1723–615, BOD: 281–708, Toxicity reduction
8, 1996
Printed circuit board
rinse water
Batch ozonation, Compounds: thiourea, Na gluconate,
nitrilotriacetic acid, COD: 45, TOC: 13, O
3
/H
2
O
2
and
catalytic ozonation
22, 1997
Swine manure wastes Semibatch ozonation, COD: 54200, BOD
5
: 29800, pH 7,
Compounds present: Volatile fatty acids, phenolics,
indolics, ammonia, sulfide, phosphates
23, 1997
Pharmaceutical effluents AOP treatments: Fenton, O
3
/UV, H
2
O
2
/UV, semibatch
ozonation, COD: 670–2700, AOX: 3–5
24, 1997
Boiling feed water in
power plant
Real water treatment plant, pH 6.3–7, COD: 1–10, TOC:
1.5–4, Fe, Mn, chlorides, sulfates, nitrates. O
3
, and O
3
/H
2
O
2
25, 1997
Dental surgery Disinfection 26, 1997
Dyes Pilot plant, COD: 1071, BOD: 348, Ammonia: 21, different
dyes: reactive, disperse, sulfur, acid, direct
27, 1998
Landfill leachates Semibatch ozonation, COD: 45000–700, pH 5.4–6 16, 1998
Domestic plus industrial Coagulation aid, COD: 480, TSS: 110, pH 8.4 28, 1998
Sewage Reduce sludge production, TOC: 200, MLSS in aeration
tank: 1500–2500; intermitent and continuous ozonation
9, 1998
Municipal Pilot plant ozonation, UV, O
3
, peracetic acid, Disinfection,
economics, pH 6.7–8, DOC: 3–24
29, 1999
Membrane Textile
effluent
Batch ozonation, COD: 595, BOD
5
: 0, pH: 7.95, non-ionic
surfactants, aldehydes
30, 1999
Synthetic dyehouse
effluent
40-fold diluted dyebath: DOC: 25, pH: 10.94, different dyes
and also: urea, chloride, carbonate. O
3
, O
3
/H
2
O
2
, H
2
O
2
/UV,
Semibatch ozonation
13, 1999
Sludge reduction Sludge ozonation to solubization, 31, 1999
Table olive Semibatch ozonation, Different AOP (O
3
, O
3
/H
2
O
2
, O
3
/UV),
COD: 19–25, BOD
5
: 2–4.3, pH 13, Biodegradability
variation
32, 1999
Textile Semibatch ozonation, O
3
, O
3
/H
2
O
2
, COD: 320, BOD
5
:
42–64, pH 8.2
33, 1999
Domestic Continuous pilot plant ozonation plus biological aerobic
oxidation, COD: 294, BOD
5
: 170, pH: 7.2–7.6
34, 35, 1999
©2004 CRC Press LLC
TABLE 6.2 (continued)
Recent Literature concerning Works on Wastewater Ozonation
Wastewater Type Reacting Features
Reference #
and Year
Wine distillery plus
domestic sewage
Semibatch ozonation plus biological aerobic oxidation,
COD: 21700–300, BOD
5
: 13440–187, pH 5.4–10, Kinetic
study, biodegradability
36, 37, 1999
Domestic Batch ozonation, COD: 380, BOD
5
: 218, pH: 7.6, Improve
sedimentation
38, 1999
Domestic Semibatch pilot plant, pH 7.6–8.6, DOC: 7–16, Bromide:
3.48–10.1, Total coliforms: 1380–4550. Disinfection for
reuse in agriculture
39, 2000
Pharmaceutical Semibatch ozonation. O
3
, O
3
/H
2
O
2
, Different compounds:
acetylsalicilic, clofibric acid, diclofenac, ibuprofen: 2
µ
gL
1
,
pH 7, 10ºC
40, 2000
Pulp mill Batch and semibatch ozonation, pH 2–10,
Ethylenediaminetetracetic acid (EDTA): 10–1000
41, 2000
Sludge from anaerobic
degradation
Batch and continuous ozonation, Reduce sludge by partial
oxidation, TCOD: 7900, TOC: 2900, SS: 9000
42, 2000
Dyeing and laundering Dyeing: Anionic detergent: 142, COD: 440, chlorides: 8000,
pH 7.5, Laundering: COD: 1650, anionic detergents: 110,
Non-ionic detergents: 680, pH 10. Different AOP treatments
43, 2000
Agroindustrial-domestic Continouous pilot ozonation plus aerobic biological
oxidation, COD: 2250, BOD
5
: 1344, pH: 3–7
44, 2000
Table olive plus domestic Semibatch ozonation plus aerobic biological oxidation,
COD: 1110, BOD
5
: 570, Nitrites, ammonia n-phenolics,
pH 11.1
45, 2000
Olive oil and table olive
plus domestic
Semibatch pH sequential ozonation, Olive oil ww: COD
1465, BOD
5
: 1240, pH 5.8; Table olive ww: COD: 1450,
BOD
5
: 910, pH: 11.3, nitrites, ammonia, phenolics, Ozone
with pH cycles
46, 2000
Petrochemical Ozone plus biological activated carbon. Wastewater: Benzoic
acid and aminobenzoic acid: 500, acrylonitrile: 100, pH 7.
7, 2001
Manufacturing dyes Ozone as pretretment of biological oxidation, semibatch
ozonation, 3-methyl pyridine: 10
–3
–10
–4
M, pH 4–6. Kinetic
study
47, 2001
Cherry stillage (2 times
diluted)
Semibatch ozonation plus aerobic biological oxidation,
COD: 145–180, BOD
5
100–140, pH 3.8
48, 2001
Wine distillery and
domestic
Semibatch pH sequential ozonation, Domestic ww: COD:
300, BOD
5
: 160, pH 7.6; Distillery ww: COD: 2500, BOD
5
:
1340, pH 3.5, Ozone with pH cycles
49, 2001
Landfill leachate Semibatch ozonation, pH 8.3, COD: 1400, BOD
5
: 170, SS: 270 50, 2001
Dyes production Semibatch ozonation, Different dyes, COD: 18400–2420,
pH: 0.5–9.3 depending on the dye type. O
3
/H
2
O
2
and Fenton
51, 2001
Textile Different AOP treatments, Improve biodegradability, COD:
2154, BOD
5
: 1050, TOC: 932, Antraquinone, anionic
detergent, alkylnaphthalensulfonate, chlorides
52, 2001
©2004 CRC Press LLC
TABLE 6.2 (continued)
Recent Literature concerning Works on Wastewater Ozonation
Wastewater Type Reacting Features
Reference #
and Year
Domestic plus dyestuff Pilot plant ozonation, COD: 234–38, BOD
5
: 5.6–27, SS:
69–12, pH 7.1–7.7, Different dyestuff
53, 2001
Mechanical pulp
production
Semibatch ozonation, Wet air oxidation, COD: 1600–16500,
TOC: 6100–6700, pH 4.8–6.5, tannin+lignin acids, fatty
acids, sterols, triglycerides among others
54, 2001
Fruit Cannery effluent Semibatch ozonation, COD: 12000–45000, pH 9.8–13.5: O
3
,
O
3
/H
2
O
2
, Activated carbon
55, 2001
Kraft pulp mill effluent Pilot plant impinging jet bubble ozone column, COD:
750–681, BOD
5
: 21.5–18.8, pH: 7.6, Aromatic halogen and
color causing compounds
56, 2001
Secondary and terciary
domestic effluents
Pilot plant ozonation, COD: 30–71, TOC: 0 < 10–26, pH:
7–7.5, Different fecal microorganisms. Disinfection for
reuse
57, 2002
Paper pulp effluents Semibatch ozonation, 10 different AOP applied, COD: 1384,
TOC: 441, pH 10, comparison and cost estimation
58, 2002
Reactive dyebath effluent Semibatch ozonation, Comparison of AOPs (O
3
, UV/H
2
O
2
,
UV/TiO
2
), 15-fold dilution, TOC: 46.8, AOX: 0.102,
carbonates: 490.6, pH 10.9, Different dyebath
18, 2002
Textile effluent Packed bed (raschig ring) ozone continuous flow column,
COD: 1512, BOD: 90.6, pH 10.9. Reductions of COD, pH.
Phytotocicity reduction.
59, 2002
Domestic sludge Cylindrical bubble column. MLSS: 10100 with 73% VSS.
Ozone dosage: 0.01–2 g/gMLSS. Significant
mineralization at high ozone dosage and solubilization at
low ozone dosage
60, 2002
Fruit cannery (FC) and
winery (W) effluents
anaerobically treated
After anaerobic oxidation: FC: COD: 525–750, W: COD:
148–370. Ozone and ozone/hydrogen peroxide treatment
in continuous flow bubble column plus GAC adsorption in
fixed bed column. COD and colour reductions followed.
61, 2002
Industrial landfill
leachates
Treatments: Ozone, ozone/hydrogen peroxide, hydrogen
peroxide. Semibatch bubble column. Biological oxidation
postreatment. BOD/COD = 0.05, COD: 390–560. Increases
of biodegradability and up to 50% COD reduction.
62, 2002
Pharmaceutical effluent Semibatch bubble column, Values of biologically treated
wastewater: COD: 8034, BOD: 3810, pH 8.7. Significant
UV absorbance reductions.
63, 2002
Log yard run-off Pre- and post-ozonation of biological oxidation. Magnetically
semibatch tank reactor. BOD: N: P: 100: 5: 1, MLSS: 2500:
Ozone reduces COD (22%) and increases BOD (38%)
64, 2002
Domestic effluent Activated sludge ozonation. Sludge periodically treated with
ozone in a semibatch tank. 75% reduction with 0.05
gO
3
/gVSS. Biological reactor: residence time: 10 d, 2 gL
–1
SS. Slight increase of COD
65, 2002
©2004 CRC Press LLC
6.1 REACTIVITY OF OZONE IN WASTEWATER
In ozonation processes, the nature of compounds present in water will determine
the degree of reactivity with ozone. Thus, compounds with specific functional groups
(aromatic rings, unsaturated hydrocarbons, etc.) are prone to ozone attack while
other compounds (saturated hydrocarbons, alcohols, aldehydes, etc.) can be consid-
ered refractory to the ozone attack. In these cases, however, the second type of ozone
reaction (indirect reactions) can play an important role, although this will also depend
on the concentration of fast ozone-reacting compounds (kinetic regime) and hydroxyl
radicals, and the way they are generated, inhibiting substances and pH of water.
According to these comments, when ozone is applied to a real wastewater there will
likely be numerous series-parallel ozone reactions depending on the wastewater
complexity. If the presence of initiators, promoters, and inhibitors is of great impor-
tance in the treatment of natural water, the unknown nature and concentration of
these compounds and others that directly react with ozone constitute the main
problem to study not only the kinetics of wastewater but also to predict ozonation
efficiency. Knowledge of the composition of the wastewater results is fundamental
to make any predictions about the ozone reactivity and potential application. In
addition, pH and concentration of the compounds present in the wastewater are other
key factors for further kinetic studies.
The chemical composition of the wastewater determines its potential reactivity
with ozone. Table 6.3 gives values of the Hatta number of some ozone direct reactions
with compounds that could be present in wastewater and the kinetic regime of these
ozonation processes. Also, information is given about the recommended ozone
system that should be applied to improve as much as possible the pollutant removal
rate. As can be deduced from Table 6.3 pH, concentration, and nature of pollutants
are major factors affecting the recommended action. Some of these compounds
dissociate in water when pH is increased, enhancing the ozonation rate (see Chapter
2). In these cases, mass transfer limitation constitutes the major problem and ozone
feeding devices are key factors affecting the performance of the ozonation rate. Other
compounds such as pesticides are usually present at low concentration (ppm or ppb
level) due to solubility limitations. In these cases, chemical ozone reactions control
TABLE 6.2 (continued)
Recent Literature concerning Works on Wastewater Ozonation
Wastewater Type Reacting Features
Reference #
and Year
Pharmaceutical effluent Synthetic wastewater prepared from antibiotics. COD: 900,
1.5-L semibatch bubble column. Effects of pH and addition
of hydrogen peroxide. Increases of BOD/COD
66, 2003
Units in mgL
–1
©2004 CRC Press LLC
TABLE 6.3
Reactivity and Kinetic Regimes of Industrial Wastewater Ozonation Related
to the Presence of Some Specific Contaminants
Wastewater Type
Specific
Contaminant
Concentration, pH and
Rate Data
Hatta Number,
Kinetic Regime, and
Action to Take
Ash dump
21
Phenolics Hundreds of mgL
–1
, pH = 12,
k
= 1.8
×
10
7
68
Ha
> 10, Instantaneous,
DW, AOP NR.
Swine manure
wastes
23
Odor compounds:
p-cresol
Sulfides
Few to tens mgL
–1
, pH 7,
k
=
7.5
×
10
5
(of O
3
-o-cresol
reaction) 69]
Tens of mgL
–1
, pH 7,
k
= 3
×
10
9
70
Ha
< 10, Fast to moderate
regime, DW, AOP NR
Ha
> 10, Fast to
Instantaneous regime,
DW, AOP NR
Pharmaceutical
24
AOXs:
Chlorophenol
Heptachlor
Few mgL
–1
, pH 7,
k
= 10
8
68]
Hundreds
µ
gL
–1
, pH 7,
k
=
90
71
3 <
Ha
< 10, Fast pseudo
first order regime, DW,
AOP NR
Ha
< 0.1, Slow regime, IW,
AOP R
Pulp mill
41
EDTA Hundreds mgL
–1
, pH 8,
k
=
20000 (O
3
-dimethylamine
reaction)
68
Ha
< 0.5, Moderate regime,
Mainly IW, AOP R
Textile
18,43,52
Azoic dyes Few to tens mgL
–1
, pH 10,
k
= 10
8
72
3 <
Ha
< 10, Fast regime,
DW, AOP NR
Table Olive
45
Phenolics Hundreds to thousands of
mgL
–1
, pH 12.9,
k
= 1.8
×
10
7
(O
3
-phenol reaction)
68
3 <
Ha
< 20, Likely fast
regime, DW, AOP NR
Olive Oil
46
Phenolics Thousands of mgL
–1
, pH 4.9,
k = 5 × 10
4
(O
3
-phenol
reaction)
68
1 < Ha < 5, Moderate to fast
regime, DW, AOP NR
Petrochemical
7
Benzoic acid Hundreds of mgL
–1
, pH 7,
k < 0.15 (p-chlorobenzoic-
O
3
reaction)
68
Ha < 0.01 Very slow
regime, IW, AOP R
Herbicide
manufacturing
Atrazine and others Tens to thousands µgL
–1
,
pH 7, k < 10
73
Ha < 0.01, Very slow
regime, IW, AOP R
Electroplating,
photoprocessing
11
Cyanides Tens of mgL
–1
, pH 10, k =
10
5
70
Ha < 3, Moderate regime,
DW, AOP only for
complex cyanides
Petrochemical PAHs: phenanthrene Tens to thousands µgL
–1
,
pH 7, k = 3000 74]
Ha < 0.01, Slow regime,
IW, AOP R
Municipal Ammonia
Detergents: NaDBS
Tens to hundreds mgL
–1
,
pH 7, k < 1 70]
Few mgL
–1
, pH = 7, k < 5
75
Ha < 0.001, Very slow
regime, IW, AOP R
Ha < 0.001, Very slow
regime, IW, AOP R
Explosives Nitrotoluenes Few mgL
–1
, pH 7, k < 10
76
Ha < 0.01, Slow regime,
IW, AOP R
©2004 CRC Press LLC
the process rate, and advanced oxidation processes are recommended (i.e., O
3
/H
2
O
2
).
As will be shown in Chapter 7, when ozone reactions develop in the slow kinetic
regime (chemical control) the indirect ozone reactions usually predominate. How-
ever, the presence of hydroxyl radical scavengers needs to be considered as a limiting
step. Also, the case of volatile compounds (benzene, toluene, trichloroethylene, etc.)
is particularly important since volatility could constitute an important way of pol-
lutant removal. For example, in some work
78
volatility constituted the main way of
trichloroethane removal in an ozonation process. Then, in these cases caution should
also be taken regarding the possible waste of ozone.
Although ozone reactivity with single compounds present in wastewater (Table 6.3)
can be predicted, classification of all wastewater regarding its reactivity with ozone
is a rather difficult, if not unrealistic, task. However, as a general rule, high concen-
tration of pollutants would suggest high reactivity with ozone (which is an indication
of fast kinetic regime and ozone direct reactions) and low concentration usually
means low ozone reactivity and, hence, a factor that favors the development of ozone
indirect reactions.
6.2 CRITICAL CONCENTRATION OF WASTEWATER
Because of the changing nature of compounds present in wastewater while undergoing
ozonation (i.e., phenols becomes unsaturated carboxylic acids and then aldehydes,
saturated carboxylic acids, ketones, etc.), the reactivity in terms of kinetic regime of
ozonation usually changes from fast to slow. Knowledge of the critical concentration
TABLE 6.3 (continued)
Reactivity and Kinetic Regimes of Industrial Wastewater Ozonation Related
to the Presence of Some Specific Contaminants
Wastewater Type
Specific
Contaminant
Concentration, pH and
Rate Data
Hatta Number,
Kinetic Regime, and
Action to Take
Gasoline tank
leaking
Petroleum industry
BTEX: Benzene,
toluene,
ethylbenzene,
xylene
Few µgL
–1
, pH 7, k < 100
77
Ha < 0.001, Very slow
regime, IW, AOP R
Chemical processes 1,4-dioxane Hundreds µgL
–1
, pH 7, k =
0.32
77
Ha < 0.001, Very slow
regime, IW, AOP R
Chemical
industries:
Groundwater
Low molecular
weight
organohalogens:
TCE, PCE, DCE
Few to hundreds of µgL
–1
,
pH 7, k < 100
77
Ha < 0.001, Very slow
regime, IW, AOP R
Units of k in M
–1
s
–1
, Ha: Hatta number (k
L
= 5 × 10
–4
ms
–1
and D
O3
= 10
–9
m
2
s
–1
to determine Ha). DW:
Process through direct way of ozone, IW: Process through indirect way of ozone, AOP NR: Advanced
oxidation process not recommended (see Chapter 7), AOP R: Advanced oxidation process recommended
(see Chapter 7).
©2004 CRC Press LLC
value of any wastewater to change from one degree of ozone reactivity to the other
depends on the nature of the wastewater and can be known from laboratory exper-
imental results. When ozone is applied to some wastewater in a semibatch well-
agitated tank, the pollution concentration (measured as chemical oxygen demand,
COD) vs. time data usually takes the trend plotted in Figure 6.1. In most cases, two
reaction periods will be noted: the first initial period of high ozonation rate where
the pollution concentration rapidly falls, and a second period where the ozonation
rate is continuously decreasing with time until the ozonation rate is stopped with
the pollution concentration reaching a plateau value. The critical pollution concen-
tration would be that corresponding to the time when both periods coincide (about
10 min in Figure 6.1). In most cases, the pollution of wastewater during the first
period is removed through direct ozone reactions that usually develop in the fast
kinetic regimes of ozonation. In these cases, the absence of dissolved ozone is a
clear indication that a fast or instantaneous kinetic regime of ozonation develops
(see Chapter 4). For the second period, ozone likely decomposes in hydroxyl radicals
and pollution is mainly removed through indirect ozone reactions. In this second
period, ozonation reactions develop in the slow kinetic regime and removal of COD
is carried out at a lower rate because carbonate/bicarbonate ions have been formed
as a result of partial mineralization during the initial fast reaction period. It should
be mentioned, however, that in some cases only one reaction period seems to develop,
depending on the nature of wastewater as will be shown in section 6.4. In any case,
and as a general rule, it can be said that high polluted wastewater ozonation is
accomplished through fast kinetic regime ozone direct reactions, while low polluted
wastewater ozonation develops through slow kinetic regime ozone indirect reactions.
6.3 CHARACTERIZATION OF WASTEWATER
Through wastewater characterization, the nature of the reactions that ozone would undergo
in the wastewater can be established. As shown above, the ozone reactivity depends on
the concentration (and also nature) of pollutants present in wastewater. However, in
FIGURE 6.1 Typical profiles of COD with time in ozonation experiments of industrial
wastewaters showing the critical concentration point (values of COD and time in x and y axis
present arbitrary values).
Time, min
0 10 20 30 40 50 60
0
200
400
600
800
1000
COD, mgL
–1
Critical point
©2004 CRC Press LLC
real wastewater the actual pollution concentration is unknown and surrogate parameters
(chemical oxygen demand, COD, total organic carbon, TOC, etc.) are used to express the
pollution concentration. The magnitude of these parameters, especially COD, gives an
estimate about the potential ozone reactivity.
In addition to COD and TOC (this latter more commonly used in natural water),
other parameters are employed to measure the degree of pollution. Among these
parameters can be listed biological oxygen demand (BOD) and the measurement of
wastewater absorptivity in the UV-C region, specifically at 254 nm wavelength (A
254
).
Another parameter that can be used is the mean oxidation number of carbon (MOC)
that combines the values of COD and TOC to yield more reliable data on pollution
concentration (specially during oxidation processes) avoiding the difficulties that
some refractory compounds to COD determination present. Methods to measure any
of these parameters can be followed elsewhere with the aid of detailed protocols
issued by APHA, DIN, etc.
79,80
Here, a short explanation of the importance and
application in water and/or wastewater of these parameters is given.
6.3.1 THE CHEMICAL OXYGEN DEMAND
There is no doubt COD is the most general parameter to follow the pollution
concentration of water in a given physical, chemical, or even biological process
treatment. COD, in addition, gives a quantitative measurement about the depth of
any chemical or biological oxidation step in the treatment of wastewater. This
parameter, therefore, has been continuously applied to kinetic studies in water and
wastewater treatment (such as ozonation) because, as a difference of other parameters
like TOC (see later), COD supplies information on the magnitude of oxidation steps.
COD represents the amount of oxygen needed for complete mineralization of the
matter present in water through chemical oxidation. Also, it is used as a general
parameter to express the variation in pollution concentration in physical–chemical
processes such as flocculation–coagulation–sedimentation, filtration, etc. Thus, pol-
lution concentration is measured in terms of mg oxygen units per liter of water.
The proportionality between pollution concentration and COD is obtained once
the theoretical oxygen demand, ThOD, is accounted for. Thus, this latter parameter
represents the amount of oxygen needed to remove 1 mg of pollution. Then, pollution
concentration in mg/l is simply the ratio between COD and ThOD:
(6.1)
COD, however, has some limitations derived from the presence in water or waste-
water of compounds totally or partially refractory to chemical oxidation with dichro-
mate, the chemical oxidant generally used in the analytical method, or volatile com-
pounds that, during COD analysis, stay in the gas phase (COD analysis implies reflux
methods). Examples of these compounds can be cyclohexane, tetrachloroethylene,
pyridine, potassium cyanide, nitrate, etc.
81
Another problem stems from the contrary
situation: the presence of compounds that consume dichromate but should not be
C mg L
COD mgO L
ThOD mgO mg
2
2
()
=
()
()
©2004 CRC Press LLC
considered as a fraction of the pollution concentration. These include hydrogen per-
oxide and/or chloride ions. The former is generated in water when ozonation is applied,
or may be added to the water when the combination between ozone and hydrogen
peroxide is used. The second one, chloride ion, is common in wastewater. These
problems likely can be overcome with the use of complementary agents, such as
mercuric salts that are added previous to the COD analysis to precipitate chlorides.
81
The problem of hydrogen peroxide can be solved by first conducting determinations
about the amount of COD due to different concentrations of hydrogen peroxide. This
COD must be subtracted from the COD of the wastewater sample.
82
6.3.2 THE BIOLOGICAL OXYGEN DEMAND
Similar to COD, BOD represents a measurement of the pollution in a given waste-
water but refers to the biodegrable matter . It gives the amount of oxygen needed
for microorganisms that may be added to the water sample to biodegrade the matter
in water. It is, then, a parameter mostly applied to biological systems but it is also
measured after other water treatment units (i.e., ozonation) that are used previously
to the biological or secondary treatment. The measure of BOD is generally made
after 5 d of digestion (see Reference 79 as an example for the detailed analytical
method). Shorter times do not warrant 100% biodegradation and longer times could
involve the development of other phenomena that also consume oxygen like nitrifi-
cation. In any case, however, BOD is not an absolute measurement of the biode-
gradability of water because it depends on the capacity of microorganisms added or
already present in the water sample to aerobically digest the matter. In this respect,
it is noted that there can be two measurements of BOD, the total biological chemical
demand where the presence of particulate matter is accounted for and the BOD that
refers to the dissolved matter. The particulate matter refers to that retained in 0.45 µm
pore diameter filters.
As far as biodegradability is concerned, the ratio BOD/COD is a more convenient
parameter because it takes into account the total amount of pollution the water contains
measured as COD. Thus, multiple works express the biodegradability of a water sample
with the combined used of BOD and COD
32,35,42
especially to indicate changes in
biodegradability due to the application of a given treatment (see Section 6.5).
6.3.3 TOTAL ORGANIC CARBON
This is another very used general parameter that represents the total amount of
organically bounded carbon present in dissolved and particulate matter in water. The
analytical method involves the transformation (through UV radiation, chemical
oxidation, or combined methods) of organic carbon in carbon dioxide which is
measured directly by a nondispersive infrared analyzer.
In many cases the particulate matter (retained in a 0.45 µm pore diameter filter)
is removed and the measurement corresponds to the dissolved organic carbon, DOC.
This is the usual TOC value in laboratory-prepared water, where dissolved model
compounds are the only species present in the aqueous sample. The particulate or
suspended organic carbon is named SOC. In addition, to TOC and DOC, another
©2004 CRC Press LLC
measurement corresponds to the inorganic carbon, IC, due to carbonate and bicar-
bonate ions and dissolved carbon dioxide. Also, if the sample contains volatile
organic substances, their corresponding carbon measurement represents the purge-
able organic carbon, POC, which is also a fraction of TOC. In summary, carbon
content of water involves the following parameters: TOC, DOC, IC, SOC, POC, and
NPOC (nonpurgeable organic carbon). Detailed protocols to measure the different
forms of carbon can be found elsewhere.
79
Although TOC or DOC yields the quantity of organic matter transformed in
CO
2
, it is not a recommended parameter to follow any oxidation kinetics, such as
ozonation kinetics, because it does not give a quantitative value on the oxidation
evolution. This is very often observed when studying ozonation processes. In ozo-
nation, TOC hardly diminishes with time in many cases, but COD usually does. For
example, COD is able to measure the change that occurs when phenol is oxidized
to maleic acid and other compounds (COD measurements before and after oxidation,
give the oxygen needed for this change), but the corresponding TOC values likely
remain the same. Then, according to TOC measurements no significant changes
would occur, but the actual situation is that phenol has really become maleic acid
and other compounds. On the contrary, TOC gives a measure of the mineralization
achieved in the ozonation process.
6.3.4 ABSORPTIVITY AT 254 NM (A254)
This parameter represents a partial measurement of the pollution concentration of
the water/wastewater. It specifically gives a measure of the amount of aromatic and
unsaturated compounds in water. This parameter is often used in natural water to
measure the concentration of compounds that are assumed precursors of trihalo-
methanes and other organochlorine compounds (i.e., chloroacetic acids, among
others) when water is chlorinated.
83
These precursors are usually called humic
substances formed by macromolecules containing aromatic structures that absorb
254 nm UV radiation. The A254 parameter is also useful to wastewater containing
phenol compounds.
34,45
6.3.5 MEAN OXIDATION NUMBER OF CARBON
This parameter also allows the depth of oxidation to be followed by measuring the
oxidation state of carbon atoms in any molecule considered. First proposed by
Stumm and Morgan
84
and later modified by Mantzavinos et al.,
85
who called it the
mean oxidation state of carbon, it finally was renamed by Vogel et al.
81
as the mean
oxidation number of carbon (MOC). MOC is based on the change of oxidation
number of carbon atoms in a molecule when subjected to oxidation. For a given
organic molecule, MOC is defined as follows:
81
(6.2)MOC =
=
∑
OC
n
i
i
n
1
©2004 CRC Press LLC
where OC
i
is the oxidation number of the i-th carbon atom and n the number of
carbon atoms in the molecule. In a solution containing j different molecules, the
mean oxidation number is:
81
(6.3)
where subindex j represents any molecule present in solution and C
j
, MOC
j
, and n
j
their corresponding concentration, mean oxidation number, and number of carbon
atoms, respectively. It is evident that both in drinking water and, especially, waste-
water, the concentration of many compounds present is unknown so that MOC
m
is
a rather unpractical parameter. Then, it is defined the mean oxidation number of
carbon of the water content, MOC
w
:
81
(6.4)
where M
C
and M
O
2
are the atomic mass of carbon and molecular mass of oxygen,
respectively, and COD
org
refers to the chemical oxygen demand of organic com-
pounds. As can be deduced from Equation (6.4) MOC
w
also presents some drawbacks
derived from the presence of inorganic substances that can be oxidised (i.e., nitrites
to nitrates) or to the presence of N, S, P heteroatoms bonded to carbon atoms in the
organic compound molecules. Thus, Equation (6.4) is deduced by considering that
carbon atoms are exclusively bonded to H and O atoms because it is assumed that
only carbon atoms are oxidized. However, the presence of N, S or P atoms bonded
to carbons could also consume oxidant as is the case of the oxidation of nitrobenzene
where the nitrogen atom goes from the nitro group to the nitrate ion group, that is,
the oxidation number varies from +3 to +5. Chloro substituting groups also present
this problem: the chlorine atom also consumes oxygen, so that, using Equation (6.4)
with the experimentally measured COD to determine the MOC
w
value will yield
values lower than the true one. Applications of MOC
w
in water and wastewater
treatment processes are described in detailed elsewhere.
81
6.4 IMPORTANCE OF pH IN WASTEWATER OZONATION
In ozonation systems pH usually exerts a positive effect on the COD removal rate. This
effect is due to two circumstances: the presence of dissociating compounds that react
fast with ozone (phenol or aromatic amine compounds) and, in the absence of high
concentrations of these compounds, the increase of ozone decomposition to generate
hydroxyl radicals. From these comments it is deduced that any increase of COD
removal during wastewater ozonation at increasing pH can be due to both the direct
MOC
MOC
m
jjj
j
m
jj
j
m
Cn
Cn
=
=
=
∑
∑
1
1
MOC
COD
TOC
COD
TOC
w
C
O
org org
M
M
=− =−4
4
415
2
.
©2004 CRC Press LLC
or indirect reactions of ozone. This contradictory behavior, however, can easily be
explained as follows. Direct reactions can be responsible for the increase of COD
removal because of the increase of the rate constant of the reactions between ozone
and dissociating compounds in wastewater. To give an example, the case of a wastewater
containing phenol can be considered. At pH 4 the rate constant is about 10000 M
–1
s
–1
but at pH 9 the rate constant increase up to approximately 10
9
M
–1
s
–1 68
(see also Chapter
3). In the absence of ozone fast reacting compounds the increase of pH gives rise to
the appearance of hydroxyl radicals because ozone preferentially decomposes in waste-
water (there is no compounds to directly react with ozone). In these cases the use of
ozone combined oxidations (AOPs) can be recommended. In Chapter 7, conditions to
establish the relative importance of direct and indirect reactions will be given. In any
case, another general rule of ozonation, relative to the pH value, is that at pH lower
than 12 (see Section 7.1) ozone will only be consumed through direct reactions in very
concentrated wastewater when ozone fast reacting compounds are present in high
concentration.
In some cases, however, the pH effect is not evident as it could be expected.
Also, the existence of both reaction periods as indicated in section 6.2. is something
misleading. For example, let us take the case of the ozonation of a domestic waste-
water. This wastewater, as many other, usually contains important amounts of car-
bonates that inhibit the indirect ozone reactions. In Figure 6.2 the evolution of COD
with time during the ozonation of such a type of wastewater is shown at different
pH values (wastewater were buffered). By looking at the experimental results, two
observations can be made: First, the position of critical point that represents the initial
fast COD drop with time (first fast-reacting period) compared to the slower second
one is not as evident as it could be expected according to the above comments and,
Second, there is no influence of pH. Generally, the increase of pH leads to an increase
of the ozonation rate, and hence to an increase of COD removal rate as explained
above. It is evident that at pH 4 ozone direct reactions are the only way of COD
removal, so that, in accordance with the results from Figure 6.2, the absence of pH
effect could mean the absence of ozone indirect reactions, a conclusion that does not
support the two-period proposition. However, if wastewater is decarbonated before
FIGURE 6.2 Effect of pH on the COD variation with time during the ozonation of a domestic
buffered wastewater: COD
0
= 275 mgL
–1
.
Time, min
0 10 20 30 40
0.7
0.75
0.8
0.85
0.9
0.95
1
COD/COD
0
pH 4
pH 7
pH 9
©2004 CRC Press LLC
ozonation, and experiments similar to those in Figure 6.2 are carried out, the results
are really different as shown in Figure 6.3. In these cases, when carbonates are not
initially present in wastewater, it is observed that pH does have an effect on COD
removal rate. Also, at pH 4 both reaction periods are clearly distinguished, the critical
COD value being reached at about 15 min. Another observation is that, regardless
of pH, values of COD conversion are higher than those observed from Figure 6.2,
and that the two reaction periods still continue to be difficult to distinguish at pH 7
and 9. The explanation of all these observations is likely due to the ways of ozone
reaction. Thus, at pH 4 after the initial reaction period, no fast ozone direct-reacting
compounds remain in water, and indirect reactions commence their role. The effect
of these reactions, however, is not very important because at pH 4, ozone hardly
decomposes in water and concentration of hydroxyl radicals is so low that the COD
removal rate approaches zero (the plateau value). At higher pH values the initial
starting period should be very short (which is the reason that both periods are not
clearly distinguished) and indirect reactions are the main way of ozonation (specially
at pH 9). The higher COD removal rate confirms the development of indirect reactions
because carbonates are not present in high concentration to inhibit the ozone decom-
position in free radicals.
The problem derived from the accumulation in the media of refractory compounds
(saturated carboxylic acids, aldehydes, etc.) during ozonation and the subsequent
decrease of pH can be partially solved with the aid of pH sequential ozonation
processes. These processes are carried out at alternating time periods of acid and
basic pHs. In this manner, the process efficiency is increased because it benefits
from the two types of ozone reactions. Thus, depending on the initial pH of waste-
water the ozonation process can start at acid or basic pH to favor direct or indirect
reactions. Figures 6.4 and 6.5 show two examples of pH sequential ozonation applied
to wastewater from distillery and Table olive factories, respectively. Both wastewater
were first diluted with domestic wastewater to reach COD values usually appropriate
for secondary treatment in municipal wastewater plants.
46,49
Let us comment first
on the pH sequential ozonation of distillery wastewater in Figure 6.4. The pH of
this wastewater is about 4, then it is recommended to start ozonation at acid pH.
FIGURE 6.3 Effect of pH on the COD variation with time during the ozonation of a domestic
decarbonated buffered wastewater: COD
0
= 275 mgL
–1
.
Time, min
0 10 20 30 40
COD/COD
0
pH 4
pH 7
pH 9
0.6
0.7
0.8
0.9
1
©2004 CRC Press LLC
In Figure 6.4 the evolution of COD with time corresponding to different pH sequen-
tial ozonation and conventional ozonation is shown. As can be seen, conventional
ozonation at the pH of wastewater leads to a poor degradation rate. When wastewater
pH is increased to carry out ozonation at basic pH, the efficiency of ozonation
significantly increases and COD reduces from 2.5 to 1.8 gL
–1
. At acid pH the two
reaction periods are clearly seen. COD removal rate is improved when pH sequential
ozonation is applied. Thus, as seen in Figure 6.4, two ozonation periods of acid pH
(30 min) and basic pH (90 min) lead to the best results as far as COD removal is
concerned. In this experiment, COD diminished from 2.5 to about 1.5 g/L. In
FIGURE 6.4 Single and sequential ozonation of wine distillery processing — synthetic urban
wastewater. Evolution of remaining COD concentration with time. Conditions: T = 293 K,
gas flow rate = 30 Lh
–1
, C
O3g
(fed) = 20 mgL
–1
. For acid cycle, pH = 4, alkaline cycle, pH =
10. Duration of acidic-alkaline cycles, min: ∇=120-0, ᭛=0-120 ∆=10-110, ⅙=20-100, ▫=30-90.
From Beltrán, F.J., García-Araya, J.F., and Álvarez, P., pH Sequential ozonation of domestic
and wine distillery wastewater, Water Res., 35, 929–936, 2001. With permission. Copyright
2001 Elsevier Press.
FIGURE 6.5 Single and sequential ozonation of table olive processing — synthetic urban
wastewater. Evolution of normalized remaining COD concentration with time. Conditions: T
= 293 K, gas flow rate = 20 Lh
–1
, k
L
a = 0,02 s
–1
, C
O3g
(fed) = 45 mgL
–1
(a = acid cycle, b =
alkaline cycle). For acid cycle, pH = 4, alkaline cycle, pH = 10. From Rivas, F.J. et al., Two
step wastewater treatment: Sequential ozonation-aerobic biodegradation, Ozone Sci. Eng.,
22, 617–636, 2000. With permission. Copyright 2000 International Ozone Association.
Time, min
0 20 40 60 80 100 120
COD, g/L
1.4
1.6
1.8
2.0
2.2
2.4
2.6
0.0
0.2
0.4
0.6
0.8
1.0
0 50 100 150 200
Time (min)
COD/COD
o
a = acid cycle
b = basic cycle
b (Simple ozonation)
b-a-b
a-b-a
b-a-b-a-b
a-b-a-b
©2004 CRC Press LLC
Figure 6.5, similar results can be observed for wastewater from a table olive pro-
duction factory, although the removal efficiency is not as important as in the previous
case. In this case, table olive wastewater presents a basic pH of about 10 that is
recommended to start with. Again, when ozonation periods of basic and acid pH
are applied, the COD removal rate increases. The objective of pH sequential ozo-
nation is to take advantage of the two ways of ozone action that are triggered at
the right moment. Thus, when pH is acid, most of the fast ozone-reacting compounds
are removed through direct reactions, while refractory compounds are simulta-
neously generated. In order to avoid stopping ozonation, pH is increased (by adding
NaOH), and indirect reactions are favored. The result is the increase of the ozonation
rate and COD removal. However, during this period mineralization takes place and
carbonate is formed, thus, reducing the ozonation rate because of the inhibiting
character of these reactions in trapping hydroxyl radicals. When carbonates accu-
mulate in wastewater, pH is again changed to become acid and a new ozonation
period starts. In this new period, the objective is the removal of carbonates as carbon
dioxide which is stripped from wastewater. Once this occurs, pH can be again
increased to start another period where indirect reactions are favored. The number
of periods and their duration are design aspects that depend on the wastewater
nature. The optimum combination for the acid and basic periods is achieved from
laboratory experiments. This pH sequential ozonation could be a recommended
option in some cases but its application will depend on economic factors as in any
process technology.
6.5 CHEMICAL BIOLOGICAL PROCESSES
Numerous works on the biological treatment of wastewater deal with the combined
operation of chemical and biological oxidations.
86
In these works the beneficial effects of
chemical oxidation as a pretreatment or post-treatment step in biological oxidation have
been confirmed. Among the oxidants checked, ozone plays a major role due to the different
mechanisms of reaction associated with its use. Thus, in many wastewaters, the application
of ozone at appropriate levels usually improves the biodegradability of the wastewater
and, in some cases, the rate of sedimentation of the activated sludge and their production.
87
However, ozonation alone should not be a recommended technology for the treatment of
wastewater. Due to the high levels of organic matter, in many cases, high consumption of
ozone is always observed with small percentage reductions of COD, although this always
depends on the nature of the wastewater treated as stated above. Therefore, before studying
the kinetics of the wastewater preliminary ozonation experiments should be carried out
to establish the reactivity of ozone and the beneficial effects that an ozonation stage could
add to the whole treatment. Typical experiments include the use of ozone alone or com-
bined with other oxidants such as hydrogen peroxide, UV radiation followed by biological
treatments, and measurements of COD, TOC, BOD, etc. The results are usually compared
to those obtained in the absence of ozone. For example, in Figure 6.6 the changes observed
in the COD of a domestic wastewater with time in the process of biological oxidation
with activated sludge, both previously treated and untreated with ozone, are shown.
88
As
can be observed, if the wastewater is preozonated, the biological oxidation step allows a
COD reduction of about 83% at 35ºC while the individual processes leads
©2004 CRC Press LLC
to COD reductions of 20% (only ozonation), not shown, and 55% (only biological oxi-
dation). Then, the beneficial effect of preozonation is clear, but ozone alone is not a
recommended option.
6.5.1 BIODEGRADABILITY
Another important advantage of the ozone application is the improvement of waste-
water biodegradability. The biological oxygen demand, BOD, is the parameter that
measures the biodegradability of a wastewater but literature also reports the ratio
BOD/COD as a more realistic parameter because it also considers the magnitude of
pollution (that is, the magnitude of COD). Also, BOD is usually determined after 5 d
but in ozonated samples a higher time is allowed to facilitate the acclimation of
microorganisms of the BOD test to the ozonated wastewater. Since after 10 d con-
sumption of oxygen is also due to nitrification processes, BOD at 10 d is a recom-
mended value to calculate the BOD/COD ratio. As example, in Figure 6.7 the effect
of ozone dose on the BOD/COD ratio for an ozonated distillery wastewater is pre-
sented.
36
It is observed that biodegradability measured as BOD/COD ratio is deeply
affected by the ozone dose applied in the preozonation stage. The improve of biode-
gradability is associated with the partial oxidation of organic matter to give low
molecular weight oxygenated compounds rather than complete oxidation to carbon
dioxide. In Figure 6.7 the existence of an optimum ozone dose is also observed.
FIGURE 6.6 Variation of COD with time during activated sludge biological oxidation of
municipal wastewater with and without preozonation. Ozonation conditions: pH 7.5, 20ºC,
ozone dose: 100 mgL
–1
, COD
0
= 280-300 mgL
–1
. Biological oxidation conditions: pH 7.2-7.7,
VSS
0
= 1100-1200 mgL–1, DO = 3-4 mgL–1, T 20ºC: no ozone: ▫=5, ⅙=20, ∆=35, ∇=60. With
preozonation: ᭛=5, + 20, ϫ=35. From Beltrán, F.J., García-Araya, J.F., and Álvarez, P., Impact
of chemical oxidation on biological treatment of a primary municipal wastewater. 2. Effects
of ozonation on the kinetics of biological oxidation, Ozone Sci. Eng., 19, 513–526, 1997.
With permission. Copyright 1997 International Ozone Association.
Time, h
COD, ppm O
2
0 5 10 150 20 25
300
250
200
150
100
50
©2004 CRC Press LLC
Lower values of the ozone dose are not enough to reach conversions of all refractory
organics and yield other compounds more amenable for microorganisms. On the
contrary, higher ozone doses likely lead to removal of biodegradable compounds
formed during the chemical oxidation process. It is also evident that these effects are
highly dependent on the nature of the wastewater. For example, in Figure 6.8, results
on BOD/COD ratio obtained in the ozone–biological oxidation process of a domestic
plus distillery wastewater are presented.
36
The plot shows how the percentage com-
position of the wastewater (domestic to distillery contribution ratio) affects the
FIGURE 6.7 Influence of ozone dose on the biodegradability of a distillery wastewater
induced by ozonation. Conditions: 20ºC, pH = 5.4, 30 Lh
–1
gas flow rate, Domestic sewage
to vinasse volume ratio = 10. From Beltrán, F.J., García-Araya, J.F., and Álvarez, P., Wine
distillery wastewater degradation. 1. Oxidative treatment using ozone and its effect on the
wastewater biodegradability, J. Agric. Food Chem., 47, 3911–3918, 1999. With permission.
Copyright 1999 American Chemical Society.
FIGURE 6.8 Influence of domestic sewage to vinasse volume ratio on the biodegradability
induced by ozonation. Conditions: 20ºC, pH = 5.4, 30 Lh
–1
gas flow rate, C
O3gi
= 20 mgL
–1
,
Domestic sewage to vinasse volume ratio = 0-20. Black symbol corresponds to domestic
sewage without vinasses. From Beltrán, F.J., García-Araya, J.F., and Álvarez, P., Wine dis-
tillery wastewater degradation. 1. Oxidative treatment using ozone and its effect on the
wastewater biodegradability, J. Agric. Food Chem., 47, 3911–3918, 1999. With permission.
Copyright 1999 American Chemical Society.
0 0.2 0.4 0.6 0.8 1 1.2
0.5
0.55
0.6
0.65
0.7
0.75
BOD/COD
Ozone dose, gL
–1
0 5 10 15 20
0.55
0.6
0.65
0.7
0.75
0.8
BOD/COD
Domestic sewage to vinasse ratio, v/v
©2004 CRC Press LLC
BOD/COD. From Figure 6.8 it is observed that the increase of the domestic sewage
in the composition of the total wastewater is detrimental to improved biodegradability.
It is then deduced that the distillery wastewater composition initially contained
organic compounds refractory to biological oxidation that ozonation transformed into
other more biodegradable forms while the domestic sewage was not affected.
6.5.2 SLUDGE SETTLING
Another important effect of preozonation that concerns the biological process is the
improvement of the sedimentation rate. Thus, ozone addition can lead to particle
destabilization through different mechanisms as literature reports.
3
This has also
been observed in the activated sludge treatment coming from an integrated ozone–bio-
logical oxidation process as shown in Figure 6.9 in the case of the sedimentation
rate of activated sludge in preozonated and non-preozonated domestic wastewater.
The sedimentation rate is measured as the decrease observed in the sludge–clear
water interface with time in a 1-L column. As can be observed from Figure 6.9, the
preozonated samples showed a faster sedimentation rate. If the design of the sedi-
mentation unit is required, the beneficial effects of preozonation can reduce the
surface area of the sedimentation unit, as has also been shown in other work.
38
6.5.3 SLUDGE PRODUCTION
Sludge generated in wastewater biological oxidation processes is becoming an impor-
tant problem due to its restricted use in landfilling and agriculture. Then, methods
to disintegrate the sludge from wastewater treatment plants are welcome. Ozonation
has also been reported as a possible technology to reduce the amount of sludge by
reacting with solid particles and increasing the biodegradability.
60,65
This is particu-
larly useful in anaerobically produced sludges where biodegradability is very low —
one of the problems of the anaerobic system. The beneficial effect of ozone has been
FIGURE 6.9 Variation of wastewater–solid interface height with time during sludge sedi-
mentation of domestic wastewater biologically treated with and without a preozonation step.
Conditions: 20ºC, pH 7, COD
0
= 265 mgl
–1
: Wastewater treatment type: ▫, Aerobic biological
oxidation, ∆ Ozonation plus aerobic biological oxidation.
Time, min
0 10 20 30 40 50
0
200
400
600
800
1000
Interface height, mL
©2004 CRC Press LLC
reported to reach the zero sludge production in some case
10
at an ozone dose of 0.136
gO
3
/gSS. In this kind of process ozonation is applied in the returning sludge line for
some periods of time. The ozonation can also be applied in a tank where the returning
sludge line finishes (see Figure 6.10). Ozone is able to destroy microorganisms and
produce more organic compounds, partially mineralizing the sludge. Once in the
aerobic tank another part of the ozonated sludge is then mineralized, yielding lower
amounts of sludge. In this kind of process, improvements in the quality of other
parameters are also noticed. For example, the sludge volumetric index can be kept
as low as 100 mLg
–1
, compared to a value of 800 mLg
–1
in a nonozonated run for
the same period of time.
9
6.6 KINETIC STUDY OF THE OZONATION
OF WASTEWATERS
So far the kinetic studies of ozone reactions have been limited to model compounds
dissolved in high purity water. In these studies, the concentration of the target
compound B is usually high so that the reactions are fast in most of the cases. In
practice, however, there are two possibilities related to drinking water or wastewater
treatment. The first one refers to cases where the concentration of reactants is much
lower than at the laboratory scale so that the conditions of slow kinetic regime
usually hold. The second one is related to wastewater where there are multiple
compounds with different unknown concentrations and global parameters are used
to follow the degree of pollution, such as the chemical oxygen demand, COD, total
organic carbon, TOC, etc. The first situation is more common in drinking water
treatment, but in that case ozone indirect reactions are generally the main way of
pollutant removal. This case, then, will be treated later (see Chapter 7). The second
case is the treatment of wastewater. Therefore, in the sections that follow, the kinetic
studies of wastewater ozonation are presented.
FIGURE 6.10 Use of ozone to reduce the sludge volume in wastewater biological oxidation.
INFLUENT
ACTIVATED
SLUDGE
MINERALIZED
SLUDGE
OZONE
EFLUENT
SLUDGE EXCESS
CONCENTRATED
SLUDGE
©2004 CRC Press LLC
6.6.1 ESTABLISHMENT OF THE KINETIC REGIME
OF THE OZONE ABSORPTION
The study of the kinetics of wastewater ozonation is the determination of the rate
constant of the ozone reactions as a first step to model the process. It is evident,
however, that this is not a viable task due to the number of compounds that constitute
the wastewater. Rigorously, the ozonation of wastewaters is a multiple series parallel
system of ozone reactions. Therefore, the kinetics is followed with the use of global
or surrogate parameters representing the concentration of the wastewater. COD is
the recommended parameter as shown before and, for the sake of simplification, it
can be admitted that ozone would react with the matter in water through the following
irreversible second order reaction:
(6.5)
When the kinetic regime is slow, it is also admitted that ozone decomposes in free
radicals that react with the organic matter through reaction:
(6.6)
In this section, it is assumed that only the kinetics through the direct ozonation
reaction [6.5] proceeds.
Steps followed to study the kinetics of the direct wastewater ozonation are similar
in nature to those shown before in the case of single compounds. The first action is
to establish the right kinetic regime of ozone absorption since this will allow the
ozone absorption rate law to be fixed (see Table 5.5). This can be made through the
determination of the experimental reaction factor, E [see Equation (4.31)], with the
absorption rate of ozone, N
O3
, being calculated from the difference between the
ozone molar rates at the reactor inlet and outlet. This leads to two possible situations.
For reaction factors higher than unity, the kinetic regime can be considered as fast
or instantaneous, while for E values approximately equal or lower than unity, the
kinetic regime is slow. In addition, the presence or absence of dissolved ozone
confirms one or another situation. For example, in Figure 6.11 the changes of COD
and dissolved ozone concentration with time corresponding to the ozonation of two
different wastewaters of high (2000 mg/l
–1
) and low (160 mg/l
–1
) COD are pre-
sented.
89
The results observed show that dissolved ozone was only found after
approximately 15 min from the start of the ozonation of the lowest concentrated
wastewater (tomato wastewater). Hence, fast or instantaneous reactions developed
at any time in the ozonation of the more concentrated wastewater and for the first
15 min of the ozonation of the low concentrated wastewater. The experimental
reaction factors also confirmed this conclusion.
89
Then, it was necessary to establish
the experimental conditions for the fast of pseudo first-order kinetic regime since
this kinetic regime is the recommended one to determine the rate constant (see
Chapter 4).
Oz P
3
+→COD
HO P•+ →
′
COD
©2004 CRC Press LLC
For the fast of pseudo first-order kinetic regime, Condition (4.47) has to be
fulfilled. Due to the number of reactions present, for the rate constant of ozone direct
reactions, k
2
, however, a reaction rate coefficient ε
O3
, representative of the surrogate
reaction (6.5), is considered. In fact, this coefficient should not be taken as a real
rate constant but another that also is affected by the physical properties of the
medium.
90,91
As observed in Equation (4.47) the Hatta number depends on the
product between the reaction rate constant and the diffusivity of ozone. Values of
the ozone diffusivity are only known in very dilute organic free water. For waste-
water, it can be considered the following equation:
(6.7)
where D′
O3
is the diffusivity of ozone in the wastewater which is unknown. Accord-
ing to Condition (4.47) values of Ei should be as high as possible for the kinetic
regime to be fast of pseudo first-order. However, only approximate values of Ei can
be obtained since this parameter depends on the diffusivities and ozone solubility.
In the case of wastewater ozonation studies, the diffusivity of the organic matter is
usually taken as 5 × 10
–10
m
2
sec
–1
that can be an average value for the diffusivities
of compounds in water.
89
For ozone, the diffusivity in dilute organic free water is
also taken. It is evident that this represents the highest limiting value of this
parameter because in the presence of organic matter ozone diffuses slower than in
organic-free water. On the other hand, the ozone solubility also depends on the
organic matter present in the wastewater (see Chapter 5). However, as shown below
(Section 6.6.2), values of the Henry law constant determined by absorbing ozone
in a wastewater do not differ too much from those in organic-free water.
92,93
Then,
for calculation purposes, the ozone solubility in organic-free or dilute organic water
FIGURE 6.11 Variation of COD and dissolved ozone concentration with time during the
ozonation of wastewaters. Conditions: Distillery wastewater: ∆=COD, tomato wastewater: ᭺
=COD ᭹=dissolved ozone concentration. From Beltrán, F.J. et al., Kinetic study of the ozonation
of some industrial wastewaters, Ozone Sci. Eng., 14, 303–327, 1992. With permission.
Copyright 1992 International Ozone Association.
Time, min
0 20 40 60 80 100 120
0
1
2
3
4
5
6
7
COD × 10
2
, mol O
2
dm
–3
COD × 10
3
, mol O
2
dm
–3
C
03
× 10
5
, mol O
3
dm
–3
0
1
2
3
4
5
6
0
2
4
6
8
10
ε
O
O
O
k
D
D
32
3
3
=
′
©2004 CRC Press LLC
can be considered to determine Ei. Thus, actual values of Ei are likely higher than
those calculated from Equation (4.46) with these assumptions. Once Ei is known,
if 1 < E < Ei the fast of pseudo first-order kinetic regime can be assumed to develop.
Application of this procedure was followed in a previous work.
.89
If ozonation is carried out in a semibatch agitated reactor where gas and waste-
water phases can be considered perfectly mixed, the steps that follow for the rate
coefficient determination are the same as those shown in Section 5.3.4 for the case
of the ozonation of model compounds.
89
For example, in Table 6.4 results of the
kinetic study corresponding to some wastewater ozonation are shown.
6.6.2 DETERMINATION OF OZONE PROPERTIES FOR THE
O
ZONATION KINETICS OF WASTEWATER
In addition to the rate coefficient, ε
O3
, parameters such as the Henry constant and
the volumetric mass transfer coefficient, k
L
a, are also needed to solve the ozone
absorption rate equations. Values of the Henry constant and mass transfer coefficients
can be found in literature or determined as shown in preceding sections for organic-
free water or very dilute organic aqueous solutions. With wastewater, the problem
is that the presence of different substances may affect the values of both parameters.
Therefore, attempts should be made to estimate He and k
L
a in more polluted water.
The usual procedure could be that shown in section 5.1.2 for organic free water
where the mass balance of ozone in water is used. In organic free water, the rate
constant of the decomposition reaction of ozone is known, but in a practical case
(with wastewater), the rate coefficient is also unknown and the use of the mass
balance of ozone in water is not appropriate. However, a similar method can be
applied from the mass balance of ozone in the gas phase, provided the kinetic regime
of ozone absorption corresponds to slow reactions. The method is based on the fact
that for slow reactions, the ozone absorption rate can be expressed as in Equation
(4.30), that is, as a function of the ozone driving force (C
O3
*
– C
O3b
) and the procedure
TABLE 6.4
Rate Coefficient Data Corresponding to the Ozonation of Some Wastewater
Wastewater Type System Properties
Rate Coefficient,
M
–1
s
–1
Reference
Wine distillery Semibatch tank, COD = 2080 mgL
–1
, 50 Lh
–1
,
Inlet P
O3
= 2229 Pa, pH = 4.8, z = 0.4
a
6240 89
Tomato processing Semibatch tank, COD = 160 mgL
–1
, 50 Lh
–1
,
Inlet P
O3
= 425 Pa, pH = 8.5, z = 1.47
b
3.89 × 10
–4
89
Domestic Semibatch bubble column, COD = 65 mgL
–1
,
30 Lh
–1
, Inlet P
O3
= 507 Pa, pH = 7.5, z =
1.18
2 × 10
–5
90
z values in gCOD/g O
3
a
After 60 min reaction,
b
After 15 min reaction.
©2004 CRC Press LLC
does not depend on the rate coefficient value. Thus, the mass balance of ozone in
the gas phase in a semibatch reactor where the gas and wastewater phases are
perfectly mixed is given by Equation (5.32). If the accumulation term is assumed
negligible (as has been observed in a previous work
91
) from Equations (4.30) and
Equation (5.17), once the Henry’s and perfect laws have been accounted for [Equa-
tions (5.36) and Equation (5.37)], C
O3
*
= C
g
RT/He), the concentration of ozone in
the gas at the reactor outlet becomes as follows:
(6.8)
According to Equation (6.8) a plot of C
gb
against C
O3b
corresponding to different times
of one ozonation experiment in the real wastewater should lead to a straight line.
From the slope and ordinate of this line the Henry constant and mass transfer
coefficient can be determined. Notice that in the mass balance of ozone [Equation
(5.32)] there is no need to neglect the accumulation rate term but the procedure
would be more complicated since a trial-and-error method similar to that used by
Ridgway et al.
72
(see Section 5.3.3) should be applied.
There is another way to obtain He and k
L
a for the ozonation of a wastewater.
Again, the kinetic regime has to be slow so that there must be dissolved ozone. This
procedure applies when the concentrations of ozone in the gas and wastewater phases
remain constant with time. This situation usually occurs after some reaction time
has elapsed from the start of ozonation. At these conditions (see Reference 92 as an
example) the variation of COD with time is also constant (dCOD/dt = constant) and
also the ozone absorption rate:
(6.9)
where, subindex s denotes steady state conditions for ozone concentrations. Since
the ozone absorption rate, at steady state conditions, can also be expressed as the
difference between the experimental ozone molar rates at the reactor inlet and outlet:
(6.10)
after considering the Henry’s law, it is obtained:
(6.11)
Since at these conditions Equation (6.8) also holds, solving Equations (6.8) and
Equation (6.11) will allow both He and k
L
a be experimentally determined. The
C
C
k aRT
vHe
V
C
v
ka
RT
He
V
gb
geb
L
g
O
g
L
=
+
+
+
1
3b
β
β
−== −
()
d
dt
zN k a C C
Os L Os
Obs
COD
33
3
*
N
mm
V
Os
io
3
=
−
β
C
He
RT
mm
Vk a
He
RT
C
gs
io
L
Os
=
−
+
β
3