CYANIDE in WATER and SOIL: Chemistry, Risk, and Management - Chapter 4 pdf
Bạn đang xem bản rút gọn của tài liệu. Xem và tải ngay bản đầy đủ của tài liệu tại đây (424.78 KB, 15 trang )
4
Manufacture and the Use
of Cyanide
George M. Wong-Chong, David V. Nakles, and
Richard G. Luthy
CONTENTS
4.1 Production of Cyanide Compounds 42
4.1.1 Hydrogen Cyanide 42
4.1.2 Production of Sodium Cyanide 42
4.1.2.1 Global and U.S. Production 42
4.1.2.2 Production Methods 44
4.1.3 Production of Ferrocyanides 48
4.1.4 Production of Acrylonitrile 49
4.1.4.1 Global and U.S. Production 49
4.1.4.2 Production Methods 50
4.2 Incidental Industrial Production of Cyanide 51
4.2.1 Coking and Gasification of Coal 52
4.2.2 Blast Furnace Operations 52
4.2.3 Aluminum Production 52
4.2.4 Municipal Waste and Sludge Incineration 53
4.3 Summary and Conclusions 53
References 54
Cyanide, a natural compound found in plants and animals, is believed to be a key component in the
in the manufacture of a number of products including synthetic fibers and plastic, gold, agricul-
tural herbicides, fumigants and insecticides, dyes and pigments, animal feed supplements, chelating
breakdown of the overall industrial use of hydrogen cyanide, including as a feedstock chemical for
that use cyanide compounds in the manufacturing process, along with the cyanide compounds
employed.
The cyanide industry traces its history to about 1710 with the discovery of Prussian Blue (or ferric
ferrocyanide), an iron cyanide compound, which at that time was used almost exclusively in dye-
ing [3,4]. However, it was not until about 1885 that substantial commercialization of cyanide,
specifically potassium cyanide, occurred with the development of the McArthur-Forest process,
known today as the cyanidation process, for the extraction of gold from low-grade ores [3]. This
discovery represents a major sustaining factor in today’s cyanide commerce, with about 20%, or an
estimated 0.6 million tons, of the worldwide production of cyanide used in mining [5,6].
This chapter discusses the manufacture of cyanide compounds, especially hydrogen cyanide,
sodium cyanide, ferrocyanide, and acrylonitrile, as well as the uses of these compounds and their
41
© 2006 by Taylor & Francis Group, LLC
agents for water treatment, and specialty chemicals and pharmaceuticals [1,2]. Table 4.1 presents a
production of other cyanide compounds, as of 1991. Table 4.2 presents a list of some industries
origin of life (see Chapter 1) and plays a pivotal role in today’s commerce. It is a basic component
42 Cyanide in Water and Soil
TABLE 4.1
Use of Hydrogen Cyanide in Manufacturing in the United States
(1991 Estimate)
Product HCN used (%)
Adiponitrile for nylon 41
Acetone cyanohydrin for plastics 28
Sodium cyanide 13
Cyanuric chloride for pesticides and agricultural products 9
Chelating agents (e.g., EDTA) 4
Methionine, animal feed 2
Misc.: specialty chemicals and pharmaceuticals 3
Source: Data from Pesce, L.D., Kirk–Othmer Encyclopedia of Chemical Technology,
Vol. 7, John Wiley & Sons, New York, 1993.
production rates. The chapteralsodiscusses thoseindustrieswhere cyanide productionisan incidental
occurrence, such as in coking and gasification of coal, metal ore reduction in blast furnaces, the
reduction of alumina, and municipal waste and sludge incineration.
4.1 PRODUCTION OF CYANIDE COMPOUNDS
4.1.1 H
YDROGEN CYANIDE
In 2001, the worldwide production of hydrogen cyanide was approximately 2.6 million tons [6]. The
U.S. production in the period 1983 through 2001 was 0.33 to 0.75 million tons per year, as shown in
There are four commercial processes for the production of hydrogen cyanide. Two of these are
synthesis processes involving the reaction of ammonia, methane (natural gas), and air over a platinum
catalyst: (1) the Andrussow process and (2) the Blausaure–Methan–Ammoniak (BMA) process.
A third process, the Shawinigan process, uses a carbon fluid bed in an electrical fluohmic furnace
to react ammonia and propane. The fourth process is the acrylonitrile production process where
hydrogen cyanide is produced as a by-product and which accounts for about 30% of worldwide
cyanide.
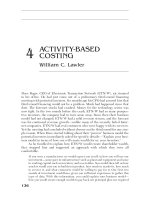
The Andrussow process, which is by far the dominant manufacturing process, produces hydrogen
cyanide via the following reaction [2]:
CH
4
+NH
3
+1.5O
2
→ HCN +3H
2
O (4.1)
recovery/recycle of ammonia and waste heat-design features that improve the efficiency and economy
of the process. Details of the process are available in the Kirk–Othmer Encyclopedia of Chemical
Technology [2].
4.1.2 PRODUCTION OF SODIUM CYANIDE
4.1.2.1 Global and U.S. Production
The McArthur-Forest patent for gold extraction from ore with cyanide was issued in 1887 and the
cyanidation process was first used in the Crown Mine in New Zealand and then elsewhere in the
© 2006 by Taylor & Francis Group, LLC
Table 4.3.
supply [2]. Table 4.4 presents summary information about the synthesis processes for hydrogen
Figure 4.1 presents a schematic flow diagram of the Andrussow process. This diagram shows the
Manufacture and the Use of Cyanide 43
TABLE 4.2
Use of Cyanide Compounds in Manufacturing Industries
Primary cyanide compounds
Industry used in the process References
Adhesives Ammonium thiocyanate [14]
Cement stabilizer Calcium cyanide [15]
Electroplating Potassium- or sodium-cyanide
(degreasing)
Propionitrile (solvent, dielectric fluid)
Nickel cyanide
Silver cyanide
Barium cyanide
Zinc cyanide
Copper cyanide
Hydrogen cyanide
Cyanogen chloride (metal cleaner)
Mercuric potassium cyanide (mirror
manufacturing)
[14–18]
Fire retardant Potassium ferrocyanide [19,20]
Herbicides Ammonium thiocyanate [14,21]
Fumigant, poison gas,
pesticides,
insecticides,
parasiticide
Cyanogen
Cyanogen chloride
Cyanogen bromide
Zinc cyanide
Copper cyanide
Calcium cyanide
Hydrogen cyanide
Ammonium thiocyanate (pesticides)
[14,15]
Mining Sodium cyanide
Malononitrile
Cyanogen bromide
Barium cyanide
Calcium cyanide
Ferrocyanide (used as a flotation agent
for copper and lead/zinc separation)
[14–17]
Petroleum Malononitrile (lubricating oil additive)
Propionitrile (solvent)
[15]
Photography Ferricyanide bleach
Mercuric cyanide
Hydrogen cyanide
[17,22–24]
Pharmaceuticals
(includes antibiotics,
steroids, prescription
and nonprescription
drugs)
Ferricyanide
Ferrocyanide
Propionitrile
Ammonium thiocyanate (ingredient in
antibiotic preparations)
[14,15,22,24]
(continued)
© 2006 by Taylor & Francis Group, LLC
44 Cyanide in Water and Soil
TABLE 4.2
Continued
Primary cyanide compounds
Industry used in the process References
Pigments, paints,
dyes, ink, personal
care products
Ferricyanide
Ferrocyanide
Ferric ferrocyanide (Prussian blue,
Fe
4
(Fe(CN)
6
)
3
)
Malononitrile
Mercuric cyanide (germicidal soap)
Copper cyanide (marine paint)
[15,25–27]
Road salt Sodium ferrocyanide
Ferric ferrocyanide (Prussian blue,
Fe
4
(Fe(CN)
6
)
3
)
Potassium ferrocyanide
[17,28–30]
Rocket and missile
propellant
Cyanogen
Ammonium thiocyanate
[14,15]
Synthetic fiber,
acrylic fiber, nylon,
synthetic rubber
Malononitrile
Adiponitrile (intermediate in the
manufacture of nylon)
Cyanogen bromide
Cyanogen chloride
Hydrogen cyanide (production of nylon
and other synthetic fibers and resins)
Ammonium thiocyanate (improve the
strength of silks)
[14–16,31]
Wine Potassium ferrocyanide [32]
Source: Data from MPI, Final Technical Memorandum: Summary of cyanide investiation at
SRWTP and preliminary conclusions and recommendations, report by Malcolm Pirnie, Inc.,
Emeryville, CAtotheSacramentoRegional County Sanitation District, Sacramento Regional
Wastewater Treatment Plant, Regulatory Compliance Group, Sacramento, CA, 2004.
1890s. This process started the new field of hydrometallurgy. With the advent of this process, world
production of potassium cyanide rose from 5,900 tons per year in 1899 to 21,000 tons per year in
1915 [2,3]. Sodium cyanide eventually replaced the potassium salt for economic reasons, and has
been the cyanide salt used in hydrometallurgical gold extraction solutions for many years.
Production and use of sodium cyanide has been growing. Global annual usage of sodium cyanide
in 1989 was about 340,000 tons. In the early 1990s, the total world production of sodium cyanide
was estimated to be in excess of 450,000 tons. In 2001, the global production rate was about 600,000
tons per year [2,6].
4.1.2.2 Production Methods
In 1906, Robine and Lenglen [3] cited 79 processes for the production of potassium cyanide:
10 processes involving extraction from ferrocyanide; 13 processes involving extraction from
thiocyanate; 28 processes involving synthesis from atmospheric nitrogen; 24 processes involving
synthesis from ammonia; and four other processes. In 1891 through 1899, the Beilby process —
involving synthesis from ammonia, sodium and potassium carbonate, and powdered charcoal —
accounted for about 50% of the total European production of alkali cyanide [2]. In 1900, the Castner
© 2006 by Taylor & Francis Group, LLC
Manufacture and the Use of Cyanide 45
TABLE 4.3
Production of Hydrogen Cyanide
in the United States, 1983–2001
Production
a
,
Year 10
3
tons/yr
2001 750
2000 765
1999 745
1998 725
1997 710
1996 695
1995 675
1994 645
1993 600
1992 570
1991 565
1990 585
1989 565
1988 500
1987 470
1986 430
1985 365
1984 365
1983 330
a
Production estimates for 1983–1988;
Source: Data from Pesce, L.D., Kirk–Othmer
Encyclopedia of Chemical Technology, Vol.7,
John Wiley & Sons, New York, 1993.
Production estimates for 1989–2001; Source:
Data from Myers, E., American Chemistry
Council, Washington, DC, personal commu-
nication, 2002.
TABLE 4.4
Synthesis Processes for Hydrogen Cyanide
Process Catalysts Temperature,
◦
C Feed
Andrussow Platinum/rubidium 1100 NH
3
, air, and CH
4
Blausaure–Methan–Ammoniak Platinum 1100 NH
3
and CH
4
Shawinigan Carbon fluid bed in a fluohmic furnace 1350–1650 NH
3
and C
3
H
8
Acrylonitrile process By-product 400–510 NH
3
, air, and C
3
H
6
Source: Data from Pesce, L.D., Kirk-Othmer Encyclopedia of Chemical Technology, Vol. 7, John Wiley & Sons,
New York, 1993.
© 2006 by Taylor & Francis Group, LLC
46 Cyanide in Water and Soil
NH
3
Fractionator
NH
3
/Water
NH
3
Absorber
Steam
Waste-
water
NH
3
Stripper
Diammonium
Phosphate
Solution
Monoammonium Phosphate Solution
Waste-Heat
Boiler
Reactor
NH
3
Feed
Air Feed
Natural
Gas Feed
NH
3
Recycle
HCN
Fractionator
HCN
Absorber
Coolers
HCN
Stripper
Acid
HCN/Water
Steam
SO
2
Waste Water
HCN/Water
HCN with SO
Inhibitor
2
Waste Gases to
Boiler or Flare
Off-Gas Minus N
H
3
FIGURE 4.1 Schematic flow diagram of the Andrussow hydrogen cyanide production process. (Source:
Pesce, L.D., Kirk–Othmer Encyclopedia of Chemical Technology, Vol. 7, John Wiley & Sons, New York, 1993.
Reprinted with Permission of John Wiley & Sons, Inc.)
process replaced the Beilby process and dominated production through 1960 for both potassium
and sodium cyanide. For the production of sodium cyanide, the Castner process employs elemental
sodium and a reaction with ammonia and carbon as follows:
2Na +2NH
3
+2C → 2NaCN +3H
2
(4.2)
Low yields and elevated costs led to the obsolescence of the Castner process. This process was
replaced by the neutralization or wet processes that react hydrogen cyanide from the Andrussow
or BMA processes with a sodium hydroxide solution:
HCN +NaOH → NaCN +H
2
O (4.3)
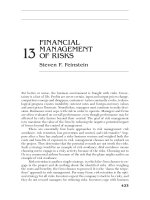
Most modern, high tonnage production plants use essentially purified anhydrous liquid hydrogen
cyanide to react with sodium hydroxide to produce a product consisting of 99% sodium cyanide.
The manufacturing process includes the evaporation of water and crystallization of the sodium
cyanide. Control of the process is critical to maximize the average crystal size; to avoid hydrogen
© 2006 by Taylor & Francis Group, LLC
Manufacture and the Use of Cyanide 47
Vacuum
system
Condenser
Crystallizer
System
Filter
Air Heater
Dehumidifier
Scrubber
Waste
Mixing Conveyor
Briquetter
Screens
Separator
Dust
Scrubber
Cyclone
Product to
packaging
and storage
50% Caustic
Hydrogen cyanide
Steam
FIGURE 4.2 Production process flow diagram for sodium cyanide. (Source: Pesce, L.D., Kirk–Othmer
Encyclopedia of Chemical Technology, Vol. 7, John Wiley & Sons, New York, 1993. Reprinted with permission
of John Wiley & Sons, Inc.)
cyanide polymer formation, which produces an off-white product; and to minimize sodium formate
formation, which reduces product purity. Figure 4.2 presents a process flow diagram for a typical
sodium cyanide production plant.
An occasionally used, alternative process is the direct absorption of crude hydrogen cyanide
gas from the manufacturing operation into a sodium hydroxide solution. However, the purity of
the sodium cyanide product is lower, that is, approximately 96 to 97% [2]. The primary impurities
are sodium carbonate and sodium formate.
The formation of larger crystals facilitates the dewatering in the filtration step. In many plants, the
moist salt from the filter is passed through a mixing conveyor to destroy the lumps. Often, heated air
(450
◦
C) is passed through the cake on the filterand through the mixing conveyor. Drying is completed
in a hot-air conveyor-dryer. This approach to drying avoids the overheating of the sodium cyanide
crystals, thus minimizing the formation of sodium formate in the dried product. A slight excess of
sodium hydroxide must be maintained at all stages of processing to maintain an elevated pH, which
© 2006 by Taylor & Francis Group, LLC
48 Cyanide in Water and Soil
prevents the formation of a black or brown hydrogen cyanide polymer. The product, as shipped, must
also contain a slight excess of sodium hydroxide, to ensure that the product yields clear solutions
following arrival at its destination.
Inherently, the sodium cyanide forms a 50-µm diameter crystal, yielding a dusty solid of low bulk
density that must be compacted or fused into larger particles for safer handling. Due to the expense
associated with melting the product for casting it in molds, most processes employ mechanical
compacting devices that produce either briquettes or granular products. The compaction process
occurs using heat and pressure. Most sodium cyanide is sold in dry form to minimize transportation
costs although appreciable tonnage is also sold as a 30% aqueous solution [2]. About 90% of today’s
sodium cyanide is used in gold extraction [5,6].
Plants for the production of sodium cyanide, using these processes, are operating in the United
States, Italy, Japan, the United Kingdom, Australia, Germany, and China.
4.1.3 PRODUCTION OF FERROCYANIDES
Ferric ferrocyanide, also known as Prussian Blue (Fe
4
[Fe(CN)
6
]
3
), was the first cyanide compound
put to commercial use. The compound was discovered by a Berlin color maker in 1704 [3]. This led
to a long history of ferrocyanide chemistry, which has resulted in the use of these compounds in a
wide variety of industrially significant applications. A treatise on the chemistry of ferrocyanides [7]
describes some 22 applications, and these are listed in Table 4.5.
In the late 1700s through the early 1900s, ferrocyanide salts were produced by (1) the synthetic
fusion of nitrogenous organic residues (e.g., animal blood, hides, hornes, waste/scrap leather, etc.),
potash, and iron, and (2) the direct extraction from illuminating-gas and from the by-product
TABLE 4.5
Uses of Ferrocyanides and their Derivatives in Industry
Analytical chemistry
Anticaking agent
Blueprints
Case hardening and heat treatment of steel
Chemical synthesis: catalysts, reaction intermediates, and reagents
Chemotherapy
Corrosion inhibitors
Desulfurization of coke oven gas
Detergents
Dying of textiles
Electrical equipment treatment: corrosion resistance; arc stabilization and lowering of grounding resistance
Electroplating
Minerals dressing, beneficiation, and mining
Pesticides
Petroleum refining: trace metals removal
Photography
Pigments and dyes
Pickling of steel
Rubber: peptizing agent, stabilization agent, and accelerator
Separation and identification of organic bases
Trace metals removal in fermentation
Source: Data from ACC, The Chemistry of the Ferrocyanides, American Cyanamid Co., New York, NY,
1953.
© 2006 by Taylor & Francis Group, LLC
Manufacture and the Use of Cyanide 49
of illuminating-gas clean-up (e.g., spent iron oxide boxes for gas purification) [3]. It was estimated
that about 1.8% of the nitrogen in coal reacted to form hydrogen cyanide during coal gasification.
In the direct gas extraction processes, the illuminating gas was scrubbed with an alkaline iron salt
solution. Robine and Lenglen [3] discussedin detail nineprocesses for the direct extraction of cyanide
from illuminating gas, three processes for extraction from ammoniacal liquor, and 11 processes for
recovering ferrocyanide from spent iron oxide.
In the synthesis from nitrogenous organic matter, the process chemistry for making potassium
ferrocyanide was thought to be:
K
2
CO
3
+Nitrogenous Matter +Energy → KCN +··· (4.4)
6KCN +Fe
2+
→ K
4
Fe(CN)
6
+2K
+
(4.5)
In the first reaction, hydrogen cyanide is produced by the thermal breakdown of the organic matter
in an oxygen controlled environment (Equation [4.4]). Subsequently, the hydrogen cyanide reacts
with potassium to form potassium cyanide. The potassium cyanide, in turn, reacts with the iron to
form potassium ferrocyanide as shown in Equation (4.5).
Today, ferrocyanide production utilizes the crude sodium cyanide, produced as described in
Section 4.1.2, and ferrous sulfate to form sodium ferrocyanide:
6NaCN +FeSO
4
+Heat → Na
4
Fe(CN)
6
+Na
2
SO
4
(4.6)
The sodium ferrocyanide is recovered by crystallization as the decahydrate salt. The potassium salt
is produced by reacting sodium ferrocyanide with calcium hydroxide and potassium chloride and
carbonate according to the following reactions:
Na
4
Fe(CN)
6
+2Ca(OH)
2
→ Ca
2
Fe(CN)
6(s)
+4Na(OH) (4.7)
Ca
2
Fe(CN)
6
+2K
2
CO
3
→ K
4
Fe(CN)
6
+CaCO
3(s)
(4.8)
In earlier times, ca. 1900, Prussian Blue was produced in a two stage process. The first
stage reacted potassium ferrocyanide and ferrous sulfate to form a grayish-white precipitate of
potassium ferric–ferrocyanide. In the second stage, the potassium ferric–ferrocyanide is oxidized
to the tetrairon(III) tris(hexakiscyanoferrate), Fe
4
[Fe(CN)
6
]
3
[3]. Today, the production of Prussian
Blue is more direct, where ferrocyanide is reacted with excess iron(III) to produce the intense blue
precipitate [2].
4.1.4 PRODUCTION OF ACRYLONITRILE
Acrylonitrile [C
3
H
3
N], also called vinyl cyanide, is among the top 50 chemicals produced in the
United States as a result of the tremendous growth in its use as a starting material for a wide range of
chemical and polymerproducts. Acrylicfibers remainthelargestuse ofacrylonitrile. Othersignificant
uses are resins and nitrile elastomers and as an intermediate in the production of adiponitrile and
acrylamide.
4.1.4.1 Global and U.S. Production
Worldwide production of acrylonitrile was approximately 3.2 million tons in 1988 [8]. As shown
States. In the United States, BP Chemicals dominated production, supplying more than one-third of
domestic production. Nearly one-half of the United States production was exported in 1988, with
most going to Japan and the Far East [8]. This export market grew steadily from the mid-1970s
© 2006 by Taylor & Francis Group, LLC
in Table 4.6, more than one-half of that production was located in Western Europe and the United
50 Cyanide in Water and Soil
TABLE 4.6
Worldwide Acrylonitrile Production, 1988
Region Production, 10
3
tons
Western Europe 1200
United States 1170
Japan 600
Far East 200
Mexico 60
Total 3230
Source: From Brazdil, F., Kirk-Othmer Encylopedia of
Chemical Technology, Vol. 1, John Wiley & Sons, New
York, 1993.
TABLE 4.7
Worldwide Acrylonitrile Demand, 10
3
Tons per Year
Region 1976 1980 1985 1988
Western Europe 880 880 1140 1200
Japan 570 510 635 680
United States 590 660 640 660
Far East 200 270 385 560
Mexico/South America 81 130 200 250
Total 2321 2450 3000 3350
Source: Data from Brazdil, F., Kirk–Othmer Encyclopedia of Chemical
Technology, Vol. 1, John Wiley & Sons, New York, 1993.
to 1988. During this period, it increased from 10% in the mid-1970s to 53% and 43% in 1987 and
1988, respectively. The large exports to the Far East were the result of higher raw material costs
(i.e., propylene costs) relative to the United States. A more detailed breakdown of the world demand
for acrylonitrile for the period between 1976 and 1988 is provided in Table 4.7. Growth in demand
during this period averaged about 3.6% per year between 1984 and 1988. Projections beyond 1988
were 3% per year through 1993.
4.1.4.2 Production Methods
Prior to 1960, processes based on either ethylene oxide and hydrogen cyanide or acetylene and
hydrogen cyanide were used to produce acrylonitrile. Growth in the demand for acrylic fibers around
1950 spurred improvements in process technology and resulted in the discovery of a heterogeneous
vapor-phase catalytic process. This process, which produced acrylonitrile using selective oxidation
of propylene and ammonia, is commonly referred to as the propylene ammoxidation process. This
process was introduced in 1960 and eventually displaced all other acrlyonitrile manufacturing pro-
cesses. As of 1988, over 90% of the approximately 3.2 million metric tons of acrylonitrile produced
worldwide each year was manufactured using the propylene ammoxidation process [8].
© 2006 by Taylor & Francis Group, LLC
Manufacture and the Use of Cyanide 51
H
2
O
H
2
O
Heavy
impurities
Product
acrylonitril
e
Crude
HCN
Crude
acetonitrile
Crude
acrylonitrile
Off-Gas
H.P. Steam
BFW
Fluid-Bed
Catalytic Reactor
400° - 510° C
49-196 kPa
Absorber
Acrylonitrile
recovery
column
Acetonitrile
recovery
column
Lights
column
Product
column
START
Air
Ammonia
Proplene
FIGURE 4.3 Process flow diagram for ammoxidation process. (Source: Brazdil, F., Kirk–Othmer Encyclope-
dia of Chemical Technology, Vol. 1, John Wiley & Sons, New York, 1993. Reprinted with permission of John
Wiley & Sons, Inc.)
The primary chemical reaction of the propylene ammoxidation process is as follows:
C
3
H
6
+NH
3
+1.5O
2
CATALYST
−→ C
3
H
3
N +3H
2
O (4.9)
A process diagram of the commercial process is shown in Figure 4.3. This process uses a fluidized
bed reactor, in which propylene, ammonia, and air contact a solid catalyst at 400 to 510
◦
C and 49
to 196 kPa gauge. It is a single pass process that achieves about 98% conversion of the propylene,
and uses about 1.1 kg of propylene per kilogram of acrylonitrile produced. As shown in Figure 4.3,
hydrogen cyanide is a by-product of the acrylonitrile production process. This hydrogen cyanide can
be processed as a salable product or used in the manufacture of methyl methacrylate and acetonitrile,
common industrial solvents [8].
4.2 INCIDENTAL INDUSTRIAL PRODUCTION
OF CYANIDE
Many industrial operations that employ thermal processing of carbonaceous materials produce small
quantities of cyanide. Included among these operations are
• Coking and gasification of coal
• Blast furnace processing for iron and nonferrous metal oxide reduction
• Alumina reduction
• Municipal waste and sludge incineration
Brief discussions of these operations follow. More details and discussions of these operations
© 2006 by Taylor & Francis Group, LLC
are presented in Chapter 26.
52 Cyanide in Water and Soil
4.2.1 COKING AND GASIFICATION OF COAL
The coking operation involves distillation of coal by indirectly heating the coal in the absence of
air to temperatures in the range of 900 to 1100
◦
C to vaporize all volatile constituents in the coal
[9]. These volatile constituents include a range of hydrocarbons (e.g., benzene, toluene, methane,
naphthalene, phenols, xylenes, and polynuclear aromatic hydrocarbons), nitrogenous compounds
including ammonia, and sulfurous compounds including hydrogen sulfide. The heating period can
range from 18 to 36 h [9]. Hydrogen cyanide is formed, albeit in relatively small amounts, due to
the high temperature, reducing atmosphere, and the presence of nitrogen and carbon. The quantity
of cyanide produced in the coking of coal has been reported to be about 1.5 to 2.0% of the nitrogen
content of the coal [3]. A portion of the cyanide remains in the coke oven gas while the remainder
leaves the coking system in the waste ammonia liquor wastewater [3].
In the early days of the cyanide industry, ca. 1900, cyanide was recovered from illuminating-gas
production, which was essentially a coking process [3,10]. The cyanide was recovered by absorbing
the hydrogen cyanide from the gas stream into an alkaline iron salt solution to form an alkali ferro-
cyanide product. As previously noted, Robine and Lenglen [3] provide detailed descriptions of nine
processes for the direct extraction of hydrogen cyanide from illuminating gas and three processes
for the extraction of cyanide compounds from the ammoniacal liquors.
The coal gasification process is similar to coking, in that the coal is heated to similar temperatures.
However, air is introduced into the coal gasifier to combust a portion of the coal, which produces
the heat for the steam/coal reactions that take place. The quantity of air that is injected is controlled
to maintain the gasification temperature and the quality of product gas that is produced (high or
low BTU content). Again, similar to the coking process, some hydrogen cyanide is formed given
the conditions of high temperature, abundance of carbon (as low molecular weight hydrocarbons,
carbon dioxide or carbon monoxide), and nitrogen from the injected air or coal. Just as in the coking
operation, some of this cyanide remains in the product gas and the remaining portion exits the plant
in the gas cleaning wastewater.
4.2.2 BLAST FURNACE OPERATIONS
In blast furnace operations, the furnace is charged with coke, metal oxide, and limestone flux.
The furnace is heated to maintain a temperature profile of about 900
◦
C in the upper section of the
furnace and greater than 1770
◦
C in the bottom section around the tuyeres. Periodic blasts of air and
supplemental fuel (oil) are fired into the reaction mixture [9]. This environment of high temperature,
available carbon as carbon monoxide and carbon dioxide, and nitrogen from the air blast provide
conditions for hydrogen cyanide formation.
Flue gas emitted from the top of the blast furnace, about 2.5 to 3.5 tons of gas per ton of iron
produced, has a heating value of 80 to 90 BTU/SCF [9] and fuels auxiliary stoves or powers boilers
and blowers. The blast furnace gas is laden with dust, as much as 0.05 tons per ton of iron produced,
that must be removed to prevent clogging of combustion equipment. About 70% of the dust is
removed by bag-houses and dry scrubbing and the remaining 30% by wet scrubbing. The hydrogen
cyanide that is present in the gas is removed during the wet scrubbing process and reports to the blast
furnace gas scrubber water.
4.2.3 ALUMINUM PRODUCTION
Aluminum is manufactured via the electrometallurgical reduction of alumina (Al
2
O
3
(s)) in the Hall–
Heroult process [2,11]. The alumina is placed in a molten cryolite (Na
3
AlF
6
) bath in a carbon-lined
cell, or “pot.” An electrical current is passed through the reaction mixture using carbon anodes placed
in the molten mixture. The carbon pot liner, which typically is 15 in. thick, serves as the cathode.
The molten mass attains a temperature of about 950 to 1,000
◦
C [2,11]. The carbon anode is rapidly
© 2006 by Taylor & Francis Group, LLC
Manufacture and the Use of Cyanide 53
consumed while the carbon pot liner cathode is re-used, usually for several years until it becomes
unacceptably contaminated [11]. In this reactor, the conditions of high temperature, available carbon,
and availablenitrogen provide theopportunity forhydrogen cyanide formation. Air entering at reactor
seals is the primary source of nitrogen. The hydrogen cyanide produced becomes absorbed into the
carbon of the pot liner and at the end of a pot liner processing life, the cyanide concentration can
be as high as 0.9% by weight [11]. Cyanide levels vary within a pot, with highest concentrations
observed in the potlining at the side walls. Spent potlining containing cyanide and other contaminants
is removed for treatment and disposal. Until the early 1970s, spent potlining was managed as an
inert residue and was often used as onsite fill material. Today, spent potlining is a listed hazardous
waste (K088) in the United States. Based on data from 1991 to 1997, the annual production of K088
waste is approximately 80,000 to 100,000 tons [12]. Past practices for the disposal of spent potlining
have resulted in adverse environmental impacts such as contamination of soil and groundwater, as
4.2.4 MUNICIPAL WASTE AND SLUDGE INCINERATION
In areas where land-disposal of municipal wastewater treatment sludge is not practical, sludge
incineration is an accepted disposal alternative. In some instances, the economics are improved
by combined incineration of municipal refuse and sludge coupled with co-generation of electricity.
In the northeastern states of Massachusetts and Rhode Island, municipal wastewater sludge inciner-
ation is widely practiced, for example, at the Cranston, Rhode Island and Fitchburg, Massachusetts
municipal wastewater treatment plants.
These sludges contain about 5 to 6% nitrogen on a dry weight basis and are essentially organic
in composition. They are charged to the incinerator with about 70 to 80% water. During the course
of sludge incineration, there tends to be pockets of reduced conditions, especially in the early stages
of incineration. These localized conditions, coupled with the high temperature and availability of
nitrogen and carbon, provide the opportunity for hydrogen cyanide formation. This cyanide leaves
the incinerator in the exhaust gases and is transferred to the off-gas scrubbing water. At the Cranston,
Rhode Island POTW, an average of 2.08 g cyanide per kilogram of dry sludge incinerated is removed
in the scrubber water [13].
4.3 SUMMARY AND CONCLUSIONS
• Hydrogen cyanide and other cyanide compounds are used extensively in manufacturing,
including the production of synthetic fibers and plastics, agricultural herbicides, fumigants
and insecticides, dyes and pigments, animal feed supplements, chelating agents for water
treatment, and specialty chemicals and pharmaceuticals.
• Sodium cyanide is used extensively for the extraction of gold from ore in hydrometallur-
gical gold mining.
• In 2001, the worldwide production of hydrogen cyanide was approximately 2.6 million
tons.
• Hydrogen cyanide is manufactured primarily by the Andrussow process, which involves
the reaction of methane, ammonia, and oxygen. Hydrogen cyanide from this process is
reacted with sodium hydroxide solution to form sodium cyanide, the most common solid
form of cyanide that is used in commerce.
• Potassium ferrocyanide (K
4
[Fe(CN)
6
]), and related solid-phase precipitates, especially
ferric ferrocyanide (Fe
4
[Fe(CN)
6
]
3
), or Prussian Blue, is produced in large quantity for a
variety of specialty uses.
• Acrylonitrile, also called vinyl cyanide, is produced in large quantities because of its use
as a starting material for a wide range of chemical and polymer products.
© 2006 by Taylor & Francis Group, LLC
discussed in more detail in Chapter 27.
54 Cyanide in Water and Soil
• Various cyanide compounds are produced incidentally during the manufacture of coke,
steel, and aluminum, and during the incineration of municipal waste and wastewater
sludges.
REFERENCES
1. Homan, E.R., Reactions processes and materials with potential for cyanide exposure, in Clinical and
Experimental Toxicology of Cyanides, Ballantyne, B. and Marrs, T.C., Eds., John Wright, Bristol, UK,
1987, p. 1.
2. Pesce, L.D., Cyanides, in Kirk–Othmer Encyclopedia of Chemical Technology, Vol. 7, John Wiley &
Sons, New York, 1993.
3. Robine, R. and Lenglen, M., The Cyanide Industry, John Wiley & Sons, New York, 1906.
4. Ritter, S.K., Prussian Blue still a hot topic, Chem. & Eng. News, May 2, 2005, p. 32.
5. Logsdon, M.J., Hagelstein, K., and Mudder, T.I., The management of cyanide in gold extraction,
International Center for Metals and the Environment, Ottawa, Canada, 1999.
6. Young, C.A., Cyanide: just the facts, in Cyanide: Social, Industrial and Economic Aspects, Young, C.A.,
Twidwell, L.G., and Anderson, C.G., Eds., The Minerals, Metals & Materials Society, Warrendale, PA,
2001, p. 97.
7. ACC, The Chemistry of the Ferrocyanides, American Cyanamid Co., New York, NY, 1953.
8. Brazdil, F., Acrylonitrile, in Kirk-Othmer Encyclopedia of Chemical Technology, Vol. 1, John Wiley &
Sons, Inc., New York, 1993, p. 352.
9. USS, The Making, Shaping and Treating of Steel, McGannon, H.E., Ed., United States Steel Corp.,
Pittsburgh, PA 1971.
10. Hayes, T.D., Linz, D.G., Nakles, D.V., and Leuschner, A.P., Eds., Management of Manufactured Gas
Plant Sites, Vo l . 1, Amherst Scientific Publishers, Amherst, MA, 1996, Chapter 2, p. 5.
11. USEPA, Best demonstrated available technology (BDAT) background document for spent alu-
minum potliners — K088, U.S. Environmental Protection Agency, Office of Solid Waste,
12. USEPA, Land disposal restrictions — background document to establish the effective date for amended
treatment standards for spent aluminum potliners (proposed rule), U.S. Environmental Protection
13. Bratina, C., Cranston, Rhode Island wastewater treatment plant, personal communication, 2004.
14. ATSDR, Toxicological profile for cyanide (update), U.S. Department of Health and Human Services,
Public Health Service, Agency for Toxic Substances and Disease Registry, Atlanta, GA, 1997.
15. USNLM, Toxicology and Environmental Health Information Program. Toxicology Data Network
(TOXNET), U.S. National Library of Medicine, accessed: February 18,
2005.
16. Boucabeille, C., Bories, A., Olliver, P., and Michel, G., Microbial degradation of metal complexed
cyanides and thiocyanate from mining wastewaters, Environ. Pollut., 84, 59, 1994.
17. Kjeldsen, P., Behaviour of cyanides in soil and groundwater: a review, Water, Air, Soil Pollut., 115, 279,
1999.
18. Patterson, J.W., Cyanide, in Industrial Wastewater Treatment Technology, Butterworth, Boston, 1985,
p. 115.
19. Hopkins, S.J., Special water quality survey of the Pecos and Gallinas Rivers below the Viveash and
Manuelitas fires of 2000, Surveillance and Standards Section, New Mexico Environment Department,
February 25, 2005.
20. Little, E. and Calfee, R., The effects of UVB radiation on the toxicity of firefighting chemicals, U.S.
Department of Agriculture, Forest Service and Wildland Fire Chemical Systems, 2002.
21. Rapean, J.C., Johnson, R.A., and Hanson, T.P., Biodegradation of cyanide: Nitrite interference in the
standard test for total cyanide, in Proceedings of the 35th Purdue Industrial Waste Conference, West
Lafayette, IN, 1980, p. 430.
22. USEPA, Sustainable industry project phase I report, Chapter 3, The photoimaging industry, U.S.
Environmental Protection Agency, Office of Policy Development, Washington, D.C., 2002.
© 2006 by Taylor & Francis Group, LLC
http://
www.epa.gov/epaoswer/hazwaste/ldr/k088/k088back.pdf, 2000.
Agency, Washington, D.C., 2000.
,
2001, Available at accessed:
Manufacture and the Use of Cyanide 55
23. Meeussen, J.L., Keizer, M.G., and de Haan, F.A.M., Chemical stability and decomposition rate of iron
cyanide complexes in soil solutions, Environ. Sci. Technol., 26, 511, 1992.
24. Owerbach, D., Analysis and sample stability of cyanide in industrial effluents, J. Water Pollut. Control
Fed., 52, 11, 1980.
25. USEPA, Seminar publication — National conference on urban runoff management: Enhancing urban
watershed at the local, county and state levels, EPA-625/R-95-003, U.S. Environmental Protection
Agency, Washington, D.C., 1995.
26. USEPA, Profile of the wood furniture and fixtures industry, EPA-310/R-95-003, U.S. Environmental
Protection Agency, Office of Enforcement and Compliance Assurance, Washington, D.C., 1995.
27. USEPA, Pharmaceutical manufacturing category effluent limitations guidelines, Pretreatment standards
and new source performance standards, Final Rule, U.S. Environmental Protection Agency, 40 CFR,
Parts 136 and 439, 1998.
28. USEPA, Seminar publication — Wellhead protection: a guide for small communities, EPA-625/R-93-
002, U.S. Environmental Protection Agency, Washington, D.C., 1993.
29. ICF, Construction and demolition waste landfills, Report by ICF, Inc. Fairfax, VA, Contract No. 68-W3-
0008, U.S. Environmental Protection Agency, Office of Solid Waste, Washington, D.C., 1995.
30. Paschka, M.G., Ghosh, R.S., and Dzombak, D.A., Potential water-quality effects from iron cyanide
anticaking agents in road salt, Water Environ. Res., 71, 1235, 1999.
31. USEPA, Profile of the motor vehicle assembly industry, EPA-310/R-95-009, U.S. Environmental
Protection Agency, Washington, D.C., 1995.
32. USEPA, Consumer fact sheet on cyanide, U.S. Environmental Protection Agency, Office of Ground
25, 2005.
33. MPI, Final Technical Memorandum: Summary of cyanide investigation at SRWTP and preliminary
conclusions and recommendations, report by Malcolm Pirnie, Inc., Emeryville, CA to the Sacramento
Regional County Sanitation District, Sacramento Regional Wastewater Treatment Plant, Regulatory
Compliance Group, Sacramento, CA, 2004.
34. Myers, E., American Chemistry Council, Washington, DC, personal communication, 2002.
© 2006 by Taylor & Francis Group, LLC
Water and Drinking Water, Accessed: February