GIS Based Studies in the Humanities and Social Sciences - Chpater 1 pptx
Bạn đang xem bản rút gọn của tài liệu. Xem và tải ngay bản đầy đủ của tài liệu tại đây (1.43 MB, 29 trang )
GIS-Based
Studies in the
Humanities and
Social Sciences
Copyright © 2006 Taylor & Francis Group, LLC
A CRC title, part of the Taylor & Francis imprint, a member of the
Taylor & Francis Group, the academic division of T&F Informa plc.
Boca Raton London New York
Edited by
Atsuyuki Okabe
GIS-Based
Studies in the
Humanities and
Social Sciences
Copyright © 2006 Taylor & Francis Group, LLC
Published in 2006 by
CRC Press
Taylor & Francis Group
6000 Broken Sound Parkway NW, Suite 300
Boca Raton, FL 33487-2742
© 2006 by Taylor & Francis Group, LLC
CRC Press is an imprint of Taylor & Francis Group
No claim to original U.S. Government works
Printed in the United States of America on acid-free paper
10987654321
International Standard Book Number-10: 0-8493-2713-X (Hardcover)
International Standard Book Number-13: 978-0-8493-2713-1 (Hardcover)
Library of Congress Card Number 2005048572
This book contains information obtained from authentic and highly regarded sources. Reprinted material is
quoted with permission, and sources are indicated. A wide variety of references are listed. Reasonable efforts
have been made to publish reliable data and information, but the author and the publisher cannot assume
responsibility for the validity of all materials or for the consequences of their use.
No part of this book may be reprinted, reproduced, transmitted, or utilized in any form by any electronic,
mechanical, or other means, now known or hereafter invented, including photocopying, microfilming, and
recording, or in any information storage or retrieval system, without written permission from the publishers.
For permission to photocopy or use material electronically from this work, please access www.copyright.com
( or contact the Copyright Clearance Center, Inc. (CCC) 222 Rosewood Drive,
Danvers, MA 01923, 978-750-8400. CCC is a not-for-profit organization that provides licenses and registration
for a variety of users. For organizations that have been granted a photocopy license by the CCC, a separate
system of payment has been arranged.
Trademark Notice: Product or corporate names may be trademarks or registered trademarks, and are used only
for identification and explanation without intent to infringe.
Library of Congress Cataloging-in-Publication Data
GIS-based studies in the humanities and social sciences / editor, Atsuyuki Okabe.
p. cm.
Results from a six year research project entitled Spatial Science for the Humanities and
Social Sciences (SISforHSS) carried out June 1998 to March 2004 by the Center for Spatial
Information Science (CSIS) at the University of Tokyo.
Applies spatial methods in particular to economics, human geography, and archaeology.
Includes bibliographical references and index.
ISBN 0-8493-2713-X
1. Social sciences Research Methodology. 2. Humanities Research Methodology. 3. Geographic
information systems. 4. Spatial analysis (statistics) 5. Geographic information systems Japan
Databases Case studies. I. Okabe, Atsuyuki, 1945-
H62.S7962 2005
300'.72'7 dc22 2005048572
Visit the Taylor & Francis Web site at
and the CRC Press Web site at
Taylor & Francis Group
is the Academic Division of Informa plc.
2713_Discl.fm Page 1 Monday, September 26, 2005 3:00 PM
Copyright © 2006 Taylor & Francis Group, LLC
Preface
Almost all phenomena studied in the humanities and social sciences occur
in geographical space. This implies that, in principle, studies in the human-
ities and social sciences can be enhanced by the use of geographical infor-
mation systems (GIS
)
. However, actually employing GIS in the advancement
of these disciplines is not straightforward. Any computer-aided method of
analysis is pointless unless researchers can devote the time necessary to
learning what it is, what it can do, and how to use it. To this end, we carried
out the six-year project entitled Spatial Information Science for the Human-
ities and Social Sciences (SIS for HSS). The project began in June 1998, when
the Center for Spatial Information Science (CSIS) was established at the
University of Tokyo, and ended in March 2004. The project was funded by
the Grant-in-Aid for Special Field Research provided by the Ministry of
Education, Culture, Sports, Science and Technology
in Japan
. The project
leader was Atsuyuki Okabe of CSIS.
The SIS for HSS project had two aims:
1. To integrate spatial methods that were fragmentarily developed in
the humanities and social sciences, in particular as applied to the
areas of economics, human geography, and archaeology, and to
develop the methods into GIS-based tools for studies.
2. To develop spatial data infrastructural systems that would support
research in the above fields.
To achieve both of these objectives, the SIS for HSS project team had five
groups, which are listed below with the name of each team leader. The first
three of the groups were organized by subjects, and the last two were based
upon the GIS technologies employed. All the groups worked in collabora-
tion.
1. Economics (Yoshitsugu Kanemoto)
2. Human geography (Hiroyuki Kohsaka)
3. Archaeology (Takura Izumi)
4. Spatial data acquisition (Ryosuke Shibasaki)
5. Spatial data management (Yukio Sadahiro)
The achievements of the first objective, which are outlined in Chapter 1,
are presented in 19 sections (Chapters 2–20 of this volume).
The achievements of the second aim were the development of:
2713_C000.fm Page 5 Monday, September 26, 2005 2:04 PM
Copyright © 2006 Taylor & Francis Group, LLC
• A spatial database that contains ready-to-use data commonly used
in the humanities and social sciences
• A spatial-data clearinghouse in which researchers can easily search
through spatial data in the database developed above at http://
chouse.csis.u-tokyo.ac.jp/gcat/editQuery.do
• A data-sharing system that is widely used by scholars in the human-
ities and social sciences, www.csis.u-tokyo.ac.jp/japanese/
research_activities/joint-research.html
These systems are run by CSIS, and are open to academic users. The
systems are particularly useful when the researcher’s interest is in studying
human and social phenomena as they occur in Japan.
We sincerely hope that by means of this book, readers can come to an
understanding of how GIS are actually utilized in advancing studies in the
humanities and social sciences; furthermore, this book will encourage read-
ers to develop new GIS-based methods in their own research.
Atsuyuki Okabe
2713_C000.fm Page 6 Monday, September 26, 2005 2:04 PM
Copyright © 2006 Taylor & Francis Group, LLC
Editor
Atsuyuki Okabe
received his Ph.D. from the University of Pennsylvania in
1975 and his doctoral degree in Engineering from the University of Tokyo
in 1977. Previously he has held the position of Associate Professor at the
Institute of Socio-Economic Planning, University of Tsukuba. He is currently
Professor of the Department of Urban Engineering, University of Tokyo, and
served as Director of the Center for Spatial Information Science (1998–2005).
His research interests include geographical information science, spatial anal-
ysis, spatial optimization and environmental psychology. He has published
many papers in journals, books, and conference proceedings on these topics.
He is a co-author (with Barry Boots, Kokichi Sugihara, and Sung Nok Chiu)
of
Spatial Tessellations: Concepts and Applications of Voronoi Diagrams
(John
Wiley). He edited
Islamic Area Studies with Geographical Information Systems
(RoutledgeCurzon). He serves on the editorial boards of many international
journals, like the
International Journal of Geographical Information Science.
2713_C000.fm Page 7 Monday, September 26, 2005 2:04 PM
Copyright © 2006 Taylor & Francis Group, LLC
Acknowledgments
So many people helped in very many ways during the preparation of this
book that we are able to acknowledge only a few of them individually. First,
we are deeply grateful to the Ministry of Education, Culture, Sports, Science,
and Technology for financially supporting our project for six years. By coin-
cidence, a similar, nationally funded project was undertaken in the United
States by the Center for Spatially Integrated Social Science (CSISS) during
virtually the same period. Exchange between the members of CSISS and
those of SIS for HSS was fruitful. In particular, we express our thanks to Luc
Anselin, Serge Rey, Nick Ryan, Stephen Matthews, and Gilles Duranton for
commenting upon our studies in an international workshop. We also thank
Tadaaki Kaneko for ably managing finances, documentation, Web pages, and
symposia for six years. We are pleased to acknowledge the support of CSIS
at the University of Tokyo, where the spatial-information infrastructure of
our outcome is placed. Our special thanks go particularly to Tsuyoshi Sagara,
Eiji Ikoma, Kaori Ito, Akiko Takahashi, Akio Yamashita, You Shiraishi, and
Hideto Satoh. We are indebted to the staff of the publisher, especially Rachael
Panthier, Jessica Vakili, Taisuke Soda, Tony Moore, Matthew Gibbons, and
Randi Cohen. Finally, we also express our gratitude to Yoko Hamaguchi and
Ayako Teranishi for preparing our manuscripts.
2713_C000.fm Page 9 Monday, September 26, 2005 2:04 PM
Copyright © 2006 Taylor & Francis Group, LLC
Contributors
Yoshio Arai
Department of Human Geography
School of Arts and Sciences
University of Tokyo
Masatoshi Arikawa
Center for Spatial Information
Science
University of Tokyo
Yasushi Asami
Center for Spatial Information
Science
University of Tokyo
Ali El-Shazly
Faculty of Engineering
Cairo University
Hidetomo Fujiwara
Graduate School of Frontier
Sciences
Institute of Industrial Science
University of Tokyo
Naoko Fukami
Institute of Oriental Culture
University of Tokyo
Takashi Fuse
Department of Civil Engineering
University of Tokyo
Xiaolu Gao
Instutute of Geographyical
Sciences and Natural Resources
Research
Chinese Academy of Science
Yutaka Goto
Faculty of Humanities
Hiroaki University
Masashi Haneda
Institute of Oriental Culture
University of Tokyo
Yoshio Igarashi
Spatial IT Business Unit
Aerospace Division
Mitsubishi Corporation
Fumiko Itoh
Faculty of Economics
Niigata University
Yosinori Iwamoto
Graduate School of Frontier
Sciences
University of Tokyo
Erina Iwasaki
Graduate School of Economics
Hitotsubashi University
Tokyo
Takura Izumi
Graduate School of Faculty of
Letters
University of Kyoto
Yoshitsugu Kanemoto
Graduate School of Public Policy
and Graduate School of
Economics
University of Tokyo
2713_C000.fm Page 11 Monday, September 26, 2005 2:04 PM
Copyright © 2006 Taylor & Francis Group, LLC
Hiroshi Kato
Graduate School of Economics
Hitotsubashi University
Tokyo
Toru Kitagawa
Department of Economics
Brown University
Hiroyuki Kohsaka
Department of Geography
Nihon University
Shiro Koike
Department of Population Structure
Research
National Institute of Population and
Social Security Research
Yuki Konagaya
The National Museum of Ethnology
Osaka
Japan
Reiji Kurima
Graduate School of Economics
University of Tokyo
Takanori Kimura
Services Delivery-Industrial
IBM Japan, Ltd.
Dinesh Manandhar
Center for Spatial Information
Science, University of Tokyo
Atsushi Masuyama
Department of Real Estate Science
Meikai University
Susumu Morimoto
Nara National Cultural Properties
Research Institute
Yoshiyuki Murao
GIS Business Promotion
IBM Japan
Masafumi Nakagawa
National Institute of Advanced
Industrial Science and
Technology
Katsuyuki Nakamura
Center for Spatial Information
Science
University of Tokyo
Izumi Niiro
Department of Archaelogy
Okayama University
Atsuyuki Okabe
Center for Spatial Information
Science
University of Tokyo
Kei-ichi Okunuki
Department of Geography
Graduate School of Environmental
Studies
Nagoya University
Saiko Sadahiro
Faculty of Education
Chiba University
Yukio Sadahiro
Department of Urban Engineering
University of Tokyo
Hiroshi Saito
Department of Economics
Tokyo University
Tomoko Sekine
Department of Geography
Nihon University
2713_C000.fm Page 12 Monday, September 26, 2005 2:04 PM
Copyright © 2006 Taylor & Francis Group, LLC
Ryosuke Shibasaki
Center for Spatial Information
Science
University of Tokyo
Eihan Shimizu
Department of Civil Engineering
University of Tokyo
Keiji Shimizu
GIS Division
Kanko Co., LTD
Shino Shiode
Center for Spatial Information
Science
University of Tokyo
Etsuro Shioji
International Graduate School of
Social Sciences
Yokohama National University
Hiroya Tanaka
Faculty of Environmental
Information
Keio University
Takashi Tominaga
Industry Business Unit
Region Metro
Small and Medium Business
IBM Japan, Ltd
Hiro’omi Tsumura
Faculty of Culture and Information
Science
Doshisha University
Teruko Usui
Department of Geography
Nara University
Tohru Yoshikawa
Faculty of Urban Environmental
Sciences
Tokyo Metropolitan University
Huijing Zhao
Center for Spatial Information
Science
University of Tokyo
2713_C000.fm Page 13 Monday, September 26, 2005 2:04 PM
Copyright © 2006 Taylor & Francis Group, LLC
Table of Contents
1
Introduction 1
Atsuyuki Okabe
2
A Tool for Creating Pseudo-3D Spaces with Hyperphoto:
An Application in Ethnographic Studies 19
Hiroya Tanaka, Masatoshi Arikawa, Ryosuke Shibasaki,
and Yuki Konagaya
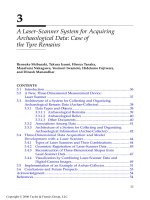
3
A Laser-Scanner System for Acquiring Archaeological Data:
Case of the Tyre Remains 35
Ryosuke Shibasaki, Takura Izumi, Hiroya Tanaka, Masafumi Nakagawa,
Yosinori Iwamoto, Hidetomo Fujiwara, and Dinesh Manandhar
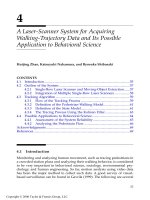
4
A Laser-Scanner System for Acquiring Walking-Trajectory
Data and Its Possible Application to Behavioral Science 55
Huijing Zhao, Katsuyuki Nakamura, and Ryosuke Shibasaki
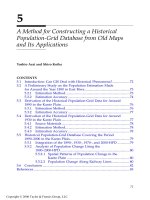
5
A Method for Constructing a Historical Population-Grid
Database from Old Maps and Its Applications 71
Yoshio Arai and Shiro Koike
6
Urban Employment Areas: Defining Japanese Metropolitan
Areas and Constructing the Statistical Database for Them 85
Yoshitsugu Kanemoto and Reiji Kurima
7
Data Modeling of Archaeological Sites Using a Unified
Modeling Language 99
Teruko Usui, Susumu Morimoto, Yoshiyuki Murao and Keiji Shimizu
8
How to Find Free Software Packages for Spatial Analysis
via the Internet 113
Atsuyuki Okabe, Atsushi Masuyama, and Fumiko Itoh
9
A Toolbox for Examining the Effect of Infrastructural
Features on the Distribution of Spatial Events 127
Atsuyuki Okabe and Tohru Yoshikawa
10
A Toolbox for Spatial Analysis on a Network 139
Atsuyuki Okabe, Kei-ichi Okunuki, and Shino Shiode
2713_C000.fm Page 15 Monday, September 26, 2005 2:04 PM
Copyright © 2006 Taylor & Francis Group, LLC
11
Estimation of Routes and Building Sites Described in
Premodern Travel Accounts Through Spatial Reasoning 153
Yasushi Asami, Takanori Kimura, Masashi Haneda, and Naoko Fukami
12
Computer-Simulated Settlements in West Wakasa: Identifying
the Ancient Tax Regions — The
Go-Ri
System 163
Izumi Niiro
13
Site-Catchment Analysis of Prehistoric Settlements by
Reconstructing Paleoenvironments with GIS 175
Hiro’omi Tsumura
14
Migration, Regional Diversity, and Residential Development
on the Edge of Greater Cairo — Linking Three Kinds of
Data — Census, Household-Survey Data, and Geographical
Data — with GIS 191
Hiroshi Kato, Erina Iwasaki, Ali El-Shazly, and Yutaka Goto
15
Effect of Environmental Factors on Housing Prices:
Application of GIS to Urban-Policy Analysis 211
Yasushi Asami and Xiaolu Gao
16
Estimating Urban Agglomeration Economies for Japanese
Metropolitan Areas: Is Tokyo Too Large? 229
Yoshitsugu Kanemoto, Toru Kitagawa, Hiroshi Saito, and Etsuro Shioji
17
Evaluation of School Redistricting by the School
Family System 243
Yukio Sadahiro, Takashi Tominaga, and Saiko Sadahiro
18
A Method for Visualizing the Landscapes of Old-Time
Cities Using GIS 265
Eihan Shimizu and Takashi Fuse
19
Visualization for Site Assessment 279
Hiroyuki Kohsaka and Tomoko Sekine
20
Visualization of the Mental Image of a City Using GIS 299
Yukio Sadahiro and Yoshio Igarashi
2713_C000.fm Page 16 Monday, September 26, 2005 2:04 PM
Copyright © 2006 Taylor & Francis Group, LLC
1
1
Introduction
Atsuyuki Okabe
CONTENTS
1.1 What Are Geographical Information Systems (GIS)? 1
1.2 Applications of GIS in the Humanities and Social Sciences:
Overview of the Chapters 9
Acknowledgments 16
References 16
1.1
What Are Geographical Information Systems (GIS)?
We notice in the literature of the humanities and social sciences that many
studies deal with phenomena that are closely related to geographical factors.
For example:
• Population change over 100 years is related to change in the net-
works of arterial roads and railways (Chapter 5).
• Travel behavior in a 17th century city was related to the configura-
tion of landmark buildings (Chapter 11).
• Configuration of ancient tax regions was related to fishing and agri-
cultural areas (Chapter 12).
• Size of paleo-settlements was related to hunting and fishing localities
(Chapter 13).
• Migration behavior is related to low-income regions (Chapter 14).
• Housing prices are related to the surrounding environment (Chapter
15).
• Agglomeration economies are related to city size (Chapter 16).
2713_C001.fm Page 1 Monday, September 26, 2005 2:48 PM
Copyright © 2006 Taylor & Francis Group, LLC
2
GIS-based Studies in the Humanities and Social Sciences
• School systems are related to the areal configuration of elementary
and lower secondary schools (Chapter 17).
• Clinic service areas are related to the travel time of the patients
(Chapter 18).
Groupings of these phenomena that are closely related to geographical
factors are called
geographical phenomena
.
Traditionally, researchers in the humanities and social sciences study geo-
graphical phenomena with the aid of paper maps, and most of their tasks
are undertaken by hand. For instance, they count the number of archaeolog-
ical sites in a region by marking each site on a map with a pencil; they then
measure the distance between sites by placing a ruler on a map; they then
measure the area of each site by counting the number of grid cells covered
by a transparent grid sheet placed over the map; then the slope angles of an
archaeological site are determined by counting the number of contour lines;
and so forth. Such tasks are tolerable when the number of geographical
features is small, but once these variables become numerous, the work is
laborious and time consuming. This difficulty is one of the reasons why
geographical factors, despite their significance, have often been ignored in
the study of humanities and social science.
Fortunately, in the late 1980s, user-friendly, computer-based processing
tools, called
geographical information systems
, became available, and these
greatly assisted in overcoming the tedious and time-consuming tasks. GIS
are, in short, computer-based methodologies for processing geographical
data.
What follows describes the key terms.
Geographical data
refers to the data
on geographical features and consists of
spatial-attribute data
— the locational
and geometrical attributes of features — and
nonspatial-attribute data
—
attributes other than spatial ones. Geographical data are alternatively called
spatial data
. The difference is subtle, but geographical data usually refer to
the ground surface (two-dimensional), while spatial data may include infor-
mation on the ground surface and also three-dimensional observations for
above and below ground, such as atmospheric and ground-water conditions.
Furthermore, geographical recordings may not include measurements of
architectural space, while spatial data include these. Since this book includes
the data relevant to archaeological buildings, railway-station halls, and sim-
ilar cultural and social constructions, the term
spatial data
is preferred, and
mainly used.
The second key term in our consideration of GIS is
processing.
This refers
to the application of the following subprocesses to the spatial data:
1. Acquiring
2. Managing
3. Analyzing
4. Visualizing
2713_C001.fm Page 2 Monday, September 26, 2005 2:48 PM
Copyright © 2006 Taylor & Francis Group, LLC
Introduction
3
A full explanation of these procedures would require a dedicated book,
but here, in Section 1.1, we briefly explain subprocessing for the convenience
of readers who are not familiar with GIS. Others more familiar with GIS may
ignore this part and go to Section 2. Please note that a 17-page introduction
to GIS is provided by Okabe (2003).
The first step in subprocessing, i.e., acquiring spatial data, is classified into
“direct” and “indirect” acquisition.
Direct spatial-data acquisition
means observing and recording entities in the
real world, for example, taking pictures of houses with established geograph-
ical locations and dimensions (Chapter 2); scanning of archaeological evi-
dence by laser scanner (Chapter 3); tracing the trajectories of moving people
in a station hall by laser scanner (Chapter 4); imaging land cover by airborne
remote-sensing equipment mounted on airplanes and satellites; interviewing
immigrants to determine their origins in field surveys (Chapter 14); and so
forth.
Indirect spatial-data acquisition
means deriving spatial data from material
represented by conventional maps and census documents that contain infor-
mation obtained from direct observations, such as administrative boundaries
defined by surveying and set down as part of a map. In this process, elec-
tronic scanning employing a device like a facsimile or tracing the boundaries
of features by a digitizer (a computerized device for tracing) may be done.
Imputation of population data for villages recorded in a census book and
the association of rural boundaries and their populations (Chapter 5) may
be undertaken by computer, and so forth.
The second step in subprocessing, i.e., managing spatial data, is organizing
the acquired data so they can be easily retrieved and manipulated. A system
for this subprocessing is called the
spatial database
. This consists of two
components: first, a database for spatial attributes, which manages geomet-
rical and locational data of features, and second, data on nonspatial charac-
teristics. Methods differ according to the data types, which are “raster” and
“vector.”
Raster data
represent features in terms of
pixels
,
which are dots or squares
arrayed on a rectangular lattice with attribute values placed on each pixel.
A good example is remotely sensed data (Figure 1.1), which appears in
picture form at a distance (Figure 1.1a) while the squares constituting the
images become visible on zooming in (Figure 1.1b). Data are simply managed
through an array of numbers representing attribute values and the coordi-
nates of pixels (Figure 1.1c).
Vector data
represent features in terms of points, line segments, and poly-
gons (Figure 1.2a). These geometrical elements are recorded as the coordi-
nates of points, the names of start and end points for line segments, and,
counterclockwise, the names of vertices for polygons. Management of vector
data is not as simple as for raster data when we wish to know the topological
properties within points, line segments, and polygons. That is, which line
segments cross another given line segment, which polygon includes a certain
point, and which polygons are adjacent to a particular polygon?
2713_C001.fm Page 3 Monday, September 26, 2005 2:48 PM
Copyright © 2006 Taylor & Francis Group, LLC
4
GIS-based Studies in the Humanities and Social Sciences
The underlying theories for managing topology are fairly complicated, but
users can easily use an ordinary GIS without knowing the underlying the-
ories. The database for nonspatial attributes usually adopts a table-type
format called a
relational database
. Frequently used examples of this are
FIGURE 1.1
Raster data: (a) zoomed out, (b) zoomed in, and (c) their array of values.
FIGURE 1.2
Vector data: (a) geometrical elements (points, lines, and polygons), and (b) the related numerical
data for points, lines, and polygons.
5 6 5 6
6 8 6 5
5 5 5 6
5 6 5 5
(a)
(b) (c)
House 5
House 1
House 4
House 2
House 3
House 8
House 7
House 6
v1
v2
v4
v3
Street 6
Street 1
Street 4
Bus stop 1
Street 5 Street 2
Street 3
xpt 2
xpt 1
Points x y
Bus stop 1 133 25
˙˙˙
Lines Start End
Street 1 xpt 1 xpt 2
˙˙˙
Polygons Vertices
House 1 v1, v2, v3, v4
˙˙˙
2713_C001.fm Page 4 Monday, September 26, 2005 2:48 PM
Copyright © 2006 Taylor & Francis Group, LLC
Introduction
5
Microsoft Excel and Microsoft Access. Readers wishing to understand the
supporting theories of spatial databases should consult, for example, Shek-
har and Chawla (2003).
The third step in subprocessing is the analysis of spatial data. This is the
main function of GIS, providing many operations for analysis of spatial, as
well as nonspatial, data. Since the steps needed for the analysis of nonspatial-
attribute data are fairly well-known, such as the operations in Excel, we will
focus on the analysis of spatial-attribute data. A first set of operations is
engaged to measure geometrical quantities. Examples are the measurement
of the distance between two points, of the length of a line consisting of
straight segments, of the area of a polygon, of the angle of a slope, and so
forth.
A second set of operations is used for spatial searches. Frequently used
approaches are the “inclusion search,” “distance search,” and “intersection
search.” The
inclusion search
finds those points, lines, and polygons that are
partly included in a given polygon. For example, these searches are used for
finding hospitals (the points in Figure 1.3a), streams (the line segments in
Figure 1.3b), and parks (the continuous-line polygons in Figure 1.3c) in a
given area (the broken-line polygon in Figures 1.3a, b, and c).
The
distance-search
operation (which is closely related to the “buffer” pro-
cess to be shown later) finds points, line segments, or polygons, parts of
which are within a given distance from a given geometrical element (Figure
1.4). For example, these searches are used to locate hospitals (Figure 1.4a),
streams (Figure 1.4b), and parks (Figure 1.4c) that are within 200 meters from
an expressway (the dot–dash lines in Figures 1.4a, b, and c).
The
intersection-search
operation finds line segments or polygons that inter-
sect with given similar elements (Figure 1.5). For example, it finds streams
that intersect with an expressway (Figure 1.5a) or, similarly, parks (Figure 1.5b).
A third manipulation is called the
buffer
operation, which generates a new
area in which the distance to the nearest feature is within a given distance
from given geometrical elements. For example, the buffer operation for
point-like features, such as stations, gives the area in which the distance to
the nearest station is within a certain limit, say, 200 meters (Figure 1.6a). The
buffer operation for line-like features, such as streams, reveals the area in
FIGURE 1.3
Inclusion search operations for (a) points, (b) line segments, and (c) polygons that are partly
included in a given polygon (indicated by the broken line).
2713_C001.fm Page 5 Monday, September 26, 2005 2:48 PM
Copyright © 2006 Taylor & Francis Group, LLC
6
GIS-based Studies in the Humanities and Social Sciences
which the distance to the nearest point on the streams is within a certain
distance (Figure 1.6b). The same process applied to an area-like feature, such
as a park, generates the area in which the distance to the nearest point on
the park's boundary is within a certain distance (Figure 1.6c).
A fourth set of operations, called the
overlay
operation, generates a new
spatial-data set by overlaying two different spatial data sets. Many processes
are included in the overlay operation. Three of the most frequently used are
OR (union), AND (intersection), and NOT (compliment). To take examples,
suppose that A1 contains the areas in which the distance to the nearest
hospital is within 200 meters (Figure 1.6a), and A2 contains the areas in
which the distance to the nearest point on streams is within 200 meters
FIGURE 1.4
Distance search operations for (a) points, (b) line segments, and (c) polygons, part of which are
within 200 meters from a given line indicated (the dot–dash lines).
FIGURE 1.5
Intersection search operations for (a) line segments and (b) polygons that intersect with the
given broken line.
FIGURE 1.6
Buffer operations for (a) points, (b) line segments, and (c) polygons.
200m
2713_C001.fm Page 6 Monday, September 26, 2005 2:48 PM
Copyright © 2006 Taylor & Francis Group, LLC
Introduction
7
(Figure 1.6b). Then, the operation A1 OR A2 generates a new area in which
the distance to the nearest hospital is within 200 meters, or the distance to
the nearest point on a stream, as shown in Figure 1.7a. The operation A1
AND A2 is shown in Figure 1.7b, and A2 NOT A1 is shown in Figure 1.7c.
Combining these basic operations of GIS, we can analyze spatial data. In
addition, GIS provide tools for advanced methods called
spatial analysis
,
which include
spatial statistics
. Tools for spatial analysis and statistics are
shown in Part 3, and their applications are shown in Part 4 of this volume.
Good textbooks are Bailey and Gatrell (1995) for spatial analysis and Cressie
(1993) for spatial statistics.
The last category of subprocessing is visualizing spatial data, which is the
outcome of spatial analysis. Ordinary GIS provide many tools for visualiza-
tion. To make an attractive and easily understandable visual product, usually
in the form of maps, we have to consider several characteristics of spatial
data: the geometrical types of features (e.g., points, lines, polygons, solids,
etc.), the measurement scales of attribute values (e.g., nominal, ordinal, inter-
val, ratio scales, etc.), spatial-data units (e.g., feature-based units, tessella-
tions, cell grids, continuous space, etc.), and other features. Considering these
characteristics, we develop a visual product of what we wish to convey in
terms of visual variables (e.g., spacing, size, shape, hue, lightness, arrange-
ment, etc.). For details, see, for example, Slocum (1999).
Visualization achieved through the use of GIS tools has much variety, and
so we can freely enjoy this. But sometimes we want to visualize spatial data
in a conventional fashion. Four of the most conventional map methods are
“choropleth,” “proportional symbol,” “isarithmic,” and “dot.”
A
choropleth map
is made by shading the cells of a tessellation, with an
intensity proportional to attribute values. An example is shown in Figure
1.8a, which illustrates the number of street robberies that occurred in districts
of Saitama Japan.
A
proportional symbol map
is made by scaling symbols in proportion to the
magnitude of an attribute value of a feature located at a representative point.
An example is shown in Figure 1.8b, which is an alternative presentation of
Figure 1.8a.
FIGURE 1.7
Overlay operations: (a) OR, (b) AND, and (c) NOT.
(a) (b) (c)
2713_C001.fm Page 7 Monday, September 26, 2005 2:48 PM
Copyright © 2006 Taylor & Francis Group, LLC
8
GIS-based Studies in the Humanities and Social Sciences
An
isarithmic map
, which is alternatively called a
contour map
, is based upon
a set of lines, called
isolines
, joining the same attribute values. An isarithmic
map is usually obtained from the density function estimated from known
values at finite points. Note that this procedure is called
spatial interpolation
.
An example is shown in Figure 1.8c, which illustrates the locational density
of street robberies in Saitama.
A
dot map
is a set of points located on a plane, with each point representing
the place of an event, for example, the site of a crime. An example is shown
in Figure 1.8d, which shows the locations of Saitama street robberies.
The above is an outline of the components of GIS. Readers who wish to
know GIS methods in more detail should consult textbooks, for example,
Bernhardsen (2002), Burrough and McDonnell (1998), Clarke (2003), Christ-
man (2002), Delaney (1999), Demers (2000), Heywood et al. (2002), Jones
(1996), Lo and Yeung (2002), Longley et al. (2001), Wise (2002), and Worboys
(1995).
FIGURE 1.8
Street robberies in Saitama represented by different map types: (a) choropleth, (b) proportional
symbol, (c) isarithmic, and (d) dot map.
(a) (b)
(c)
(d)
2713_C001.fm Page 8 Monday, September 26, 2005 2:48 PM
Copyright © 2006 Taylor & Francis Group, LLC
Introduction
9
1.2 Applications of GIS in the Humanities and Social
Sciences: Overview of the Chapters
Having understood what GIS are in Section 1.1, readers must now realize
that GIS are potentially very useful. As a matter of fact, this volume shows
how GIS are valuably applied to various studies in the humanities and social
sciences. The volume consists of 20 chapters, including this introductory
chapter. The subsequent 19 chapters are classified into five parts:
Part 1. Spatial-data acquisition
Part 2. Spatial databases
Part 3. Tools for spatial analysis
Part 4. Applications of spatial analysis
Part 5. Visualization
These sections cover almost all the basic components of GIS, which corre-
spond to the four subprocesses within GIS mentioned in Section 1.1. Explic-
itly, Part 1 deals with the acquisition of spatial data; Part 2 considers data
management; Parts 3 and 4 examine analysis; and Part 5 looks at visualiza-
tion. Through reading this volume, readers can therefore understand how
GIS are actually applied to studies in the humanities and social sciences.
Part 1, Spatial-Data Acquisition, consists of Chapters 2, 3, and 4. Chapter
2 introduces one of the simplest methods of acquiring this information,
namely, taking photographs, which are a useful medium for establishing a
record of places, people, life, and the atmosphere. It is not unusual for
observers to take more than 100 pictures per day in a field study. However,
when a researcher comes back from a field survey, he/she is often at a loss
when it comes to organizing a heap of images on the desk.
It is particularly hard to reproduce a three-dimensional space using pho-
tographs. To overcome these difficulties, Chapter 2 discusses a good tool
called
STAMP
. This method has been developed from two techniques, “photo
collage” and “hypermedia.”
Photo collage
is a picture made by a combination
of bits of photographs.
Hypermedia
is a system for linking two pages by a
hyperlink, which, readers will recall, is commonly used in linking Web pages.
Combining these two techniques, STAMP integrates many photographs in
a quasi-three-dimensional geographical space through which we can virtu-
ally walk and thus experience. Chapter 2 also demonstrates an application
of STAMP to an ethnographic study in Mongolia. Note that STAMP is down-
loadable without charge via the Internet.
Chapter 3 introduces one of the high-tech methods for acquiring three-
dimensional data, namely, laser scanners. Having heard the term “laser
scanner,” one might recall a pointer of light used for highlighting a specific
place on a PowerPoint slide. In principle, the laser scanner discussed in
2713_C001.fm Page 9 Monday, September 26, 2005 2:48 PM
Copyright © 2006 Taylor & Francis Group, LLC
10
GIS-based Studies in the Humanities and Social Sciences
Chapter 3 (and also in Chapter 4) is similar to this, although the former is
a more advanced device that measures the round-trip time between a laser
and a shot point (spot) on the surface of an object. The three-dimensional
coordinates of the spot are estimated from the travel time, the angle of the
beam from the laser, and its location. By sweeping the beam over the surface,
the laser scanner obtains the data from the spots, called the “point-cloud”
data of the object, which provide the three-dimensional digital data after
editing. Chapter 3 illustrates this data-acquisition method in an easy-to-
understand manner. This chapter also describes a system for collecting and
organizing archaeological data, called
Archae-Collector
, it greatly helps schol-
ars acquire, organize, and share data among an excavation team, even during
the excavation work.
Chapter 4 also shows a method for acquiring spatial data with laser scan-
ners. A distinct difference between the methods in Chapter 3 and Chapter
4 is that the former acquire the spatial data of stationary objects, whereas
the latter determine those of moving forms. Chapter 4 considers a laser-
based system for recording the trajectories of pedestrians. This method is
easier and more precise than the conventional approach using a video cam-
era. A key technique of the new method is the ability to identify the trajectory
of the same pedestrian. Imagine many pedestrians walking in many direc-
tions in a railway-station hall during the rush hour. This technique is realized
through a pedestrian-walking model using the Kalman filter. The developed
system was installed on a railway-station concourse, and almost 100 percent
accuracy was achieved for a spatial density of less than 0.4 persons per
square meter. There are many potential applications in behavioral science,
sociology, environmental psychology, and human engineering.
Part 2, Spatial Databases, consists of Chapters 5, 6, and 7. Chapter 5 deals
with a historical population database. To study a structural change in the
population distribution of a region, population data covering 100 years are
necessary. However, such long time-span population records are usually not
available. Chapter 5 shows how to reconstruct historical population data
from ancillary sources. One of the most useful of these supportive informa-
tion sources is old maps. These old manuscripts do not show population,
but they illustrate the distribution of houses. A problem is how to convert
the areas occupied by houses into the number of inhabitants. Chapter 5 finds
an empirical function for this conversion based on the correspondence
between the areas occupied by houses in a district and an old document
showing the population in the same area. Using this function, Chapter 5
reconstructs the population grid data of the Kanto Plain for 1890 and 1930.
These data sets are integrated in the existing population-grid data sets of
1970 and 2000, and a 110-year population-grid database is constructed. Using
this database, Chapter 5 shows the structural change of population distri-
bution in the Kanto Plain over a period of 100 years. This population data-
base is accessible via the Internet.
Chapter 6 deals with a statistical database for urban areas. In urban eco-
nomics, such data are indispensable, but a problem exists in that there is no
2713_C001.fm Page 10 Monday, September 26, 2005 2:48 PM
Copyright © 2006 Taylor & Francis Group, LLC
Introduction
11
precise definition for urban areas. The legal definition of a city is often used
for an urban area, but many activities extend beyond jurisdictional bound-
aries, and legal “urban areas” are different from the actual ones. The federal
government of the U.S.A. has been trying to define actual urban areas since
1947. These are designated Standard Metropolitan Statistical Areas, Consol-
idated Metropolitan Areas, and Core-Based Statistical Areas. First, the central
cities are defined, and second, the suburban areas for each are formally
identified. However, this way of definition has become increasingly prob-
lematic in recent years, because a large number of subcenters have been
recognized to have emerged, and commuting patterns have become increas-
ingly complex.
Chapter 6 proposes a new iterative method for defining urban areas using
GIS called
urban employment areas
. The chapter considers a spatial database
constructed by applying this method, which includes the numbers of
employees and populations in 1980, 1985, 1990, and 1995; production (value
added); and private-capital stocks and social-overhead capital. This database
is accessible via the Internet.
Chapter 7 discusses the methods used in constructing a universal database
for archaeological observations. Generally speaking, one of the most difficult
problems encountered with GIS is spatial-data transfer among different
researchers, communities, and GIS software. Archaeological data are no
exception. To overcome this difficulty, a technical committee of the Interna-
tional Standard Organization, namely ISO/TC211, has proposed a data-
transfer standard that is being increasingly accepted by many countries and
that has actually become an international standard. However, this standard
is too general to manage particular research disciplines, as exemplified by
the need to accommodate the complexity of archaeological artifact charac-
teristics.
Based on a critical examination of traditional European as well as Japanese
methods, Chapter 7 proposes an object-oriented spatial database for man-
aging archaeological data in terms of the Unified Modeling Language (UML).
The object-oriented spatial database is distinct from the
layer-based
one that
manages spatial data with a collection of map sheets, for instance land use,
road, and railway maps, among others. The
object-oriented
spatial database
holds spatial data as an assemblage of geographical features that are char-
acterized by their classes and relationships. The
UML
is a widely used
language for describing object-oriented spatial databases in terms of pictorial
elements, such as squares, lines, arrows, and other features. Chapter 7 dem-
onstrates how to construct a spatial database for the management of feature
descriptions in archaeological sites using UML.
Part 3, Tools for Spatial Analysis, consists of Chapters 8, 9, and 10. Chapter
8 shows how to locate tools for spatial analysis via the Internet. As mentioned
in Section 1.1, the ordinary GIS software provides many basic tools for spatial
analysis, but they are not always sufficient to analyze specific situations in
the humanities and social sciences. Fortunately, a considerable number of
tools for advanced analysis have been developed by the GIS community,
2713_C001.fm Page 11 Monday, September 26, 2005 2:48 PM
Copyright © 2006 Taylor & Francis Group, LLC
12
GIS-based Studies in the Humanities and Social Sciences
and information about these is posted on the Internet. However, such infor-
mation is scattered across the Web, and it is difficult to find an appropriate
tool for a specific application. In fact, Google shows more than 3 million Web
sites referring to spatial analysis. Chapter 8 introduces two Web sites that
provide appropriate search engines. The first is served by the Center for
Spatially Integrated Social Sciences. The second, called
FreeSAT,
provides for
the locating of free software packages for spatial analysis. Both sites are easily
accessible via the Internet.
Chapter 9 illustrates how to use a toolbox for examining the spatial effect
of features on the distribution of events. In the real world, we notice many
events that occur at specific locations. These are called
spatial events
, and
they include the location of facilities in particular places. Spatial events are
in part affected by their constraining geography, in particular by influencing
elements that persist over a long time period. These durable controls are
called
infrastructural features
. Examples of these that have attracted research
in the humanities and social sciences are:
• Transport stations attracting crime in Los Angeles
• Mosques being usually located on hilltops in Istanbul
• Asthma sufferers residing 200–500 meters from major highways in
Erie County, New York
• Baltimore serial thieves having a tendency to migrate south along
the major roads
Chapter 9 introduces a user-friendly toolbox, called
SAINF
, which may be
used in the statistical analysis of these spatial relationships. SAINF can be
downloaded via the Internet without charge.
Chapter 10 demonstrates how to use a toolbox called
SANET
for analyzing
spatial events that occur in a network or alongside a network. These are
referred to as
network spatial events
. Some typical examples relevant to studies
in the humanities and social sciences are:
• Homeless people living on the streets
• Street crimes
• Graffiti sites along highways
• Traffic accidents
• Street-food stalls
• Fast-food stores in a downtown
The toolbox introduced in Chapter 10 is useful for answering, for instance,
the following questions:
• Does illegal parking tend to occur uniformly in no-parking streets?
2713_C001.fm Page 12 Monday, September 26, 2005 2:48 PM
Copyright © 2006 Taylor & Francis Group, LLC
Introduction
13
• Are street-crime locations clustered in “hot spots”?
• Do fast-food shops tend to compete with each other?
• What is the probability of consumers choosing a particular down-
town store?
Chapter 10 illustrates how to use the tools of SANET for finding answers
to these questions. SANET can be downloaded via the Internet without
charge.
Part 4, Applications of Spatial Analysis, consists of seven chapters, which
show spatial analyses in history (Chapter 11), archaeology (Chapters 12 and
13), sociology (Chapter 14), housing economics (Chapter 15), urban econom-
ics (Chapter 16), and educational administration (Chapter 17).
Chapter 11 presents an application of spatial analysis, or, in specific terms,
“spatial reasoning,” to a study in history. Historical facilities often reveal
historical evidence, and their locations are of particular interest. If there are
maps exactly indicating the locations of facilities, there will be no need for
a locations search. However, such historical maps are often unavailable, and,
even if they exist, a number of facilities may not be recorded on the maps.
In such cases, historical documents, if any, are only a means of inferring the
location. For this purpose, spatial reasoning can be of potential use.
Spatial
reasoning
is an attempt to infer the unknown locations of features and their
relationships from appropriate known sites. Chapter 11 illustrates the appli-
cability of spatial reasoning in historical analysis by its application to the
inference of spatial locations written about in Jean Chardin’s travel account
and his walking route in Isfahan in Iran in the 17th century.
Chapter 12 shows spatial analysis used in archaeology. In the eighth cen-
tury, much of Japan was ruled within a hierarchy of administrative districts
called the
go-ri
system. A
go
comprised 50 houses (called
ko
), and this was
divided into two or three
ris
. On average, a
go
contained more than 1000
persons. There has been a long debate over whether the
go
and
ri
show the
actual villages and families at the time or whether they were predominantly
contrived by the authorities. Most scholars agree that administrative influ-
ence was strong, but opinions differ over the extent to which the divisions
reflect the reality of ancient Japan. Chapter 12 attempts to answer this ques-
tion by reconstructing agricultural productivity in the West Wakasa region
using GIS.
Chapter 13 also shows spatial analysis, or, in specific terms, “site-catch-
ment analysis,” in archaeology. In the late 20th century, the Sannai-
Maruyama site (5900 to 4200 BP) was excavated in the northern part of Japan.
This site is distinctly different from others in Japan in two respects. First, the
number of dwellings was greater than the archaeologists first considered.
Fifty to 100 houses were discovered in one archaeological phase, suggesting
that 200 to 400 hundred people lived together. Second, the life span of villages
was much longer than first believed. Most villages were maintained for one
to three generations (50–100 years), and people lived continuously at this
2713_C001.fm Page 13 Monday, September 26, 2005 2:48 PM
Copyright © 2006 Taylor & Francis Group, LLC