GIS Based Studies in the Humanities and Social Sciences - Chpater 3 potx
Bạn đang xem bản rút gọn của tài liệu. Xem và tải ngay bản đầy đủ của tài liệu tại đây (5.03 MB, 20 trang )
35
3
A Laser-Scanner System for Acquiring
Archaeological Data: Case of
the Tyre Remains
Ryosuke Shibasaki, Takura Izumi, Hiroya Tanaka,
Masafumi Nakagawa, Yosinori Iwamoto, Hidetomo Fujiwara,
and Dinesh Manandhar
CONTENTS
3.1 Introduction 36
3.2 A New, Three-Dimensional Measurement Device:
Laser Scanner 37
3.3. Architecture of a System for Collecting and Organizing
Archaeological Remain Data (Archae-Collector) 38
3.3.1 Data Types and Objects 38
3.3.1.1 Archaeological Remains 39
3.3.1.2 Archaeological Relics 40
3.3.1.3 Other Documents 40
3.3.2 Associations Among Data 41
3.3.3 Architecture of a System for Collecting and Organizing
Archaeological Information (Archae-Collector) 42
3.4 Three-Dimensional Data Acquisition and Model
Development with a Laser Scanner 44
3.4.1 Types of Laser Scanners and Their Combinations 44
3.4.2 Geometric Registration of Laser-Scanner Data 45
3.4.3 Reconstruction of Three-Dimensional Shapes from
Laser-Scanner Data 47
3.4.4 Visualization by Combining Laser-Scanner Data and
Digital-Camera Images 49
3.5 Implementation of an Example of Archae-Collector 51
3.6 Conclusions and Future Prospects 53
Acknowledgment 54
References 54
2713_C003.fm Page 35 Monday, September 26, 2005 7:36 AM
Copyright © 2006 Taylor & Francis Group, LLC
36
GIS-based Studies in the Humanities and Social Sciences
3.1 Introduction
Excavation in archaeology is conducted to acquire and collect information
on archaeological remains and relics in a systematic way using limited time
and human resources. Data to be collected are so diversified. The data
ranges from overall structure of archaeological remains and relations of
strata, details of individual parts of archaeological remains, and informa-
tion on each relic, such as its classification, location, and strata of unearthed
position, its three-dimensional shape, and photos. These voluminous and
diversified pieces of information should be efficiently collected, acquired,
and organized in such a manner that the relationships among them can be
easily retrieved.
In recent years, digital camera, laser scanners, spatial-database manage-
ment system, such as Geographic Information Systems (GIS), and three-
dimensional drawing and modeling tools, such as Computer Aided
Design (CAD), have made very rapid progress. The advances make it so
easy to acquire digital data on archaeological remains and relics. At the
same time, it also provides a possibility of developing new types of prod-
ucts, such as three-dimensional models. In addition, using the Internet,
the digital data can be easily shared among archaeologists. Through shar-
ing digital archaeological data among larger numbers of researchers, com-
parative studies and analysis from more diversified viewpoints can be
promoted, which will eventually result in greater contribution to the
advances in archaeology.
To actually realize more efficient acquisition and collection of informa-
tion and sharing in archaeological excavation, how to use and combine
advanced sensors, devices, and software has to be discussed and devised.
Sensors, data-measurement devices, and software are tools. They require
know-how and ideas to effectively apply, just like carpenter tools alone
are not enough to build a good house if no skills and know-how are
combined with them. Good “design”
on how and in which aspects to use,
combine them for excavation, and subsequent organizing and analyzing
works is really a key. Good design may also reveal some missing links,
i.e., a kind of software and devices to be developed especially for archae-
ological excavation.
This section reports an example of “good design” on how to better use
three-dimensional measurement tools, such as laser scanners and data-
management tools, such as GIS, including newly developed software and
know-how to fill gaps between advanced technologies and the demand
in archaeological excavation, through a case study of Tyre remains, Leb-
anon.
2713_C003.fm Page 36 Monday, September 26, 2005 7:36 AM
Copyright © 2006 Taylor & Francis Group, LLC
A Laser-Scanner System for Acquiring Archaeological Data
37
3.2 A New, Three-Dimensional Measurement Device:
Laser Scanner
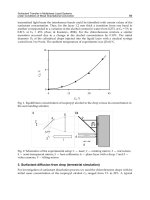
For the past four or five years, laser scanners for three-dimensional measure-
ment have become drastically cheaper and smaller, and therefore, much more
popular (Figure 3.1). Laser scanners acquire three-dimensional shape data on
an object in the following process. At first, as shown in Figure 3.2, a laser
scanner emits a laser beam and measures the return time of the beam reflected
on the surface of the object. From the travel time of the laser beam, the exact
distance between the laser scanner and the object is measured. In parallel,
beam angle, i.e., horizontal and vertical angles, are measured. By combining
the distance,
the horizontal and vertical angle, the three-dimensional coordi-
nate values relative to the laser scanner can be computed. By repeating this
process with an incremental change in angles several thousand to several
hundred thousand times per second, a very large amount of three-dimensional
points are generated. The three-dimensional point data acquired in this man-
ner is called “point-cloud” data. With the three-dimensional point-cloud data,
the shape of the object surface is represented. The measurement accuracy
usually ranges from several millimeters to several centimeters. Another
method of three-dimensional measurement employs photographs and images.
A typical example is photogrammetry. By taking pictures of an object from
different viewing angles and measuring the location of the object in the pho-
tographs or images, three-dimensional location of the object can be estimated.
But this measurement process requires exact estimation of position and atti-
tude of a camera or an imaging device in image data acquisition. The estima-
FIGURE 3.1
Laser scanner in Tyre, Lebanon.
2713_C003.fm Page 37 Monday, September 26, 2005 7:36 AM
Copyright © 2006 Taylor & Francis Group, LLC
38
GIS-based Studies in the Humanities and Social Sciences
tion of the position and attitude also require the measurement of the image
coordinates of ground control points, or GCPs, with exact ground coordinate
values measured in advance. In addition, stereoscopic observation for the
three-dimensional measures needs some training. Although cameras them-
selves have become digital devices that are very easily operated, the prepara-
tion and skill needed for three-dimensional measurement make the digital
photogrammetry a bit difficult for the ordinary archaeologist. On the other
hand, laser scanners, though still quite expensive, make it possible to automate
the three-dimensional data acquisition. Automation in measurement is a great
advantage of laser scanners over the other measurement devices.
3.3. Architecture of a System for Collecting and Organizing
Archaeological Remains Data (Archae-Collector)
3.3.1 Data Types and Objects
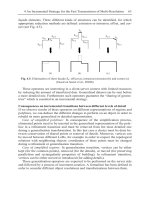
Major types of data collected and generated through excavation include
drawings, documents, and photos, not limited to three-dimensional mea-
surement data with laser scanners. This chapter proposes the architecture of
a system for collecting and organizing data from archaeological excavations,
before describing three-dimensional measurement and modeling of archae-
ological sites. Objects for data collection and generation are classified as
follows:
FIGURE 3.2
3D measurement with a ground-based laser scanner.
Laser Spot
Vertical
scanning angle
Laser beam
Laser range scanner
Distance
Horizontal
scanning angle
2713_C003.fm Page 38 Monday, September 26, 2005 7:36 AM
Copyright © 2006 Taylor & Francis Group, LLC
A Laser-Scanner System for Acquiring Archaeological Data
39
1. Archaeological remains
2. Archaeological relics
3. Excavation work records such as schedule
3.3.1.1 Archaeological Remains
Archaeological remains are mainly represented by a series of drawings,
ranging from relatively macroscopic ones of the overall configuration to
more microscopic ones on three-dimensional details of individual parts.
Drawings reflect the results of judgments on what are important enough
to record, as well as the geometric properties of the remains. In this sense,
drawings are regarded as a unique form of representation, rather than a
symbolic representation of geometric properties. However, because what
is considered to be trivial in making drawings may be found to be impor-
tant afterwards, it is necessary to record source data, such as three-dimen-
sional measurement data and photo data. For the acquisition of three-
dimensional data, considering the diversity of archaeological remains in
size and required accuracy, the combination of other three-dimensional
measurement methods, such as aerial photogrammetry, ground-based pho-
togrammetry, and ground-based survey, rather than laser-scanning
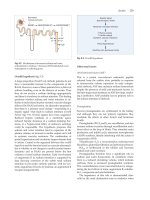
devices, should be considered. Moreover, sketches and photos are also
important as complementary data to the drawings and three-dimensional
measurement data. Especially, photo data can record colors and texture.
They can apply to any locations where laser scanners are difficult to apply.
In addition, they are effective to let archaeologists easily record with short
FIGURE 3.3
Example drawings of archaeological remains.
2713_C003.fm Page 39 Monday, September 26, 2005 7:36 AM
Copyright © 2006 Taylor & Francis Group, LLC
40
GIS-based Studies in the Humanities and Social Sciences
memoranda any findings during excavation. In some specific situations,
such as excavation of an underground tomb, it may be necessary to record
additional sensor data, such as temperature, humidity, and deformation of
tomb walls.
3.3.1.2 Archaeological Relics
For recording archaeological relics, drawings, their complementary photos
and documents describing classification results, archaeological strata, and
estimated era are generated. Three-dimensional geometry of relics can be
measured with a laser scanner. For smaller articles, however, stereoscopic
measurement with photos and its combination with laser-scanning devices
can be applied. Generally, measurement accuracy of laser scanners becomes
no better, even though the laser scanners get closer to the objects. On the
other hand, photos or images-based measurement, such as photogrammetry,
can be more accurate, in case measurement cameras get closer to objects. It
can be more advantageous for the measurement of relatively small articles
or objects.
3.3.1.3 Other Documents
Information on archaeological relics and remains obtained through an exca-
vation can be easily linked to a daily log of excavation works. These links
describe which stages the excavation works are in and what kinds of relics
were found in which situation. Daily logs or time records of excavation
FIGURE 3.4
Examples of handwritten sketches, digital photos of archaeological remains and relics.
2713_C003.fm Page 40 Monday, September 26, 2005 7:36 AM
Copyright © 2006 Taylor & Francis Group, LLC
A Laser-Scanner System for Acquiring Archaeological Data
41
works are regarded as supplementary data in archaeological reports com-
pared with analysis and examination results. However, it is very straight-
forward and easy to organize information on archaeological relics and
remains by connecting them to daily logs or time records of excavation
works. Locations can also be easily linked to information on relics for easy
data management.
3.3.2 Associations Among Data
To organize a wide variety of data so that users can easily retrieve what they
want, it is necessary to provide keys for easy query and to provide associa-
tions among data to let users track them in data retrieval. The most funda-
mental keys are location and time. Unearthed relics and remains can be
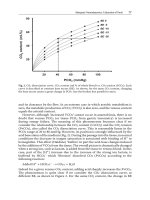
directly associated with location (Figure 3.5). Time has two classes: time of
excavation and strata. Time of excavation can be used to establish links
between data or records and daily logs of excavation (Figure 3.6). Establish-
ing links to location and time make it possible to retrieve data from the
location and strata where relics and remains are excavated.
In addition, in archaeological reports and articles, information on relics and
remains are associated with each other along with the viewpoints of analysis
or the context of discussion and speculation. Such associations, if recorded
FIGURE 3.5
Links of individual records of archaeological relics and remains to location and strata.
record
record
record
record
record
record
record
record
Link to location
and strata
Links generated
in data
acquisition
record
Succession
of Strata
GIS
(Geographic
Information
System)
2713_C003.fm Page 41 Monday, September 26, 2005 7:36 AM
Copyright © 2006 Taylor & Francis Group, LLC
42
GIS-based Studies in the Humanities and Social Sciences
explicitly so that other researchers retrieve and examine data along with them,
may help others find new aspects or viewpoint of analysis (Figure 3.7).
3.3.3 Architecture of a System for Collecting and Organizing
Archaeological Information (Archae-Collector)
To effectively apply devices of collecting and acquiring digital data, such as
laser scanners, to archaeological excavations, it is necessary to support the
entire process, including the description of associations among various types
of collected data, the attachment of space and time keys, and data-manage-
ment scheme using those keys, as well as to provide measurement methods
using laser scanners. Here we name a system for collecting and organizing
FIGURE 3.6
Links of individual records of archaeological relics and remains to excavation timetables.
FIGURE 3.7
Links of individual records of archaeological relics and remains to excavation reports and
archaeological articles.
Time
record
record
Link to excavation
time and order
Excavation schedule
record
record
record
record
record
record
record
Report or article
record
record
record
record
record
Link to documents
record
record
record
Analysis/
modeling
tools
record
HTML
Browser
2713_C003.fm Page 42 Monday, September 26, 2005 7:36 AM
Copyright © 2006 Taylor & Francis Group, LLC
A Laser-Scanner System for Acquiring Archaeological Data
43
archaeological information, “Archae-collector,” the architecture of which is
shown in Figure 3.8. All data records, such as three-dimensional data, draw-
ings, photos, and documents, are linked to space, time, and documents, such
as excavation reports or archaeological articles. Tools to help develop and
use linked data records are provided so that users make an access to and
use necessary data by tracking the links. So far, researches or projects have
been conducted on the development of large-scale, three-dimensional mod-
els of cultural heritage (e.g., Ikeuchi et al., 2003) and on digital-archive
systems for world heritage (e.g., Digital Archive Network for Anthropology
and World Heritage [DANA-WH]). The former type of researches focus on
the development of three-dimensional models, and the latter types of
researches or projects postulate that digital archaeological data are already
organized and recorded in a database and that metadata are attached to let
users find out necessary information. Archae-Collector focuses on the pro-
cess ranging from the primary data acquisition by excavation to the estab-
lishment of associations or links among the data to enable data management
using a database.
Links to space and time can be described mainly by map coordinates and
time. In addition to the coordinate systems, geographic or location names
and relative position defined within maps and images can be used as spatial
tags. Data retrieval through links of space and time can be realized with GIS.
Description rules of space and time tags are now being standardized by
FIGURE 3.8
Supporting, acquiring, and linking archaeological data: An architecture of Archae-Collector.
Time
Report or article
record
record
record
record
Link to excavation
time and order
Excavation schedule
Link to documents
record
record
record
Link to location
and strata
Links generated
in data acquisition
and handling tools
+ Laser scanner,
digital camera etc.
record
Succession
of Strata
GIS
(Geographic
Information
System)+
GML
(Geographic
Mark-up
Language)
HTML
Browser
record
2713_C003.fm Page 43 Monday, September 26, 2005 7:36 AM
Copyright © 2006 Taylor & Francis Group, LLC
44
GIS-based Studies in the Humanities and Social Sciences
International Standardization Organization (ISO) in the form of Geographic
Mark-up Language (GML). GML is expected to be International Standard
(IS) in one or two years at present (2004). On the other hand, links to data
records from reports and articles can be easily implemented with Hyper Text
Mark-up Language (HTML).
3.4 Three-Dimensional Data Acquisition and Model
Development with a Laser Scanner
The authors applied the combination of different types of laser scanners
to the three-dimensional measurement at Tyre remains, Lebanon, because
we aim to explore the possibility of laser scanners for archaeological exca-
vation and discuss how laser scanners should be applied and what kinds of
software tools and know-how are needed for an archaeologist to use in a
variety of excavation works. In the following sections, findings of know-how
and development of tools are described based on the Tyre case.
3.4.1 Types of Laser Scanners and Their Combinations
There are trade-off relationships between measurement speed (how many
points can be measured per second) and measurement accuracy of a laser
scanner. Laser scanners with high scanning speed tend to have lower accu-
racy, while the improvement of measurement accuracy may lower the mea-
surement speed. Two types of laser scanners can be found in the market,
one with higher accuracy with the order of millimeter but with low mea-
surement speed (more than 10 minutes for a single shot), and the other with
lower accuracy with the error of several centimeters but with high scanning
speed (several tens of seconds to one minutes for a single shot).
Surfaces of an object can be represented more faithfully using three-dimen-
sional measurement with a laser scanner with higher accuracy and resolution.
When the surfaces are represented more faithfully with higher density of
points, interpolation of the surface and geometric registration of neighboring
laser-scanner data can be made more easily, resulting in a higher level of
automation. On the other hand, it is not so easy to automate geometric regis-
tration and interpolation of laser-scanner data with coarser resolution and
lower accuracy.
Some of the laser scanners can measure the reflection intensity of a laser
beam from an object. By putting a high reflectivity seal on the surfaces of an
object, the seals can be easily recognized in the reflection-intensity images.
Those seals can be used as control points for geometric registration of over-
lapping laser-scanner data and for establishing transformation to a map-coor-
dinate system.
Figure 3.9 summarizes laser scanners and their features applied at Tyre.
These are good representatives of different scanner types. Appropriate scan-
2713_C003.fm Page 44 Monday, September 26, 2005 7:36 AM
Copyright © 2006 Taylor & Francis Group, LLC
A Laser-Scanner System for Acquiring Archaeological Data
45
ners had to be selected and combined according to the spatial extent of sites
and the requirements in measurement accuracy and density of points. In the
case of Tyre, LMS-Z210 (Riegl) was mainly applied to a wide Hippodrome,
while Cyrax 2500 (Cyra Technology/Leica Geosystems) and IMAGER 5003
(Zoller
+
Froehlich GmbH) were applied to measure the detail of individual
structures and remains. Figure 3.10 shows data examples acquired by the
three laser scanners. Cyrax 2500 has relatively high measurement accuracy
(several millimeters) and high density of measurement points, though it is
not so fast in data acquisition. IMAGER 5003 also has high accuracy and
high density and is not so slow in scanning speed. LMS-Z210 is relatively
quick in data acquisition and can cover wider areas, because the measure-
ment range is longer than the others, but has less accuracy (several centime-
ters) and lower density of points compared with the others.
3.4.2 Geometric Registration of Laser-Scanner Data
Since ground-based laser scanners emit a laser beam from a location on
the ground, the spatial extent of measurement from that location is limited
due to many occlusions. To cover an entire archaeological remain, laser-
scanner data obtained at many different locations have to be integrated or
registered with each other. As shown in Figures 3.11 and 3.12, at first,
corresponding points between neighboring laser-scanner data are to be
FIGURE 3.9
Laser scanners applied at Tyre, Lebanon.
Horizontal resolution
Vertical resolution
Min. 0.25mm (50m)
Min. 0.25mm (50m)
Max.
Max.
1000points/column
1000points/row
Horizontal direction
Vertical direction
40°
40°
Scanning pitch
Field of view
Horizontal resolution Vertical resolution
0.24° 0.024°
Max. Max.
36000points/column 15000points/row
Horizontal direction Vertical direction
340° 80°
Scanning pitch
Field of view
Horizontal resolution Vertical resolution
0.01° 0.018°
Max. Max.
36000points/column 15000points/row
Horizontal direction Vertical direction
360° 310°
Scanning pitch
Field of view
Cyrax 2500 (CyraTechnologies
/LeicaGeosystems)
LMS-Z210 (RIEGL)
IMAGER5003 (Zoller + Froehlich GmbH)
2713_C003.fm Page 45 Monday, September 26, 2005 7:36 AM
Copyright © 2006 Taylor & Francis Group, LLC
46
GIS-based Studies in the Humanities and Social Sciences
FIGURE 3.10
Data from the three laser scanners.
FIGURE 3.11
Finding corresponding points among neighboring laser-scanner data (Takase et al, 2002).
Cyrax 2500 (Cyra Technologies
/Leica Geosystems)
LMS-Z210 (RIEGL)
IMAGER5003 (Zoller+Froehlich GmbH)
Corresponding points
2713_C003.fm Page 46 Monday, September 26, 2005 7:36 AM
Copyright © 2006 Taylor & Francis Group, LLC
A Laser-Scanner System for Acquiring Archaeological Data
47
identified. Second, relative position and attitude of the neighboring laser
scanners are estimated using the corresponding points. Since Cyrax 2500
data, as shown in Figure 3.10, has relatively high accuracy and higher
density of points, it is rather easy to find corresponding points. In the case
of LMS-Z210, accuracy and point density are relatively low, and it is not
always easy to identify the accurate location of corresponding points. LMS-
Z210, however, can record the reflection intensity of reflection points. Small
reflection seals on the surface of an object can be easily identified as a
bright spot in the reflection-intensity image. By using these bright spots of
reflection seals as “tie points,” neighboring laser-scanner data can be reg-
istered with each other. In addition, by measuring the map-coordinate
values of the bright spots, laser-scanner data can be transformed to the
map-coordinate system. Figure 3.13 is the final results of the registration
of laser data for the Hippodrome.
3.4.3 Reconstruction of Three-Dimensional Shapes from
Laser-Scanner Data
Data directly derived from laser scanners are the three-dimensional coordi-
nate values of points that reflect laser beams. Even with a single scan, a large
number of data are generated. When the point-cloud data are visualized
from viewpoints relatively close to the data, point data on both visible
surfaces and occluded surfaces appear on the screen, which may make it
hard for users to interpret correctly the three-dimensional geometry among
the points. To avoid this, surfaces should be generated through the interpo-
lation of neighboring points. Point data on occluded surfaces are really
hidden by the interpolated surfaces, which help a user naturally grasp the
FIGURE 3.12
Final results of merging 46 shots (Takase et. al, 2002).
Composite result of 46 shots
2713_C003.fm Page 47 Monday, September 26, 2005 7:36 AM
Copyright © 2006 Taylor & Francis Group, LLC
48
GIS-based Studies in the Humanities and Social Sciences
three-dimensional structure (Figure 3.14). In addition, from interpolated sur-
faces, cross-sectional drawings can be generated by cutting an object with a
plane. In interpolating surfaces, usual practice is to select three neighboring
points to form a triangle and to define a triangular plane. This network of
points connected to generate triangular planes or patches is called Triangu-
lated Irregular Network (TIN).
In interpolating triangular planes, higher-density accuracy of points helps
automate a process of finding appropriate neighbors of points and of forming
triangular patches. On the other hand, if the accuracy and density is not high
enough, it may increase the difficulties in finding out correct neighborhood
relationships among points, which may result in the failure of the automated
FIGURE 3.13
Results of merging LMS-Z210 data of the Hippodrome.
FIGURE 3.14
Comparing point-cloud data with surface patches interpolated from the point-cloud data.
2713_C003.fm Page 48 Monday, September 26, 2005 7:36 AM
Copyright © 2006 Taylor & Francis Group, LLC
A Laser-Scanner System for Acquiring Archaeological Data
49
processing. The same kinds of issues may arise, especially in connecting a
number of laser-scanner data and in making interpolation of surfaces in
places where point-cloud data from several laser scanners are overlapping.
On the other hand, interpolated surfaces from point-cloud data may not
represent the geometry of real surfaces very faithfully, if interpolation
methods are not correctly chosen. For example, if users apply an interpo-
lation method that tends to excessively smooth sharp peaks, edge lines of
the original surfaces may disappear. Selection of surface-interpolation
methods has to be made based on geometric properties of original surfaces.
It also suggests that raw laser-scanner data (point-cloud data) should be
kept together with the interpolated surface data in order to interpolate
surfaces again in case it is found that the interpolation results are inappro-
priate. The original point-cloud data may be helpful even for generating
quick-look images, because visualization of surfaces requires a relatively
large computational load to evaluate the visibility of individual surfaces
from a viewpoint. Point-cloud data require no such computation.
3.4.4 Visualization by Combining Laser-Scanner Data and Digital-
Camera Images
Since laser-scanner data measure just the geometric properties of an object,
digital-camera images should be “overlaid” to record or visualize colors and
texture of the original surfaces. To accurately overlay or drape digital-camera
images onto three-dimensional shape data, the relative position and attitude
of a digital camera in taking images have to be estimated against the three-
dimensional laser-scanner data (Figure 3.15). Estimation of the position and
attitude of the digital camera can be made by identifying and measuring the
location of corresponding points between digital-camera images and laser-
scanner data. A method is proposed to automate the identification of corre-
sponding points. In an example shown in Figure 3.15, a pseudo-digital-
camera image, an image which might be taken by a digital camera located
at a specific position and viewing angle, is generated using the laser-scanner
data and, afterwards, corresponding points are automatically identified
between the pseudo-digital-camera image and the real digital-camera image.
By using the pseudo-digital-camera image, not the laser-scanner data,
directly, the reliability and accuracy of identifying the corresponding points
can be improved.
Figure 3.16 shows the results of draping or projecting a digital-camera
image onto the laser-scanner data, based on the estimation results of the
camera position and attitude. By correctly reconstructing the geometry
between the digital camera and the laser-scanner data, we can compute
which three-dimensional point in the point-cloud data corresponds to which
pixel in the digital-camera data. In this example, colors or red, green, blue
data in the digital-camera image are assigned to the corresponding point
data in the point-cloud.
2713_C003.fm Page 49 Monday, September 26, 2005 7:36 AM
Copyright © 2006 Taylor & Francis Group, LLC
50
GIS-based Studies in the Humanities and Social Sciences
FIGURE 3.15
Determining the position and attitude of camera against the coordinate system of the laser
point-cloud data.
FIGURE 3.16
(See color insert following page 176.)
Perspective images of the 3D
+
textured data of stepped
stadium from different viewpoints.
x
z
y
roll
pitch
yaw
Original digital camera image
Pseudo-digital-camera image
generated from the laser-point-
cloud data
ree-dimensional
transform
Correspondence
2713_C003.fm Page 50 Monday, September 26, 2005 7:36 AM
Copyright © 2006 Taylor & Francis Group, LLC
A Laser-Scanner System for Acquiring Archaeological Data
51
3.5 Implementation of an Example of Archae-Collector
Figure 3.17 is a schematic overview of a prototype of Archae-Collector imple-
mented with PhotoWalker (Tanaka et al., 2001) and GIS. Collected data have
not only spatial links but also proximity links representing neighborhood
relationships among data. A mechanism that allows users to track and down-
load data along with the proximity links is realized by using PhotoWalker.
Figures 3.18 and 3.19 present examples of tracking Tyre data along with the
proximity links. Perspective images generated from laser-scanner data are
mixed among digital-camera images. The perspective images provide outline
information on laser-scanner data so that users can evaluate the relevance
of the laser-scanner data before they download large files. PhotoWalker uses
Universal Resource Locator (URL) to describe the location or link of the data.
If users find it necessary, they can easily move to the FTP site to download
point-cloud data from laser-scanner data or the other data products, such as
three-dimensional surface data, with colors and texture. In addition, those
linked data can be easily made open to public through the Internet.
After users download data products, they may want to make drawings.
To support the drawing works, Archae-Collector provides methods and
tools. For example, by projecting point-cloud data onto a plane properly
selected by a user, users can recognize features of archaeological relics and
FIGURE 3.17
Outline of links among data generated from Tyre data.
Associations among neighboring
photos and 3D data
Associations among neighboring
photos and 3D data
Pseudo 3D space
Pseudo 3D space
Links to location
Links to location
GIS application
GIS application
++ +
Position data Position data Position data
Geo-referencing
Geo-referencing
Laser Scanner
Data
Digital PhotoDigital Photo
Photo Walker
2713_C003.fm Page 51 Monday, September 26, 2005 7:36 AM
Copyright © 2006 Taylor & Francis Group, LLC
52
GIS-based Studies in the Humanities and Social Sciences
remains, such as the location of walls and edge lines of stones. Users can
draw lines and curves on the projection image. If laser-scanner data are
geometrically registered with digital-camera images, a tool is available that
FIGURE 3.18
An example of data links in Archae-Collector (Albaas Area).
FIGURE 3.19
An example of underground tomb data links in Archae-Collector (Ramali Area).
2713_C003.fm Page 52 Monday, September 26, 2005 7:36 AM
Copyright © 2006 Taylor & Francis Group, LLC
A Laser-Scanner System for Acquiring Archaeological Data
53
allows users to generate three-dimensional lines and curves just by drawing
lines and curves directly on the digital-camera images. Behind the tool, when
users draw lines and curves on the digital-camera images, three-dimensional
laser-point data corresponding to those lines and curves can be extracted.
By fitting lines and curves to the extracted three-dimensional points, three-
dimensional lines and curves can be generated. By connecting those three-
dimensional lines and curves, three-dimensional surface models of relics and
remains can be developed. By projecting those lines and curves, drawings
can be generated. Figure 3.20 demonstrates example drawings generated
with the methods mentioned above.
3.6 Conclusions and Future Prospects
We propose a system called Archae-Collector that includes a method of
developing three-dimensional data with colors and texture by geometrically
registering and integrating laser-scanner data and digital-camera images and
a method of linking those data products using multiple links, such as loca-
tion, strata, time, and context of analysis. Archae-Collector helps users orga-
nize a variety of digital data by establishing links among them without
designing complicated data structures for databases. In addition, the data
linked with others can be easily made open to the public through the Internet.
FIGURE 3.20
An example of drawings of the tomb at Ramali, generated from laser data.
2713_C003.fm Page 53 Monday, September 26, 2005 7:36 AM
Copyright © 2006 Taylor & Francis Group, LLC
54
GIS-based Studies in the Humanities and Social Sciences
With these reasons, we believe Archae-Collector effectively helps archaeol-
ogists acquire/collect, organize, and share data among an excavation team,
even during the excavation work. In addition, we developed several tools
to help make traditional drawings from laser-scanner data and digital-cam-
era imagery. Since this tool requires no skills, such as stereoscopic measure-
ment, archaeologists will find it easy to use for providing traditional
excavation reports with drawings and photos. If they find it necessary to
conduct a query to the whole datasets, data products developed with Archae-
Collector can be transferred to a database, because individual data products
already have tags of location, strata, time, etc., and are linked with each
other. In this sense, Archae-Collector can be regarded as a quick data-collec-
tion and organizing tool to get data well-prepared for the development of a
full-fledged database.
Acknowledgment
The authors express special thanks to the members of Nara University
Archaeological Team (led by Professor T. Izumi), Yu Fujimoto, Keiji Takase,
Susumu Morimoto, and the other team members, Dr. Yutaka Takase and
Osamu Yamada (CAD Center Corporation), Masato Shimizu (Kokusai
Kogyo Corporation), Ryutaro Okugawa, Akira Iwata, and Hiroyasu Sasaki
(Toshiba Engineering Corporation) for their contributions.
References
Digital Archive Network for Anthropology and World Heritage (DANA-WH),
www.dana-wh.net/home/.
Fujiwara, H., Nakagawa, M., and Shibasaki, R., Automated texture mapping for 3D
modeling of objects with complex shapes — a case study of archaeological
remains, The 24th Asian Conference on Remote Sensing, Busan, Korea, 2003.
Ikeuchi, K., Nakazawa, A., Hasegawa, K., and Ohishi, T.,
The Great Buddha Project:
Modeling Cultural Heritage for VR Systems through Observation
, IEEE ISMAR03,
Tokyo, 2003.
Takase, Y., Sasaki, Y., Nakagawa, M., Shimizu, M., Yamada, O., Izumi, T., and Shiba-
saki, R.,
Reconstruction With Laser Scanning and 3D Visualization of Roman Mon-
uments and Remains in Tyre, Lebanon
, proceedings of ISPRS WG V/4 and IC
WGIII/V, (CD-ROM), 2002.
Tanaka, H., Arikawa, M., and Shibazaki, R., A 3D photo collage system for spatial
navigations, International Conference Digital City Workshops, 2001.
2713_C003.fm Page 54 Monday, September 26, 2005 7:36 AM
Copyright © 2006 Taylor & Francis Group, LLC