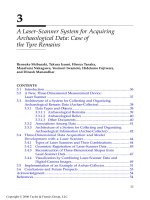
GIS Based Studies in the Humanities and Social Sciences - Chpater 14 ppt
Bạn đang xem bản rút gọn của tài liệu. Xem và tải ngay bản đầy đủ của tài liệu tại đây (2.3 MB, 20 trang )
191
14
Migration, Regional Diversity, and
Residential Development on the Edge of
Greater Cairo — Linking Three Kinds of Data
— Census, Household-Survey, and
Geographical
— with GIS
Hiroshi Kato, Erina Iwasaki, Ali El-Shazly, and Yutaka Goto
CONTENTS
14.1 Introduction 191
14.2 Data and Methodology 192
14.2.1 Data 192
14.2.2 Selection of the Survey Areas 193
14.2.3 Data Sampling 194
14.3 Migration and Regional Categorization 196
14.3.1 Migrants’ Villages of Origin 197
14.3.2 Characteristics of the Regions of Origin 198
14.4 Migration and Residential Development 203
14.4.1 Constructing the Building Map 203
14.4.2 General Description of the Survey Areas 204
14.4.3 Settlement Patterns and Residential Development 204
14.5 Conclusions 207
References 209
14.1 Introduction
In Egypt, major social problems occur in urban areas, because the areas
absorb people who move from rural areas to find work. To understand the
2713_C014.fm Page 191 Monday, September 26, 2005 7:39 AM
Copyright © 2006 Taylor & Francis Group, LLC
192
GIS-based Studies in the Humanities and Social Sciences
urban–social problems, it is also necessary to understand rural societies,
because the social problems in urban areas reflect the rural transformation.
Therefore, migration that relates both urban and rural sectors is an apposite
topic in the study of Egyptian society. However, it was fairly difficult to carry
out the studies of Egyptian migration that considered the linkage between
urban and rural societies. Major reasons are the difficulty in conducting a
survey and the lack of reliable maps. Also, military and security restrictions
hampered empirical studies based on microdata and maps. Fortunately,
these constraints lessened after the introduction of the open-economic policy
in the 1980s. Surveys in urban and rural areas are now becoming easier (Datt,
1998; Nagi, 2001; Assad, 2002; Government of Egypt, 2002), and there is a
better environment in which the impact of migration can be examined by
using many different materials and methods. Taking advantage of this better
environment, this chapter shows how to integrate various macrodata and
microdata with Geographical Information Systems (GIS)
to analyze migra-
tion behavior in Egypt.
This chapter is composed of five sections, including this introductory
section. The next section, Section 14.2, introduces the sources of data and
methodology for the survey. Section 14.3 analyzes determinants of migration
from rural areas to two survey areas in urban areas. Section 14.4 examines
residential developments resulting from migration. The chapter ends in Sec-
tion 14.5, summarizing major results with remarks on future studies.
14.2 Data and Methodology
14.2.1 Data
This chapter links three kinds of data: macrodata, mainly provided by the
population census; household-survey microdata; and geographical data.
Statistical data on modern Egypt are relatively abundant, as the population
census has been published almost every 10 years from the end of the 19th
century (CEDEJ, 2004). The linkage of these macro statistical data with geo-
graphical data from maps, as well as the collection of household-survey facts,
gives originality to this study. Central Agency for Public Mobilization and
Statistics (CAPMAS) has a department of GIS working to digitize maps that
display various facts about Egypt. For example, the administrative digital
map at the village level available from this center enables the integration of
the census and microdata with GIS data at village level.
It is now possible to view concurrently both the rural areas and Greater
Cairo, which are connected through migration, and analyze the spatial pat-
terns of migration and settlement.
2713_C014.fm Page 192 Monday, September 26, 2005 7:39 AM
Copyright © 2006 Taylor & Francis Group, LLC
Migration, Regional Diversity, and Residential Development
193
Geographical data, such as location of the apartments where each house-
hold resides, as well as migrants’ home villages, was collected during field-
work. We personally undertook the collection of geographical data for this
study because of the following two reasons.
The first is technical and is related to the sampling problem. As there is
no information available on the birthplace of residents, it was necessary to
check all families living in the survey areas to find those household heads
who had been born in rural areas. Information was also needed on where
the target homes were situated, and the street names, blocks, buildings, and
floors. As will be discussed, the surveyed areas are relatively new develop-
ments without urban planning and, without the fieldwork information, it
would have been impossible to identify the target households.
The second reason is related to the research interest. Data on the sources
of rural migrants and where they have settled are essential indicators of
migration patterns.
The collected geographical data was coded and attached to the digital map
provided by CAPMAS. A building-level digital map of the surveyed areas
was also prepared using this base map as a reference, as described below.
14.2.2 Selection of the Survey Areas
As is well known, Egypt is a typical hydraulic society based on the Nile
River, which divides into two main branches and forms a delta just north of
Cairo. Egypt is administratively composed of two regions: Lower Egypt is
the northern part of the country from Cairo to the Mediterranean, and Upper
Egypt is the southern part from Cairo to the border between Egypt and
Sudan. Each region is divided into three hierarchical divisions: governorate,
qism
, and
shiyakhat
for urban sectors, and governorate,
markaz
, and
qarya
(village) for rural regions. The four large cities of Cairo, Alexandria, Port
Said, and Suez are counted as individual governorates. The smallest unit of
these urban governorates (as well as urban centers of other governorates) is
the
shiyakhat
;
qarya
is the smallest unit for rural parts.
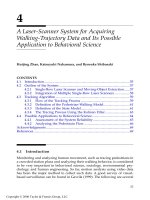
Taking the concern of this chapter into consideration, two areas on the
edge of Greater Cairo were selected for case studies, based on the criteria of
being low-income, residential areas housing rural migrants. On the northern
edge is
shiyakhat
Bigam in
qism
Shobra El-Kheima, and on the southwestern
edge lies
shiyakhat
Zinin in
qism
Bulaq El-Dakrur (Figure 14.1).
Although the smallest administrative unit, a
shiyakhat
covers quite a large
area: Bigam is 7,154,459 m
2
and has a population of 336,957 (1996), while
Zinin covers an area of 1,140,279 m
2
and has a population of 106,957 (1996).
Since it is impossible to cover the whole of a
shiyakhat
, the survey areas
were chosen at block level, on the edge of the administrative border. The
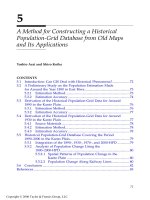
survey blocks in Bigam lie on the border with
qarya
Manta (
markaz
Kalyoub),
and are located near the industrial zone of Shobra El-Kheima (Figure 14.2).
The survey blocks in Zinin lie on the border with
shiyakhat
Bulaq El-Dakrur,
2713_C014.fm Page 193 Monday, September 26, 2005 7:39 AM
Copyright © 2006 Taylor & Francis Group, LLC
194
GIS-based Studies in the Humanities and Social Sciences
close to the commercial/residential districts of El-Dokki and El-Giza. As
shown in the figure, the areas are adjacent to vacant land, which indicates
the recent transformation of agricultural fields to developed urban residen-
tial areas. Indeed, the two areas are typical of those on the edge of Greater
Cairo, which developed rapidly from the late 1970s.
14.2.3 Data Sampling
The original microdata used in this chapter were collected during the house-
hold survey undertaken by the Graduate School of Economics, Hitotsubashi
University, in collaboration with CAPMAS during the years 2002 and 2003
(Kato, 2004).
FIGURE 14.1
Location of the survey areas in the map and percentage of buildings under construction by
shiyakhat
(Greater Cairo).
Survey areas
Border of Greater Cairo
Nile river
below 2.0%
2.0 - 5.5%
5.6 - 13.7%
above 13.7%
N
S
EW
0 2.5 5 10
Kilometers
2713_C014.fm Page 194 Monday, September 26, 2005 7:39 AM
Copyright © 2006 Taylor & Francis Group, LLC
Migration, Regional Diversity, and Residential Development
195
The problem inherent in a survey of migrants is the sampling. Since there
is no information available on how many migrants are in Greater Cairo or
where they live, it is impossible to establish a sample group that represents
the entirety of rural migrants living in the city. For this reason, the survey
was conducted as a case study in selected geographical areas.
The survey collected information from two household categories: those
whose household heads had moved directly from the rural areas to Greater
Cairo, and those with heads of households born in Greater Cairo. Since most
of the household heads living in the survey areas are believed to have been
born in Greater Cairo, the samples of those born in that city can be considered
as representing the majority of household heads in the survey areas. The
data of those born in Cairo were used in part to clarify the characteristics of
the migrants in the survey blocks.
FIGURE 14.2
Location of the two survey areas (Bigam).
Survey building
Meters
4002001000
Industrial building
Utility building
Service building
Religious building
Shiyakhat border line
Nile river
N
E
S
W
2713_C014.fm Page 195 Monday, September 26, 2005 7:39 AM
Copyright © 2006 Taylor & Francis Group, LLC
196
GIS-based Studies in the Humanities and Social Sciences
Before the household survey, a preparatory sampling survey was held
to collect information from the apartment-building owners on (1) house-
hold heads who came directly from rural areas to Greater Cairo, and (2)
the location of each household’s residence (street, building, and floor). The
survey started from a block on the administrative border of the two
shiy-
akhat
, selected randomly, and the survey moved on to the neighboring
blocks one after the other from any direction until the intended number
of samples in each of the two survey areas was met. Each block was
surveyed starting from one of its corners, and the block was kept on the
right-hand side of the surveyors as they moved from one apartment to the
next.
14.3 Migration and Regional Categorization
By far the largest number of migrants to Cairo emanates from the governor-
ates of Menoufia and Suhag, in Lower and Upper Egypt, respectively, but
the nature of their migration patterns is quite different. The following
detailed analysis of the regional characteristics at the village level reveals
the reasons for the difference.
The geographical data determined that migration characteristics were of
three types:
1. Where the migrants come from.
2. The determinants of out-migration to Greater Cairo.
3. Regional categorization with a focus on income and employment
structures within a region.
Three sources of information available were the information on locations
of the migrants’ home villages from the household-survey data, the data
TABLE 14.1
Samples
Bigam Zinin Total
% number % number % number
Households in the
Sampling Survey
Rural Migrants 32.5 635 23.4 627 27.2 1262
Other 67.5 1321 76.6 2055 72.8 3376
Total 100.0 1956 100.0 2682 100.0 4638
Samples Surveyed Rural Migrants 400 800
Born in Greater
Cairo
200 400
Total 600 1200
2713_C014.fm Page 196 Monday, September 26, 2005 7:39 AM
Copyright © 2006 Taylor & Francis Group, LLC
Migration, Regional Diversity, and Residential Development
197
from the population census, and geographical data from the digital map
of Egypt.
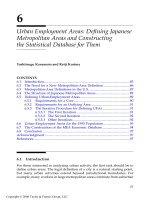
14.3.1 Migrants’ Villages of Origin
The maps of the migrants’ home villages indicate the linkage of certain
rural areas with the survey areas (Figures 14.3 and 14.4). In Upper Egypt,
the governorate of Suhag sent out relatively more migrants to Zinin,
whereas in Lower Egypt, the governorate of Menoufia provided more
migrants for Bigam.
The maps also indicate the concentration of migrants’ originating areas
not only at the governorate level but also at the
markaz
level. The migrants’
home villages in Menoufia are concentrated in the south, while those in
Suhag are concentrated in the north.
FIGURE 14.3
Number of migrants by village of origin (Lower Egypt).
Border of Greater Cairo
1 - 3 migrants
4 or more migrants
Governorate names
1. Alexandria
2. Behara
3. Kafr El-Sheikh
4. Dakahlia
5. Gharbia
6. Menoufia
7. Sharkia
8. Kalyoubia
9. Cairo
10. Giza
11. Fayoum
Mediterranean Sea
11
01530 60
Kilometers
N
S
EW
2713_C014.fm Page 197 Monday, September 26, 2005 7:39 AM
Copyright © 2006 Taylor & Francis Group, LLC
198
GIS-based Studies in the Humanities and Social Sciences
14.3.2 Characteristics of the Regions of Origin
To understand the characteristics of the migrant source areas, three levels of
analysis were conducted, based on the hypothesis that the determinants of
out-migration differ by region. This hypothesis is drawn from the mapping
by village of the major indicators, such as population density, income level,
age, education level, unemployment, and the employment situation. The
mapping procedure enabled the development of a hypothesis that the
income level and job opportunity at home are the important factors.
The first analysis conducted was the logit estimation of determinants to
show the factors that determine out-migration (Table 14.2).
The probability of out-migration is described by a dummy variable either
having (
=
1) or not having a migrant(s) (
=
2) in a
markaz
or
qarya
. The
estimation was done on
markaz
level for the analysis for the whole of Egypt,
FIGURE 14.4
Number of migrants by village of origin (Upper Egypt).
1 - 3 migrants
4 or more migrants
Governorate names
1. Beni Suef
2. Menia
4. Asyout
5. Qena
6. Red Sea
2
1
0
15
30 60
N
S
EW
Kilometers
3
4
5
6
2713_C014.fm Page 198 Monday, September 26, 2005 7:39 AM
Copyright © 2006 Taylor & Francis Group, LLC
Migration, Regional Diversity, and Residential Development
199
and on
qarya
level for the analysis by region, due to the nature of samples
and data.
Per capita, Gross Domestic Production (GDP)
(LE/year, 2000/2001) was
used as the indicator of income level. Two sets of variables were employed
with regard to employment opportunities. One was the proportion of
workers in the agricultural sector taken together with the population
density to estimate the employment opportunity in the agricultural sector.
The other was the unemployment rate compared with the proportion of
workers in the private sector to estimate the employment opportunity in
the nonagricultural sector (agricultural employment in the private sector
is controlled by the proportion of workers in the agricultural sector). It is
assumed that the greater the proportion of workers in the private sector,
the larger will the nonagricultural employment opportunity become.
The second analysis was the estimation of income levels (Figures 14.5 and
14.6), and the third was the cluster analysis of the employment structure in
rural Egypt.
Major indicators of employment contained in the population census
(1996) were used to clarify the regional diversity of employment structures
TABLE 14.2
Determinants of Out-Migration to Greater Cairo (logit estimation)
Markaz Level
Whole Egypt
coefficient z-statistics
Village Level
Lower Egypt
coefficient z-statistics
Upper Egypt
coefficient z-statistics
Distance to Cairo -0.002 -1.48 -0.025 -7.36
***
0.002 2.98
***
Population density 0.326 2.73
***
————
GDP per capita -0.001 -4.05
***
————
Unemployment
rate
0.049 2.39
**
0.012 0.66 0.028 1.42
Proportion of
workers in
0.143 2.15
**
0.018 2.12
**
-0.005 -0.66
Proportion of
workers in private
sector
-0.056 -1.69
*
-0.035 -3.00
***
0.009 0.81
Unemployment
rate in Markaz
town
— — -0.046 -1.46 0.084 2.53
***
Constant 5.710 2.01
**
1.661 2.26
***
-4.137 -4.79
***
Pseudo R-squared 0.34 0.105 0.039
(pr>chi-squared (0.000) (0.000) (0.000)
n 151 1830 1261
Notes
: *** indicates statistical significance at 1% level, ** at the 5% level, * at the 10% level.
Urban
markaz
(
markaz
composed exclusively of
shiyakhat
and
qism
) are excluded from the
analysis, since we treat here the rural migrations.
The distance is measured between the markaz town (or in case of its absence, central point
in
markaz
) to Cairo center (Taharir square).
Source
: From population census 1996, household survey data.
2713_C014.fm Page 199 Monday, September 26, 2005 7:39 AM
Copyright © 2006 Taylor & Francis Group, LLC
200
GIS-based Studies in the Humanities and Social Sciences
in Egypt. In terms of this, the villages of Egypt are categorized into fol-
lowing four groups.
Group 1: Characterized by the predominance of the government sector
and high unemployment
Group 2: Distinguished by private sector, nonagricultural activities
Group 3: Noted by the size of the agricultural sector
Group 4: Determined by the size of the agricultural sector, but predom-
inantly composed of the self-employed (Table 14.3)
The villages in Lower Egypt are classified into two types: the areas within
Menoufia that belong to Group 1, and the outer zone areas belonging to
Group 4. The migrants’ sourcing villages are concentrated in the zone com-
posed of Group 1 (Figure 14.7). On the other hand, villages in Upper Egypt
are divided into two zones: one to the north of Menia belonging to Group
4, and another to the south of Menia, notably of governorates, such as Suhag,
and the southern parts of Asyout and Qena. The latter zone has villages with
a more diversified employment structure belonging to Groups 1 and 2. It is
FIGURE 14.5
Income level of
markaz
sending out migrants (Lower Egypt).
Mediterranean Sea
Village with migrant
Western desert
012.525 50
N
S
EW
Kilometers
Eastern desert
below 4000 LE
4000 - 5000 LE
5000 - 6000 LE
6000 - 7000 LE
above 7000 LE
2713_C014.fm Page 200 Monday, September 26, 2005 7:39 AM
Copyright © 2006 Taylor & Francis Group, LLC
Migration, Regional Diversity, and Residential Development
201
FIGURE 14.6
Income level of
markaz
sending out migrants (Upper Egypt).
TABLE 14.3
Summary Statistics of Cluster Groups (Wards Method)
Group 1 Group 2 Group 3 Group 4
Number of clusters 2074 517 1477 404
Unemployment rate in markaz town (%) 10.9 9.2 11.1 10.4
Unemployment rate in village (%) 11.7 6.0 7.7 5.1
Proportion of workers in private sector (%) 65.6 76.4 83.7 88.8
Proportion of workers in public sector (%) 3.7 6.0 1.2 0.7
Proportion of workers in government sector (%) 29.9 16.4 14.1 9.2
Proportion of workers in agriculture (%) 41.1 33.8 69.0 72.1
Proportion of workers in manufacturing (%) 10.6 15.6 4.9 3.3
Proportion of workers in commerce (%) 4.9 8.0 3.1 3.5
Proportion of workers in public administration &
defense (%)
10.7 5.6 5.6 3.5
Proportion of workers in education (%) 11.4 5.6 5.4 3.9
Proportion of workers in health & social works (%) 2.2 1.2 0.9 0.6
Proportion of workers in construction (%) 5.4 16.3 2.8 3.2
Proportion of self-employed (%) 22.1 21.4 20.8 50.8
Proportion of waged (%) 58.5 64.9 51.9 33.3
Source
: population census 1996.
Western desert
Eastern desert
Village with migrant
below 4000 LE
4000 - 5000 LE
5000 - 6000 LE
6000 - 7000 LE
above 7000 LE
N
S
EW
0 12.5 25 50
Kilometers
2713_C014.fm Page 201 Monday, September 26, 2005 7:39 AM
Copyright © 2006 Taylor & Francis Group, LLC
202
GIS-based Studies in the Humanities and Social Sciences
these governorates that send out most of the migrants in Upper Egypt
(Figure 14.8).
These analyses are done on a
qarya
and
markaz
level, and are linked with
the geographical information through mapping. The digital map also served
to determine the distance factor in the out-migration analysis.
The results can be summarized as follows: The migrants’ source areas have
the common traits of a low-income level and a low employment opportunity,
but with some regional differences. In Lower Egypt, migrants come from
villages located in the proximity of Greater Cairo that offer fewer job oppor-
tunities in the nonagricultural private sector. In Upper Egypt, the migrants
come from villages located far from Greater Cairo, regardless of the employ-
ment structure. They tend to leave their villages when the job opportunity
in the nearby towns is small, whereas the migrants of Lower Egypt leave
their villages regardless of the job opportunity in the nearby towns. This
may be due to the distance factor, and the extremely low level of income,
and may possibly be related to the employment opportunity being limited
to construction and other service sectors.
FIGURE 14.7
Migrants and village categories (Lower Egypt).
Village with migrant
Group 1
Group 2
Group 3
Group 4
Western desert
Mediterranean Sea
Eastern desert
012.525 50
Kilometers
N
S
EW
2713_C014.fm Page 202 Monday, September 26, 2005 7:39 AM
Copyright © 2006 Taylor & Francis Group, LLC
Migration, Regional Diversity, and Residential Development
203
14.4 Migration and Residential Development
14.4.1 Constructing the Building Map
Bigam and Zinin, where the two survey areas are located, are
shiyakhats
with
a low income level that also absorb people from outside and are developing,
as shown in Figure 14.1 — buildings under construction. The two survey
areas are typical developing areas on the edge of Greater Cairo.
The next concern in this chapter is to examine the ways the two survey
areas have developed and the relationship between the settlement patterns
of rural migrants and the residential development of the two areas. The first
step in this concern was to make detailed residential maps of the survey
areas. The CAPMAS GIS map covering blocks does not contain sufficient
information to study those developing edges of Greater Cairo, such as the
survey areas.
The map was constructed in the following five steps:
1. Measurement of the dimensions of each building
FIGURE 14.8
Migrants and village categories (Upper Egypt).
Village with migrant
Group 1
Group 2
Group 3
Group 4
Western desert
Eastern desert
012.525 50
Kilometers
N
S
EW
2713_C014.fm Page 203 Monday, September 26, 2005 7:39 AM
Copyright © 2006 Taylor & Francis Group, LLC
204
GIS-based Studies in the Humanities and Social Sciences
2. Digitizing and coding each building to form new polygon shape
files, and overlaying these on the block map of CAPMAS
3. Attributing the building data to each polygon representing a build-
ing
4. Digitizing and coding each household to form a new dot shape file,
and overlaying these on building polygons
5. Attributing the household data to each dot representing the house-
hold
14.4.2 General Description of the Survey Areas
The detailed geographic information collected from the survey on 1) block
division, 2) building heights, and 3) building occupiers can clarify the infor-
mal development of the survey blocks. The three-dimensional shape of
blocks varies in size. In Bigam, one zone of 19 blocks is divided into 290
buildings, compared to another zone of only six blocks but with 405 build-
ings. Zinin shows a similar contrast, with 496 buildings in the nine blocks
of one zone, yet with 18 blocks containing only 384 buildings in another
zone (Figure 14.9, and photograph in Figure 14.10). This is because of the
manner of block development, which starts as a free-standing building in
open land and then develops haphazardly into attached houses or scattered
buildings.
Building heights vary, destroying the uniform relationship between the
very narrow streets of only 3 meters in width and buildings that vary from
eight floors (25 m tall) to low buildings of one to two floors, and the façades
remain unfinished. Furthermore, the infrastructure has relied on the personal
efforts of occupiers digging wells into the water table and making sewage
trenches. There are no playgrounds or any public space for recreation. The
buildings of this informal settlement continue to develop without the com-
pulsory licensing required by the government.
14.4.3 Settlement Patterns and Residential Development
As GIS methodology allowed us to achieve a linkage between the microdata
collected from the household survey and the digital maps, the settlement
patterns of rural migrants and the residential development of the survey
areas can be observed in relation to each other.
The examination of residential development is crucial to the study of
settlement patterns, since the choice of a residence may also be determined
by its availability. The settlement patterns will thus be considered in terms
of the occupiers’ region of origin and other attributes using the information
on the residential location at the building/apartment level.
According to the interviews, it was from the late 1970s or early 1980s that
large numbers of people flowed into the survey blocks. Interviewees (NGO
2713_C014.fm Page 204 Monday, September 26, 2005 7:39 AM
Copyright © 2006 Taylor & Francis Group, LLC
Migration, Regional Diversity, and Residential Development
205
FIGURE 14.9 (a and b)
Survey blocks (Bigam).
2713_C014.fm Page 205 Monday, September 26, 2005 7:39 AM
Copyright © 2006 Taylor & Francis Group, LLC
206
GIS-based Studies in the Humanities and Social Sciences
FIGURE 14.10 (a and b)
(See color insert following page 176.)
Typical buildings in the survey block (left: Bigam/right:
zinim).
2713_C014.fm Page 206 Monday, September 26, 2005 7:39 AM
Copyright © 2006 Taylor & Francis Group, LLC
Migration, Regional Diversity, and Residential Development
207
directors, long-standing residents) unanimously point to two factors for this:
the international migration to oil producing countries, and the open door
policy (
Infitah
).
In reality, most of the migrants and those born in Greater Cairo moved
into their residences in the survey blocks after the 1980s. This increase would
be related to the residential development of the survey blocks. The propor-
tion of occupiers renting the residences increased around the 1970s or 1980s,
which implies that many apartments were rented out.
The rental apartments appear to cluster in certain buildings (Figure 14.11a)
and seem to be those where the current residents moved to recently. It should
be noted that this phenomenon is not due only to the residential develop-
ment of the survey blocks, nor is it because the apartments became available
in the most recent decades. Even among the migrants who acquired or rented
their residence after the year 1980, earlier migrants are more likely to own
the residence, whereas recent migrants are more likely to rent the residence
(Figure 14.12).
The difference in behavior in the acquisition of the residence may be related
to the difference of migrants’ trajectories after arriving in Greater Cairo from
their home villages. There is a considerable time lag between the year of
arrival in Greater Cairo from the home village and the estimated year of
settlement into the residence. The time lag is greater for those migrants who
arrived in Greater Cairo in the early period, some of whom moved into
residence in Bigam and Zinin after accumulating money to buy their apart-
ment.
Figure 14.11b indicates the settlement patterns of migrants by their region
of origin. It seems that migrants prefer to settle into the building or a neigh-
boring building, where migrants from the same region of origin live. In
particular, migrants from Menoufia seem to have this tendency.
14.5 Conclusions
Previous studies of migration, as well as studies of income and the structures
have treated Egyptian rural society as a homogeneous entity, or at most have
divided the country into the two regions of Lower and Upper Egypt, both
in the past and at present. Contrary to this image, an analysis that combines
statistical data on migration and regional categorization with GIS maps
suggests a different outlook.
As the regional categorization by employment structure at village level
suggests, the job-opportunity situation in rural areas seems to be diverse in
size and nature. This diversity, as well as the level of income, is one of the
determinant factors that affect the rural–urban migration linkage in Egypt.
The phenomenon of rural migration to Greater Cairo is linked not only to
the urban labor market but also to the local, rural-area labor market.
2713_C014.fm Page 207 Monday, September 26, 2005 7:39 AM
Copyright © 2006 Taylor & Francis Group, LLC
208
GIS-based Studies in the Humanities and Social Sciences
FIGURE 14.11 (a and b)
Ownership of residence (a) and region of origin (b) (Bigam).
Owner
Rent
Other
Owner
Rent
Other
Migrants
Born in Greater Cairo
N
E
S
W
02550 100
Meters
Menoufie
Suheg
Other governorates
2713_C014.fm Page 208 Monday, September 26, 2005 7:39 AM
Copyright © 2006 Taylor & Francis Group, LLC
Migration, Regional Diversity, and Residential Development
209
This diversity of job opportunity may explain, in part, the impossibility of
the Cairo labor market to offer sufficient jobs under the transitional economy,
on one hand (Radwan, 2000; El-Laithy, 2003), and the possible formation and
development of new labor markets in local provinces, on the other. Thus, it
is concluded that in order to understand the rural–urban linkage in Egypt,
more detailed study is needed to clarify the diverse characteristics of the
local, rural-area labor market, as well as that in Cairo.
It is apparent that GIS is an efficient tool for the clarification of the migra-
tion from rural areas and the informal development of suburban areas in
Greater Cairo. In parallel with the building map, the GIS method can be
further adapted to study the urban characteristics of Bigam and Zinin and
to visualize the developmental processes in the survey areas.
The following two issues, especially, are expected to be important in the
study of the survey areas. The first is the urban structure that considers how
the network of streets and open spaces is connected, where the streets are
categorized according to their widths. The second is the building style,
noting the method of construction, time of building development, number
of floors, façade materials, and the provision of infrastructure.
References
Abu-Lughod, J., “Migrant Adjustment to City Life: the Egyptian Case”,
American
Journal of Sociology
, vol.67, n.1, 1961.
FIGURE 14.12
Settlement period of migrants to the actual residence.
80
70
60
50
40
30
20
10
0
before 1960
1960/64
1965/69
1970/74
1975/79
1980/84
1985/89
1990/94
1995/2003
period of year
number of
households
migrant(rent) Bigam
migrant(rent) Zinin
migrant(own) Bigam
migrant(own) Zinin
2713_C014.fm Page 209 Monday, September 26, 2005 7:39 AM
Copyright © 2006 Taylor & Francis Group, LLC
210
GIS-based Studies in the Humanities and Social Sciences
Assad, R., Ed.,
The Egyptian Labor Market in an Era of Reform
, Cairo: The American
University in Cairo Press, 2002.
CEDEJ, Cédérom Interactif, "Un siècle de recensements en Egypte (1882-1996)", http:/
/www.cedej.org.eg, 2004.
Datt, G. et al., “A Profile of Poverty in Egypt: 1997”,
FCND Discussion Paper
, n.49,
Washington D.C.: IFPRI, 1998.
Deboulet, A., "Etat, squatters et maîtrise de l'espace au Caire",
Egypte: Monde Arabe
,
no.1, 1990.
El Kadi, G.
L'urbanisation spontanée au Caire
, Fascicule de Recherches, no.18, Tours,
1987.
El-Laithy, H., "Poverty and Economic Growth in Egypt, 1995-2000",
Policy Research
Working Paper
, 3068, Washington D.C.: The World Bank, 2003.
Esfahani, H.S., "Aggregate Trends in Four Main Agricultural Regions in Egypt, 1964-
1979",
International Journal of Middle East Studies
, vol.20, no.2, 1988.
Government of Egypt & The World Bank,
Arab Republic of Egypt: Poverty Reduction
in Egypt, Diagnosis and Strategy
, 2 vol., Washington D.C.: World Bank, Report
n.24234-EGT, 2002.
Ireton, F., "The Evolution of Agrarian Structures in Egypt: Regional Patterns of
Change in Farm Size", Hopkins, N. & Westergaard, K, Eds.,
Directions of Change
in Rural Egypt, The American University in Cairo Press, 1998.
Kato, H., Iwasaki, E., and El-Shazly, A. “Internal Migration Patterns to Greater
CairoÅ|Linking Three Kinds of Data: Census, Household Survey, and GIS “,
Mediterranean World, 17, the Mediterranean Studies Group, Hitotsubashi Uni-
versity, Tokyo, 2004.
Nagi, S. Z., Poverty in Egypt: Human Needs and Institutional Capacities, Lexington:
Lexington Books, 2001.
Radwan, S., "Employment and Unemployment in Egypt", ECES, Working Paper, n.70,
Cairo, 2000.
2713_C014.fm Page 210 Monday, September 26, 2005 7:39 AM
Copyright © 2006 Taylor & Francis Group, LLC