Regional Scale Ecological Risk Assessment - Chapter 4 ppsx
Bạn đang xem bản rút gọn của tài liệu. Xem và tải ngay bản đầy đủ của tài liệu tại đây (734.24 KB, 38 trang )
53
C
HAPTER
4
Application of the Relative Risk Model to the
Fjord of Port Valdez, Alaska
Janice K. Wiegers and Wayne G. Landis
CONTENTS
Introduction 54
Project Background 54
Limitations of Traditional Risk Assessments at the Regional Scale 56
Relative Risk Model Design 57
Methods 58
Problem Formulation 58
Background Investigation and Stakeholder Involvement 58
Assessment and Measurement Endpoints 59
Results of the Problem Formulation: Conceptual Model 60
Analysis 60
Relative Risk Model 60
Uncertainty Analysis 66
Sensitivity Analysis 71
Confirmatory Analysis 71
Results 72
Relative Risk in Port Valdez 72
Uncertainty 76
Sensitivity 78
Confirmation of Risk Rankings in Port Valdez 80
Comparison to Benchmark Values 80
Estimating the Risk of Toxicity Due to PAH 82
Discussion 83
Implications of the Relative Risk Model and Confirmatory Analyses 84
Importance of Stakeholder Participation and Scientific Collaboration 85
L1655_C04.fm Page 53 Wednesday, September 22, 2004 2:45 PM
© 2005 by CRC Press LLC
54 REGIONAL SCALE ECOLOGICAL RISK ASSESSMENT
Relative Risk Model as a Tool for Risk Assessors and
Resource Managers 86
Limitations of Relative Risk Models 87
Conclusions 88
References 88
INTRODUCTION
While the field of ecological risk assessment (EcoRA) is moving toward more
systems-based, as well as more realistic, assessments, there is yet little guidance on
how to integrate the complex relationships that can exist within environments
affected by natural and anthropogenic stresses. Researchers are beginning to call for
and to develop qualitative modeling procedures that will help to integrate these
components (Harris et al. 1994; Dambacher, Li, and Rossignol 2003). Qualitative
models are capable of larger-scale perspectives through which the more specific and
quantitative models can be understood. Qualitative models can be used as a framework
in which to sort out complex sets of relationships, while the more detailed and quanti-
tative studies usually assess only a couple of variables at a time. In 1997, we developed
a relative risk model (RRM) to provide such a framework for Port Valdez, Alaska
(Wiegers et al. 1998).
This project was instigated by local concern that activities associated with the
Trans Alaska Pipeline were negatively affecting the ecology of the Port. The Regional
Citizen’s Advisory Committee (RCAC), which provides citizen oversight for pipeline
activities, funded the project. To address the varied concerns of the public and the
RCAC, we found it necessary to modify the standard risk assessment approach.
Modifications resulted in the first application of the RRM, and attained a regional
perspective from which we were able to evaluate the risk associated with pipeline
activities within the greater context of all activities within the Port. The regional
approach requires study of ecological systems at a larger scale as well as consider-
ation of various physical, chemical, and biological stressors that could affect the
environment, but are usually not considered within the same assessment. To achieve
a more balanced evaluation of the threat to marine populations and communities,
we based our assessment on prototypical habitats and anthropogenic sources of
stressors. This model considers not only the direct stressors and the organisms
affected by these stressors, but also the sources producing these stressors and the
habitats on which the organisms depend. A detailed analysis of the risk assessment
for Port Valdez is available in Wiegers et al. (1997).
PROJECT BACKGROUND
The primary activity driving public concern for the Port waters was the discharge
of up to 21 million gallons of treated ballast water. Ballast water is stored in the
cargo holds of oil tankers and transported to the marine terminus of the pipeline
located on the south shore of the Port. The terminus is known as the Valdez Marine
L1655_C04.fm Page 54 Wednesday, September 22, 2004 2:45 PM
© 2005 by CRC Press LLC
APPLICATION OF THE RELATIVE RISK MODEL TO THE FJORD OF PORT VALDEZ 55
Terminal. The ballast water, which is contaminated with crude oil residuals from
the ships’ previous cargo, is discharged to the ballast water treatment plant (BWTP)
and treated through processes of settling, dissolved air flotation, and biological
degradation. The effluent is then released into the Port under a National Pollution
Discharge Elimination System (NPDES) permit. Low levels of hydrocarbons are
known to be present in the effluent.
Despite efforts by the facility to meet regulatory standards and stay in compli-
ance, the large volumes of treated water discharged into the Port create uncertainty
in the minds of stakeholders regarding the degree to which hydrocarbons are accu-
mulating in and impacting the marine environment. At the beginning of this project,
an EcoRA was planned to evaluate the effect of the effluent chemistry on the Port
ecology. The EcoRA was to be based on available data, including effluent testing
results, and Port-wide environmental monitoring analyses. Early in the process,
several facts emerged suggesting that traditional EcoRA would not provide the best
understanding of the potential harm to this environment:
• The influent composition was controlled through best management practices in
place for the treatment plant and tanker operations. For instance, only cleaning
agents approved by the U.S. Environmental Protection Agency (EPA) could be
used on tankers — limiting the potential for chlorinated solvents to be present in
the effluent. In addition, the RCAC was monitoring ballast water in tanker holds
for the presence of hazardous materials. Due to these controls, the general com-
position of the effluent was fairly well defined.
•For several years, the effluent had generally met the NPDES requirements for
hydrocarbons, including benzene, toluene, ethylbenzene, xylenes (BTEX), naph-
thalene, and other polycyclic aromatic hydrocarbons (PAHs). Prior exceedences
of the permit requirements generally occurred with the BTEX components during
upset conditions, and changes to the treatment process had reduced these occurrences.
• Accumulated effluent toxicity data from a number of acute and chronic tests using
a variety of test species had demonstrated only low to moderate toxicity. The
presence of a permitted mixing zone would further reduce toxicity outside of the
regulated area.
• Long-term environmental monitoring results collected throughout the Port indi-
cated that impacts to sediment chemistry and benthic communities were limited
to the area near the effluent discharge point. In addition, monitoring of the intertidal
organisms during the early years of the terminal operations when effluent con-
centrations were higher had not identified any impacts within these communities.
With these observations, we did not expect available data associated with the
treated ballast water effluent to demonstrate an unacceptable chemical risk to eco-
logical endpoints in the Port. However, other diverse sources may compound the
potential stress caused to populations and communities by low-level, chronic hydro-
carbon exposure associated with the BWTP, and the combined effects may be
difficult to predict or understand (Lowell et al. 2000). Although this accumulation
of stress through exposure to a complex set of stressors resulting from a variety of
sources is the reality for most populations and communities, the traditional approach
to EcoRA is only able to account for a limited fraction of this stress. We decided
to take a nontraditional approach and to consider the gamut of environmental hazards
L1655_C04.fm Page 55 Wednesday, September 22, 2004 2:45 PM
© 2005 by CRC Press LLC
56 REGIONAL SCALE ECOLOGICAL RISK ASSESSMENT
possible in the Port. This decision added a regional perspective to the project
resulting in a multiscaled assessment, including:
•A local scale that focused primarily on the BWTP effluent as a source and
incorporated scientific data gathered for this purpose. The assessment completed
at this scale followed the traditional EcoRA approach.
•A regional scale that focused on broad information available regarding the multiple
sources and habitats in the Port and its surrounding watershed. Completing the
assessment at this scale required modification to the EcoRA process as discussed
in the following section.
LIMITATIONS OF TRADITIONAL RISK ASSESSMENTS
AT THE REGIONAL SCALE
Typically, EcoRAs evaluate chemical concentration data with respect to single
species toxicity data. In 1992, the EPA’s EcoRA framework broadened this scope
by discussing physical and biological stressors, as well as chemical stressors, and
the importance of assessing multiple endpoints. More recently, guidance has empha-
sized larger scale or regional approaches, as evidenced by the merging of EcoRA
with Watershed Assessments (Serveiss et al. 2000), and included cascading effects
and cumulative impacts as necessary considerations when assessing whole ecosys-
tems (USEPA 1997; 1998; 2003). Regardless of this trend, assessment goals and
measurement endpoints are still mostly dependent on the dose–response relationship,
and it is left to the risk assessor to try to integrate this simple relationship into the
complex set of relationships that can exist within ecosystems.
To evaluate the range of information available for Port Valdez, we needed a
larger, more inclusive data structure than was described in the 1992 EPA guidance
available at the time. Once we had adjusted the scope of our information-gathering
efforts, we then needed to modify the EcoRA process to address the following
characteristics of the data set:
1.
Diverse Knowledge Base
— In order to broaden the information base and address
ongoing community concern, we needed a method that could use traditional and
anecdotal information, as well as scientific research.
2.
Systems Ecology
— The method needed to integrate information about stressors
with the many interrelated components of the Port Valdez ecology and explore
cumulative effects as a mechanism for potential decline in this system.
3.
Multiple Scales
— The method needed to integrate various exposure–effects
relationships from a smaller-scale to a larger-scale evaluation.
4.
Long-term Management
— The method needed to act as an information manage-
ment system that would assimilate new information and synthesize it with the old
information. The information also needed to be in a form that could be reduced
to easily understood conclusions about the state of the Port environment.
Modifications to the EcoRA approach resulted in the RRM. The model design
is discussed in the next section, and the application to Port Valdez is described in
the Methods and Results sections.
L1655_C04.fm Page 56 Wednesday, September 22, 2004 2:45 PM
© 2005 by CRC Press LLC
APPLICATION OF THE RELATIVE RISK MODEL TO THE FJORD OF PORT VALDEZ 57
RELATIVE RISK MODEL DESIGN
The RRM design allowed us to extend the traditional EcoRA framework to
provide a broad yet comprehensive screening assessment of impacts for all known
sources in Port Valdez. The model design included the following steps:
• Categorization of eight source and habitat types in the region, and identification
of potential ecological impacts expected from each source–habitat combination.
• Identification of three assessment endpoint categories based on public input,
treating both scientific and anecdotal information equally.
• Delineation of 11 subareas based on the occurrence of habitat types, location of
or transport potential from sources, and management concerns associated with
assessment endpoints. Although the Port was the focus of the assessment, the
subareas spanned the terrestrial, freshwater, and marine environment in recogni-
tion of the many interactions that occur between these areas.
• Conceptual site model development by defining the relationships of stressors and
receptors to assessment endpoints within this structure.
•Development of criteria to rank the importance of the source and habitat categories
between subareas. We based the ranking scheme on information that was readily
available, could be consistently judged between subareas, and corroborated our
understanding of likely risk factors from reviewing more detailed information
about the Port.
• Calculation of relative risk by combining ranks for each subarea, weighted by the
likelihood that the combination of a particular source and a particular habitat
would result in an ecological impact.
The first step toward designing the model was to rescale the risk assessment
components. Instead of focusing on specific stressors released into the environment
and the receptors living in and using that environment, rescaling allowed us to focus
on the sources releasing the stressors, and the habitats in which the receptors lived.
At this scale, information was much easier to obtain and we were able to make
assumptions about stressors when data were not available. For example, although
hydrocarbons were a stressor of concern in the Port, the only chemical data available
were associated with the BWTP and the city boat harbor. By rescaling the assess-
ment, we were able to include the municipal wastewater treatment plant and con-
taminated runoff as potential sources of hydrocarbons.
Just as sources and habitats are more relevant at the regional scale than stressors
and receptors, we also began to focus on the range of possible ecological impacts,
rather than on individual receptor responses. Predicting the significance of ecological
impacts is always the end goal of an EcoRA, but these predictions are made by
extrapolating between levels of biological organization, and there is often little
understanding of the implications of indirect effects (Preston 2002). At the regional
scale, we concentrated on the physical prerequisites (e.g., spatial overlap of stressors
and receptors, available transport pathways) for specific types of ecological impacts.
After identifying and categorizing the sources and habitats, we divided the study
area into subareas based on groupings of these components. The subarea designations
allowed us to use comparison (ranking) as a measuring technique. Ranking between
subareas was an important tool in the RRM, because it normalized disparate data
L1655_C04.fm Page 57 Wednesday, September 22, 2004 2:45 PM
© 2005 by CRC Press LLC
58 REGIONAL SCALE ECOLOGICAL RISK ASSESSMENT
types and provided a semiquantitative measure based on concepts and qualifiers. For
example, we ranked the subarea containing the BWTP higher than the subarea
containing the municipal wastewater treatment plant because of the “larger effluent.”
This simple construction was easy to replicate for all sources and habitats.
Once we had completed these comparisons between subareas, we integrated the
resulting information through a weighting process that screened out the less likely
exposure pathways or impacted endpoints. This step is analogous to the risk char-
acterization step of a traditional EcoRA where integration of information about
exposure and effects forms the risk determination.
The RRM was beneficial in Port Valdez because it operated on qualitative and
semiquantitative information and it provided a simultaneous analysis of the whole
system. However, the regional-scale assessment is a relative measure of risk and
does not specify the probability of an impact occurring. More detailed and quanti-
tative determinations of risk were completed at the local scale (within subareas) to
calibrate and confirm the regional model.
METHODS
The regional-scale assessment conformed to the three-phase approach of tradi-
tional risk assessments:
problem formulation, analysis,
and
risk characterization
.
During the problem formulation, we gathered information from Port Valdez research-
ers, resource users, and residents. One of the essential elements of the problem
formulation was a community meeting held in Valdez, Alaska to identify public
concerns, values, and knowledge about the surrounding environment. We grouped
the acquired information into categories relating to regional-scale risk components,
which we then processed into an estimate of risk during the analysis phase, and
interpreted during risk characterization to provide a comparative ecological risk
perspective within the Port basin. We intended the results to inform stakeholders,
not only of the chances of negative impacts associated with the oil industry, but also
of the relative impacts from other anthropogenic uses and natural occurrences within
the Port. This section describes the resources, decision points, and the means used
to complete each phase of the assessment.
Problem Formulation
Background Investigation and Stakeholder Involvement
We initiated the investigation by asking three questions:
1. What are the physical and biological characteristics of the Port, including natural
disturbances?
2. How do people interact with the environment?
3. What impacts are known to have occurred in the environment?
Baseline studies of the oceanographic and biological resources in Port Valdez
provided information about seasonal fluctuations, circulation patterns, habitat types,
L1655_C04.fm Page 58 Wednesday, September 22, 2004 2:45 PM
© 2005 by CRC Press LLC
APPLICATION OF THE RELATIVE RISK MODEL TO THE FJORD OF PORT VALDEZ 59
and plant and animal populations. We examined various types of environmental
discharge permits, determined if data regarding stressors were available, requested
data when pertinent, and examined the literature to determine the range of stressors
that could result from each source. The level of characterization varied for each
source. Regulated and monitored sources, such as the NPDES-permitted facilities,
were the most easily characterized, while characterization of other possible sources,
such as contaminated runoff, consisted of generalized knowledge. Prior research
efforts in the Port Valdez area and anecdotal information contributed to our under-
standing of the types of effects likely to occur in the Port.
We held three public meetings in the City of Valdez in October 1995 to aid in
the formulation of assessment endpoints relevant to the Port. Following a brief
introduction to the risk assessment process, the public was asked what concerned
them about the Port Valdez environment. Responses were sorted into two categories:
(1) stressors and sources of concern in the Port, and (2) populations or attributes of
the Port that people wanted to protect. We also scheduled interviews in the commu-
nity to supplement the public meetings and to ask specific questions that had arisen
during the information-gathering phase. Participants included the city planning
department, the Alaska Department of Environmental Conservation, and the U.S.
Coast Guard (USCG), as well as local industry managers.
Assessment and Measurement Endpoints
Our discussions with risk managers, community interviews, and input from the
public meetings resulted in selection of assessment endpoints. Fisheries, tourism,
and the community’s concern for the quality of its environment influenced the
emphasis of the assessment endpoints. Each endpoint was also susceptible to one
or more stressors possible in the Port Valdez environment. We defined the endpoint
goals as assessing risk to the following areas:
1. Water and sediment quality in Port Valdez
2. Finfish and shellfish populations used by sport or commercial fishermen
3. Wildlife populations such as fishes, birds, and mammals that use the Port on either
a year-round or seasonal basis
Assessment endpoints were carefully defined to reflect matters raised by resource
managers and research scientists, as well as concerns voiced by the public (Wiegers
et al. 1997). At times, these interests conflicted. For instance, a number of community
members expressed concern that oil industry activities were affecting shellfish, and
stated that they occasionally observed abnormal markings on crabs when harvesting
shellfish. Scientific opinion suggested that crab populations dropped in the 1970s
due to a growing sea otter population (Feder and Jewett 1988; Garshelis 1983).
Another suggestion was that the yearly release of several hundred million hatchery
fry increased feeding pressure on planktonic crab larvae. At this point in the project,
we noted differing opinions, but this information did not influence the inclusion or
exclusion of an endpoint. We also discussed possible measurement endpoints that
would aid in the evaluation of the assessment endpoints, an important consideration
during data review and hypothesis testing.
L1655_C04.fm Page 59 Wednesday, September 22, 2004 2:45 PM
© 2005 by CRC Press LLC
60 REGIONAL SCALE ECOLOGICAL RISK ASSESSMENT
Results of the Problem Formulation: Conceptual Model
Information gathered during the problem formulation phase provided the foun-
dation for constructing the conceptual model. Initially, we focused on describing the
standard components of a risk assessment: stressors, receptors, and the direct and
indirect effects that could result from the interaction of the first two components.
This information was regrouped into categories relevant to the regional-scale risk
assessment components of sources, habitats, and ecological impacts. Source and
habitat categories describe the anthropogenic and ecological components of the Port
divided the Port into 11 separate subareas. The locations and boundaries of each
Once the regional-scale categories were established, we explored exposure and
effect characteristics for each combination of components by developing working tables
for each subarea. The tables summarized information that would affect exposure, such
as temporal or spatial distribution of typical stressors and receptors, and that would
affect receptor responses, such as life stages and community interactions. Based on the
information organized in the tables, we were able to conceptualize generalized risk
scenarios for each subarea. This approach ensured that we were informed about and
had considered the interaction of individual stressors and receptors before making
professional judgments on the regional scale. The risk scenarios also provided a con-
ceptual structure from which to develop hypotheses for future quantitative assessments.
Analysis
The table-based structure of the conceptual model simulated general aspects of
the Port and provided a single framework within which to formulate risk scenarios.
The analysis phase of the assessment included two approaches: comparative analysis
of risks at a regional scale and quantitative analyses of site-specific risk using
traditional risk assessment techniques. We also addressed uncertainty and sensitivity
during the relative risk analysis.
Relative Risk Model
The RRM compared the 11 subareas of interest in order to determine where the
presence of multiple sources and sensitive habitats is more likely to affect assessment
endpoints. The model design for Port Valdez makes the following assumptions:
1. The greater the size or frequency of a source in a subarea, the greater the potential
for exposure to stressors.
2. The type and density of receptors present is related to the available habitat.
3. The sensitivity of receptors to stressors varies in different habitats; the severity of
effects between different subareas of the Port depends on relative exposures and
the characteristics of the receptors present.
components and filtering each possible combination to arrive at a reasoned and
L1655_C04.fm Page 60 Wednesday, September 22, 2004 2:45 PM
© 2005 by CRC Press LLC
(Table 4.1). Impact categories described the chosen assessment endpoints. We then
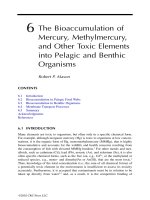
subarea are described in Table 4.1 and illustrated in Figure 4.1.
As described in Chapter 2, the resulting model is a system for ranking risk
APPLICATION OF THE RELATIVE RISK MODEL TO THE FJORD OF PORT VALDEZ 61
Table 4.1 Subareas, Sources, and Habitats Defined for the Port Valdez Ranking
Risk Assessment
Subareas (Risk Regions)
Shoup Bay
Shoup Bay, including the bay entrance, the entrance spit, and a portion of the shoreline to the
east of the bay
Mineral and Gold Creeks
Shoreline area and the shallow shelf of the Mineral Creek embayment, including Gold Creek
City of Valdez
The city and the shoreline and shallow shelf areas from just east of Mineral Creek to the eastern
end of the Small Boat Harbor
Duck Flats (or Mineral Island Flats) and Old Valdez
The Duck Flats, including the islands and shallow shelf south of the flats, and the shoreline
area including the Richardson Highway extending east to the Valdez Glacier Stream
Robe and Lowe Rivers
Shoreline, river deltas, and shallow subtidal areas of the Valdez Glacier Stream, Robe River
and Lowe River, including the Petro Star Refinery
Dayville Flats and Solomon Gulch
Shoreline along Dayville Road and shallow subtidal areas from the southern edge of the Lowe
River to just east of Allison Point, including the Solomon Gulch Hatchery
Valdez Marine Terminal
Shoreline and shallow subtidal areas from Allison Point to just west of Saw Island, including
the Valdez Marine Terminal
Sawmill to Seven-Mile Creeks
Shoreline and shallow subtidal areas from west of Saw Island to a point east of Anderson Bay,
including Sawmill Creek, Five-Mile Beach, and Seven-Mile Beach
Anderson Bay
Shoreline and shallow subtidal areas from just east of Anderson Bay to the west of Entrance
Island
Western Port
The western, flat-bottomed basin from the Valdez Narrows to a middle boundary between the
Mineral Creek embayment to the eastern edge of the Valdez Marine Terminal
Eastern Port
The eastern, upward-sloping basin from the middle boundary to the edge of the shallow offshore
area of the eastern shoreline
Sources
Treated Discharges
Effluents from point sources (released from a pipe) that are treated to reduce chemical and
physical contaminants before release
Contaminated Runoff
Runoff from land that has been contaminated through air pollution, groundwater contamination,
spills on land, pesticide and other chemical applications, or another process
Accidental Spills
Spills of oil, lubricants, solvents, antifreeze, fluids, or other chemicals on the water
Fish and Seafood Processing Wastes
Wastes composed of solid or settling organic matter, including seafood processing, sport fish
wastes, and food or fecal matter resulting from aquatic culturing
L1655_C04.fm Page 61 Wednesday, September 22, 2004 2:45 PM
© 2005 by CRC Press LLC
62 REGIONAL SCALE ECOLOGICAL RISK ASSESSMENT
repeatable estimate of relative risk. Application of this system to Port Valdez involved
the following.
Ranking
Sources and habitats in each subarea were ranked to indicate a relative probability
(low, medium, or high) that assessment endpoints could be significantly impacted.
Criteria were based on the size and frequency of the source and the amount and use
of available habitat. Uncertainty associated with each criterion was also described.
Table 4.1 Subareas, Sources, and Habitats Defined for the Port Valdez Ranking
Risk Assessment (continued)
Vessel Traffic
Small or large vessels that may cause injury through contact or propeller wash, disturbance
from noise or movement, release of fuels and other chemicals from normal operation, release
of sewage wastes, or release of ballast water
Construction and Development
Activities such as land clearing, building, and road and dock construction that directly alter
habitat, release debris or sediment, or change physical conditions such as water flow
Hatchery Fish
Salmon returning to the hatchery that stray into other spawning streams, and hatchery fry
migrating out of the port
Shoreline Activity
Recreational or residential activity resulting in disturbance or injury
Habitats
Saltmarsh
Shoreline areas characterized by marsh grasses and sedges
Mudflats
Shoreline areas with an extensive tidal flat consisting of mostly silt and clay sediments
Spits and Low-Profile Beaches
Flat shoreline areas or spits extending out from the shoreline that consist of broken rock, cobble
beaches, or coarse sediment and gravel
Rocky Shoreline
Sloped to steep shorelines consisting of large rocks, boulders, or seacliffs
Shallow Subtidal
Water column and benthic areas less than 50 m deep with either sediment or rocky bottoms
Deep Benthic
Underwater areas greater than 50 m deep consisting of mostly a sediment bottom
Open Water
Water column or pelagic zone in deep water areas where influences from land are lessened
Stream Mouths
Intertidal mud, sandy gravel, and gravel entrances to streams and rivers and upstream areas
influenced by tidal flows
L1655_C04.fm Page 62 Wednesday, September 22, 2004 2:45 PM
© 2005 by CRC Press LLC
The ranking criteria for each variable are presented in Table 4.2. The resultant
ranking values are provided in Table 4.3.
APPLICATION OF THE RELATIVE RISK MODEL TO THE FJORD OF PORT VALDEZ 63
Filter Design
Exposure and effect filters were designed to characterize the relationship between
risk components (sources, habitats, and impacts to assessment endpoints) and con-
sisted of a table of weighting factors for the component combinations of interest. A
single-exposure filter was designed for the source and habitat combinations in Port
Valdez. The design of the effect filter was similar, but a separate filter was made for
each assessment endpoint. The exposure filters and the effects filters are provided
Figure 4.1
Habitat types and subarea (risk region) delineations chosen for the analysis of
Nautical Miles
02
N
A. Shoup Bay
C. City of
Valdez
J. Western Port
H. Sawmill Creek to
Seven-Mile Creek
K. Eastern Port
G. Valdez Marine
Terminal
E. Lowe and
Robe Rivers
I. Anderson
Bay
B. Gold and
Mineral Creeks
F. Dayville Flats
and Solomon
Gulch
D. Duck Flats and
Old Valdez
Subareas (Risk Regions) for Port Valdez, AK
(a)
(b)
deep benthic and open water
tidal mudflat
Nautical Miles
02
N
spawning stream (ADF&G Stream No.)
(#)
(150)
(148)
(144)
(143)
(142)
(141)
(139)
(137)
(136)
(135)
(134)
(133)
(132)
(131)
(130)
(149)
(147)
(146)
(145)
shallow subtidal
sand and gravel spit
saltmarsh
rocky and gravelly shore
N
Habitat Distribution in Port Valdez
L1655_C04.fm Page 63 Wednesday, September 22, 2004 2:45 PM
© 2005 by CRC Press LLC
Port Valdez. Detailed descriptions are given in Table 4.1.
in Table 4.4.
64 REGIONAL SCALE ECOLOGICAL RISK ASSESSMENT
Table 4.2 Criteria for Ranking Sources and Habitats: Factors Leading to Uncertainty
Are Included
Source Criteria Uncertainty in the Criteria
Treated
discharges
6 — flow greater than 10 mgd Treatment effectiveness
4 — flow between 5 and 10 mgd Undetected sporadic discharge of
contaminants at high levels
2 — flow less than 5 mgd Continuous discharge of contaminants
below detection levels, especially for
contaminants that can accumulate in
the environment
0 — no flow
Contaminated
runoff
6 — large industrial, commercial, or
dense residential areas
Some sites have stormwater
containment and treatment (e.g.,
Valdez Marine Terminal)
4 — light industrial areas, landfills,
or subdivisions with septic tanks
Contamination in stormwater from
storm drains or sites without
treatment or monitoring (e.g., the city,
most industrial or commercial sites)
2 — sparse residential areas or
possible mining
Contaminated runoff from active and
inactive mines
0 — no known or suspected sources
of contamination
Accidental
spills
6 — loading or unloading facilities for
fuels or oil
Spills at sites that are highly monitored
(e.g., the Valdez Marine Terminal and
other fuel transfer docks) are more
likely to be reported and cleaned up
4 — other docks or commercial
boating activity
2 — recreational boating activity
0 — no sources of spills
Fish and
seafood
processing
wastes
6 — seasonal seafood processing
waste streams
Dispersal on the bottom depends on
water depth and current strengths
4 — seasonal use of net pens Some organic solids may contain other
wastes (e.g., cleaners, antibiotics)
2 — sporadic fish wastes
0 — no known or suspected sources
Vessel traffic 6 — year-round daily traffic present Commercial shipping, especially for
crude oil, is frequent, although long-
term trends may change
4 — year-round monthly traffic
present
Recreational, charter and tour
services, and fishing traffic are
seasonal and may be sporadic
2 — seasonal traffic
0 — little boat traffic expected
Construction
and
development
6 — large-scale development
expected
Construction activities are mostly
seasonal and short term, although
a specific project may last over
years
4 — frequent construction or small-
scale development expected
Areas where future development
projects are planned have high
uncertainty
2 — developed
0 — no current or expected
development
Hatchery fish 6 — near hatchery The number of hatchery fish that stray
into other streams is not known
L1655_C04.fm Page 64 Wednesday, September 22, 2004 2:45 PM
© 2005 by CRC Press LLC
APPLICATION OF THE RELATIVE RISK MODEL TO THE FJORD OF PORT VALDEZ 65
Source Criteria Uncertainty in the Criteria
4 — expected adult and fry migration
route
The criteria assume straying is more
likely on the southern shore near the
hatchery
2 — possible locations of adult and
fry
0 — no hatchery fish expected
Shoreline
activity
6 — daily activity, year round Exposure depends on type of activity,
proximity to receptors, and sensitivity
of the receptors
4 — recreational, road access Some receptors occur or are more
sensitive on a seasonal basis (e.g.,
migratory birds, spawning salmon)
2 — recreational, no road access
0 — little shoreline activity expected
Habitat Criteria Uncertainty in the Criteria
Mudflats 6 — extensive mudflats Population density and community
types vary depending on sediment
grain size, nutrient and organic
carbon levels, sedimentation, and
salinity
4 — moderate or extensive mudflats
with low population densities
2 — limited mudflat areas
0 — no mudflats
Saltmarsh 6 — extensive saltmarsh High productivity of saltmarshes and
infrequent occurrence of this habitat
type in Prince William Sound may
increase its regional importance
4 — moderate area of saltmarsh Disturbance would affect some
populations more than others (e.g.,
high-use habitat for migratory birds)
2 — limited saltmarsh areas
0 — no saltmarsh
Habitat Criteria Uncertainty in the Criteria
Spits and
low-profile
beaches
6 — spits, spit-like formations, or
extensive low-profile beaches
Generally low productivity may limit
the importance of this habitat type
4 — some low-profile beaches Importance of these areas may
depend on their proximity to other
habitats
2 — limited areas with low-profile
beaches
0 — no spits or low-profile beaches
Rocky
shoreline
6 — extensive rocky shoreline Population density and community
types vary depending on the
availability of nutrients and organic
carbon, sedimentation, salinity, and
wave action
4 — some rocky shoreline
2 — limited rocky shoreline
0 — no rocky shoreline areas
Table 4.2 Criteria for Ranking Sources and Habitats: Factors Leading to Uncertainty
Are Included (continued)
L1655_C04.fm Page 65 Wednesday, September 22, 2004 2:45 PM
© 2005 by CRC Press LLC
66 REGIONAL SCALE ECOLOGICAL RISK ASSESSMENT
Integrating Ranks and Filters
Ranks and weighting factors were combined through multiplication. The results
formed a matrix of risk scores related to the relative exposure or effects associated
with a source and habitat in each subarea. Summing by subarea results in the relative
estimate for each subarea.
Uncertainty Analysis
In this study, we addressed uncertainty (1) in the conceptual model, (2) in the
calculation of relative risk, and (3) in the accuracy of relative risk estimates in Port
Valdez. Uncertainty associated with the structure of the conceptual model was mostly
qualitative. The calculation of relative risk had a quantifiable level of uncertainty.
Shallow
subtidal
(< 50 m deep)
6 — extensive shallow subtidal shelf Limited or narrow areas of shallow
subtidal in the Port
4 — moderate shallow subtidal area This habitat group does not
differentiate between hard- and soft-
bottomed subtidal areas, which will
affect the biological activity in the
habitat
2 — narrow shallow subtidal area
0 — no shallow subtidal areas
Deep benthic
(> 50 m deep)
6 — extensive deep subtidal areas Population density and community
types are affected by the amount of
settling sediment and occasional
seismic slumping
4 — moderate deep subtidal areas Sediment grain size, which varies
slightly in the eastern and western
Port, also influences animal
assemblages
2 — limited deep subtidal areas
0 — no deep subtidal areas
Open water 6 — large areas with deep water
column
Flushing in the Port is tied to seasonal
events, variability in the tides and
currents, and stratification of the
water column
4 — moderate areas with deep water
column
Nutrient cycling in the Port is related
to stratification of the water column
and to yearly variation in
phytoplankton and zooplankton
communities
2 — small areas with deep water
column
0 — no deep water
Stream
mouths
6 — large river or creek systems with
many freshwater tributaries
Steep terrestrial slopes of Port Valdez
limit stream habitat areas
4 — streams with few tributaries,
moderate flows
Stream mouths are exposed to large
variations in salinity and turbidity,
substrate found at stream mouths is
coarser than most sediments in the
Port
0 — no streams
Table 4.2 Criteria for Ranking Sources and Habitats: Factors Leading to Uncertainty
Are Included (continued)
L1655_C04.fm Page 66 Wednesday, September 22, 2004 2:45 PM
© 2005 by CRC Press LLC
APPLICATION OF THE RELATIVE RISK MODEL TO THE FJORD OF PORT VALDEZ 67
Table 4.3
Input to Relative Risk Model: Ranking for Source and Habitat b
y Subareas
Source Ranks
Subarea
Treated
Discharge
Contaminated
Runoff
Accidental
Spills
Fish
Waste
Vessel
Traffic
Construction
Development
Hatchery
Fish
Shoreline
Activity
Shoup Bay 0 2 2 0 2 0 0 2
Mineral and Gold Creeks 0 2 2 0 2 2 0 4
City of Valdez 0 6 6 6 6 4 0 6
Duck Flats and Old Valdez 4 4 4 0 4 4 0 6
Lowe and Robe Rivers 0 4 2 0 2 4 2 2
Dayville and Solomon Gulch 0 2 4 4 4 2 6 4
Valdez Marine Terminal 6 4 6 2 6 4 4 6
Sawmill to Seven-Mile Creeks 0 0 2 0 2 0 4 0
Anderson Bay 0 0 2 0 2 6 4 2
Western Port 0 0 4 2 6 0 0 0
Eastern Port 6 0 4 2 4 0 0 0
Habitat Ranks
Subarea Mudflat Saltmarsh
Spits and
Beaches
Rocky
Shore
Shallow
Subtidal
Deep
Benthic
Open
Water
Stream
Mouth
Shoup Bay 2 0 6 6 4 4 4 2
Mineral and Gold Creeks 4 0 2 4 6 0 0 6
City of Valdez 0 0 4 2 4 0 0 0
Duck Flats and Old Valdez 6 6 0 4 6 0 0 6
Lowe and Robe Rivers 6 0 0 0 2 0 0 6
Dayville and Solomon Gulch 4 0 2 0 2 0 0 4
Valdez Marine Terminal 2 0 2 4 2 0 0 2
Sawmill to Seven-Mile Creeks 2 0 6 2 2 0 0 2
Anderson Bay 2 0 2 6 2 0 0 2
Western Port 0 0 0 0 0 6 6 0
Eastern Port 0 0 0 0 0 6 6 0
L1655_C04.fm Page 67 Wednesday, September 22, 2004 2:45 PM
© 2005 by CRC Press LLC
68 REGIONAL SCALE ECOLOGICAL RISK ASSESSMENT
Table 4.4 Inputs to the Relative Risk Model: Filters for Exposure from Each Source to Each Habitat and for the Effects for
Each Endpoint under Evaluation
Sources
Habitats
Treated
Discharge
Contaminated
Runoff
Accidental
Spills
Fish
Waste
Vessel
Traffic
Construction
Development
Hatchery
Fish
Shoreline
Activity
Exposure Filter
Saltmarsh 0 1 1 0 0 1 0 1
Mudflat 0 1 1 0 0 1 0 1
Spits and Beaches 0 1 1 0 0 1 0 1
Rocky Shoreline 0 0 1 0 0 0 0 1
Shallow Subtidal 1 1 1 1 1 0 0 0
Deep Benthic 1 0 0 1 1 1 0 0
Open Water 1 1 1 0 1 0 1 0
Stream Mouth 0 1 1 0 0 1 1 0
Effects Filter: Water Quality
Saltmarsh 0 1 1 0 0 1 0 0
Mudflat 0 1 1 0 0 1 0 0
Spits and Beaches 0 1 1 0 0 1 0 0
Rocky Shoreline 0 0 1 0 0 0 0 0
Shallow Subtidal 1 1 1 1 1 0 0 0
Deep Benthic 1 0 0 1 1 1 0 0
Open Water 1 1 1 0 1 0 0 0
Stream Mouths 0 1 1 0 0 1 1 0
Effects Filter: Sediment Quality
Saltmarsh 0 1 1 0 0 1 0 1
Mudflat 0 1 1 0 0 1 0 1
Spits and Beaches 0 1 1 0 0 1 0 1
Rocky Shoreline 0 0 1 0 0 0 0 1
Shallow Subtidal 1 1 1 1 1 0 0 0
Deep Benthic 1 0 0 1 1 1 0 0
L1655_C04.fm Page 68 Wednesday, September 22, 2004 2:45 PM
© 2005 by CRC Press LLC
© 2005 by CRC Press LLC
APPLICATION OF THE RELATIVE RISK MODEL TO THE FJORD OF PORT VALDEZ 69
Open Water 1 1 1 0 1 0 1 0
Stream Mouths 0 1 1 0 0 1 1 0
Effects Filter: Hatchery Salmon Culture and Migration
Saltmarsh 0 1 1 0 0 1 0 0
Mudflat 0 1 1 0 0 1 0 0
Spits and Beaches 0 1 1 0 0 1 0 0
Rocky Shoreline 0 0 1 0 0 0 0 0
Shallow Subtidal 1 1 1 1 1 0 0 0
Deep Benthic 0 0 0 0 0 0 0 0
Open Water 1 1 1 0 1 0 1 0
Stream Mouths 0 1 1 0 0 1 1 0
Effects Filter: Bottom Fishes and Shellfishes
Saltmarsh 0 0 0 0 0 0 0 0
Mudflat 0 0 0 0 0 0 0 0
Spits and Beaches 0 0 0 0 0 0 0 0
Rocky Shoreline 0 0 1 0 0 0 0 0
Shallow Subtidal 1 1 1 1 1 0 0 0
Deep Benthic 1 0 0 1 1 1 0 0
Open Water 0 0 0 0 0 0 0 0
Stream Mouths 0 0 0 0 0 0 0 0
Effects Filter: Wild Anadromous Fishes
Saltmarsh 0 1 1 0 0 1 0 0
Mudflat 0 1 1 0 0 1 0 0
Spits and Beaches 0 1 1 0 0 1 0 0
Rocky Shoreline 0 0 1 0 0 0 0 0
Shallow Subtidal 1 1 1 1 1 0 0 0
Deep Benthic 0 0 0 0 0 0 0 0
Open Water 1 1 1 0 1 0 1 0
Stream Mouths 0 1 1 0 0 1 1 0
Table 4.4 Inputs to the Relative Risk Model: Filters for Exposure from Each Source to Each Habitat and for the Effects for
Each Endpoint under Evaluation (continued)
Sources
Habitats
Treated
Discharge
Contaminated
Runoff
Accidental
Spills
Fish
Waste
Vessel
Traffic
Construction
Development
Hatchery
Fish
Shoreline
Activity
L1655_C04.fm Page 69 Wednesday, September 22, 2004 2:45 PM
© 2005 by CRC Press LLC
© 2005 by CRC Press LLC
70 REGIONAL SCALE ECOLOGICAL RISK ASSESSMENT
Effects Filter: Bird Reproduction
Saltmarsh 0 1 1 0 0 1 0 1
Mudflat 0 1 1 0 0 1 0 1
Spits and Beaches 0 1 1 0 0 1 0 1
Rocky Shore 0 0 1 0 0 0 0 1
Shallow Subtidal 1 1 1 0 1 0 0 0
Deep Benthos 0 0 0 0 0 0 0 0
Open Water 1 1 1 0 1 0 0 0
Stream Mouths 0 1 1 0 0 1 0 0
Effects Filter: Food Availability for Wild Fishes, Birds, and Mammals
Saltmarsh 0 1 1 0 0 1 0 1
Mudflat 0 1 1 0 0 1 0 1
Spits and Beaches 0 1 1 0 0 1 0 1
Rocky Shoreline 0 0 1 0 0 0 0 1
Shallow Subtidal 1 1 1 1 1 0 0 0
Deep Benthic 1 0 0 1 1 1 0 0
Open Water 1 1 1 0 1 0 1 0
Stream Mouths 0 1 1 0 0 1 1 0
Table 4.4 Inputs to the Relative Risk Model: Filters for Exposure from Each Source to Each Habitat and for the Effects for
Each Endpoint under Evaluation (continued)
Sources
Habitats
Treated
Discharge
Contaminated
Runoff
Accidental
Spills
Fish
Waste
Vessel
Traffic
Construction
Development
Hatchery
Fish
Shoreline
Activity
L1655_C04.fm Page 70 Wednesday, September 22, 2004 2:45 PM
© 2005 by CRC Press LLC
© 2005 by CRC Press LLC
APPLICATION OF THE RELATIVE RISK MODEL TO THE FJORD OF PORT VALDEZ 71
We designed a sensitivity analysis to ascertain the variance of the results associated
with the mathematical model and the modeling input. Accuracy of the relative risk
results was explored through comparison of the confirmatory analyses used to
quantify or describe specific risks in the Port.
Sensitivity Analysis
The sensitivity analysis included two phases. Initially, the factors driving the
model were investigated by running the model with limited components. During the
second phase, we incorporated randomly chosen input and examined the results for
each subarea. We ran an additional test to determine the sensitivity of the model
when uncertainty in the ranks was considered. Instead of using randomly chosen
ranks for the input values, we allowed the model to choose from within a range of
ranks representing our uncertainty in the ranked values used for Port Valdez. The
ranges below were our subjective estimates of the probability and associated uncer-
tainty of impacts occurring, which we applied to each source–habitat combination:
0 none
(or very unlikely)
0 to 2 unlikely
0 to 4 unlikely but somewhat uncertain
0 to 6 possible but very uncertain
2 to 6 possible and somewhat uncertain
4 to 6 likely
We ran 20 trials with the randomly selected input. The results from these analyses
were plotted to demonstrate the possible variation in the results of the RRM when
uncertainty was included in the ranking process. The effect filters were not examined
in the sensitivity analysis as they were expected to have a similar influence on the
model results as the exposure filters.
Confirmatory Analysis
Available chemical data from Port Valdez provided an opportunity to test the
results of the RRM with more traditional analyses of risk from specific stressors.
Two approaches were used for the confirmatory analyses: (1) comparison of chemical
concentrations in effluent, sediment, and tissue samples to benchmark values; and
(2) modeling of chemical concentrations in sediment samples to determine toxicity to
marine amphipods. Each approach focused on chemical exposure and effects; available
data were not sufficient to assess physical or biological stressors in a similar manner.
Benchmark Values
This analysis compared PAH and metal concentrations from Port Valdez samples
to threshold levels derived in the literature. The Port data were compiled from
samples collected in conjunction with the BWTP permit (Alaska Pipeline Service
Company), the Alyeska Environmental Monitoring Program (Feder and Shaw 1993a;
L1655_C04.fm Page 71 Wednesday, September 22, 2004 2:45 PM
© 2005 by CRC Press LLC
72 REGIONAL SCALE ECOLOGICAL RISK ASSESSMENT
1993b; 1994a; 1995; 1996), the Long-Term Monitoring Program (LTEMP) (Kinnet-
ics Laboratories 1995; 1996), and the U.S. Army Corps of Engineers sampling in
the small boat harbor (U.S. Army Corps of Engineers, 1995), and a sea otter
disturbance study (Anthony 1995). Benchmark values were derived from the U.S.
EPA (USEPA 1996) program for developing ecotox thresholds (ETs), freshwater
benchmarks developed by Suter (1996), sediment effect ranges set by the National
Oceanic and Atmospheric Administration (NOAA) and developed by Long and
Morgan (1990), and wildlife threshold levels developed by Opresko et al. (1995).
The purpose of each study was to synthesize effect-based data into useful criteria
for determining the levels at which adverse effects occur. We compared the bench-
mark values to PAH and metal concentrations in sediments, effluent, and mussel
tissue from various locations in the Port and tallied the number of times each sample
concentration exceeded benchmark values.
Modeling PAH Toxicity in Sediments
The concentrations of selected PAHs in the sediments of Port Valdez have been
collected in a number of monitoring studies and occasional sampling events. Sam-
pling data included in this analysis are the same as those used in the benchmark
analysis above: small boat harbor (U.S. Army Corps of Engineers 1995), offshore
of the Valdez Marine Terminal and Gold Creek (Feder and Shaw 1993a; 1993b;
1994a; 1995; 1996; Kinnetics Laboratories 1995; 1996), near Solomon Gulch Hatch-
ery (Shaw 1996), and other deep water areas of the Port (Feder and Shaw 1993b;
1994a; 1995; 1996).
These measured values provided input for the
Σ
PAH model developed by Swartz
et al. (1995). The model combines the following five well-known models that can
be applied to hydrocarbons in sediment.
1. Equilibrium Partitioning Model: describes the partitioning of PAH in the sediment
interstitial water based on the total organic carbon content of the sediments.
2. QSAR Model: determines the acute toxicity of individual PAHs to amphipods in
a 10-day test.
3. Toxic Unit Model: describes the toxicity of PAHs in interstitial water.
4. Additivity Model: determines the total toxicity from 13 selected PAHs.
5. Concentration–Response Model: describes the mortality response of amphipods
to spiked field sediments.
The
Σ
PAH model predicts the probability of no toxicity (defined as < 13%
mortality), uncertain toxicity (defined as 13 to 24% mortality), and toxicity (defined
as > 24% toxicity).
RESULTS
Relative Risk in Port Valdez
Systematic application of the conceptual model to the habitats and risk sources
in each of the subareas led to a ranking of relative risk within the Port environment.
L1655_C04.fm Page 72 Wednesday, September 22, 2004 2:45 PM
© 2005 by CRC Press LLC
APPLICATION OF THE RELATIVE RISK MODEL TO THE FJORD OF PORT VALDEZ 73
The risk scores are unitless numbers that judge the relative severity of environmental
risk based on an informed decision-making process. The relative risk scores for Port
relative risk for each subarea in Port Valdez was calculated by summing across the
rows in either of the matrices in Table 4.5 or Table 4.6.
The scores ranged from 40 (Sawmill to Seven-Mile Creeks) to 448 (Duck Flats
and Old Valdez). We considered subareas with scores less than 150 to have low
relative risk. Subareas in this group included Shoup Bay, Sawmill to Seven-Mile
Creeks, Anderson Bay, and the Western Port. Subareas with scores between 150 and
300 were considered to have moderate relative risk. These included Mineral and
Gold Creeks, City of Valdez, Robe and Lowe Rivers, Dayville Flats and Solomon
Gulch, and the Valdez Marine Terminal. Only one subarea, Duck Flats and Old
Valdez, had a high risk score greater than 300. Because of the uncertainty associated
with the ranking process, comparisons of relative risk more detailed than these low,
moderate, and high groupings are probably not meaningful.
Our analysis suggested that the pelagic environment and western shoreline, areas
affected by less development, are at low relative risk. Most of the eastern shoreline
is at moderate relative risk. This includes subareas from the City of Valdez to the
Valdez Marine Terminal where a variety of development has occurred. The one
subarea of high relative risk, Duck Flats and Old Valdez, is located in the developed
eastern area. The greater risk predicted here by the model is related to the diversity
and quality of habitats in this area. Note that “high relative risk” may or may not
imply high risk in an absolute sense. Instead, this suggests that a greater degree of
environmental stress is possible, and that there is a higher probability that significant
ecological impacts will occur than in other areas of the Port.
The contribution of the eight-stressor sources to relative risk in the entire Port
Valdez region can be determined by summing down the column in Table 4.5.
Applying the same criteria defined above (low relative risk < 150; moderate relative
risk, 150 to 300; and high relative risk > 300), treated discharges, fish and seafood
wastes, and the presence of hatchery fish rank as low relative risk; vessel traffic and
construction and development activities as moderate relative risk; and contaminated
runoff, accidental spills, and shoreline activity as high relative risk. This distribution
of relative risk between sources is reasonable when characteristics of the stressors
associated with these sources are considered. Runoff, spills, and shoreline activity
behave similarly to nonpoint discharges, and the effects are likely to be widely
distributed throughout the Port. Treated discharges, and fish and seafood wastes
behave more like point sources and may be discharged into fewer subareas and
possibly less sensitive habitats.
The contribution of the eight habitat categories to relative risk in Port Valdez as
a whole can be determined by summing down the columns in the second matrix of
Table 4.6. Using the same criteria defined above, saltmarsh and deep benthic habitats
rank as low relative risk; spits and low-profile beaches, the rocky shoreline, and
open water habitats as moderate relative risk; and mudflats, shallow subtidal, and
stream mouth habitats as high relative risk. Relative risk to habitats in Port Valdez
as a whole is strongly influenced by the abundance of habitats across subareas. For
instance, saltmarsh occurs in only one subarea, Duck Flats and Old Valdez. Although
L1655_C04.fm Page 73 Wednesday, September 22, 2004 2:45 PM
© 2005 by CRC Press LLC
Valdez are presented in Tables 4.5 and 4.6, and summarized in Figure 4.2. The total
74 REGIONAL SCALE ECOLOGICAL RISK ASSESSMENT
Table 4.5 Ranked Relative Risk Output of Model by Source and Subarea. (The far right column is the sum for each subarea;
the bottom row is the sum for each source type)
Sources
Treated Contaminated Accidental Fish Vessel Construction Hatchery Shoreline Total Relative
Subarea Discharge Runoff Spills Waste Traffic Development Fish Activity Risk
Shoup Bay 0 36 48 0 24 0 0 28
136
Mineral and Gold Creeks 0 36 44 0 12 24 0 40
156
City of Valdez 0 48 60 24 24 16 0 36
208
Duck Flats and Old Valdez 24 96 112 0 24 72 0 96
424
Lowe and Robe Rivers 0 56 28 0 4 48 12 12
160
Dayville and Solomon Gulch 0 24 48 8 8 20 24 24
156
Valdez Marine Terminal 12 32 72 0 12 24 8 48
208
Sawmill to Seven-Mile Creeks 0 0 28 0 4 0 8 0
40
Anderson Bay 0 0 28 0 4 36 8 20
96
Western Port 0 0 24 12 72 0 0 0
108
Eastern Port 72 0 24 12 48 0 0 0
156
Total Relative Risk 108 328 516 56 239 240 60 304
L1655_C04.fm Page 74 Wednesday, September 22, 2004 2:45 PM
© 2005 by CRC Press LLC
APPLICATION OF THE RELATIVE RISK MODEL TO THE FJORD OF PORT VALDEZ 75
Table 4.6 Ranked Relative Risk Output of Model by Habitat and Subarea. (The far right column is the sum for each subarea
[risk region]; the bottom row is the sum for each habitat type)
Habitats Mudflat Saltmarsh
Spits and
Beaches
Rocky
Shoreline
Shallow
Subtidal
Deep
Benthic
Open
Water
Stream
Mouth
Total Relative
Risk
Subarea
Shoup Bay 12 0 36 24 24 8 24 8 136
Mineral and Gold Creeks 40 0 20 24 36 0 0 36 156
City of Valdez 0 0 88 24 96 0 0 0 208
Duck Flats and Old Valdez 108 108 0 40 96 0 0 72 424
Lowe and Robe Rivers 72 0 0 0 16 0 0 72 160
Dayville and Solomon Gulch 48 0 24 0 28 0 0 56 156
Valdez Marine Terminal 40 0 40 48 48 0 0 36 208
Sawmill to Seven-Mile Creeks 4 0 12 4 8 0 0 12 40
Anderson Bay 20 0 20 24 8 0 0 24 96
Western Port 0 0 0 0 0 48 60 0 108
Eastern Port 0 0 0 0 0 72 84 0 156
Total Relative Risk 344 108 240 188 360 128 168 316
L1655_C04.fm Page 75 Wednesday, September 22, 2004 2:45 PM
© 2005 by CRC Press LLC
76 REGIONAL SCALE ECOLOGICAL RISK ASSESSMENT
saltmarsh receives the highest possible ranking in that subarea, that alone still leads
to a low relative risk to Port Valdez as a whole. The reverse situation occurs for
open water habitat. The risk to open water in any individual subarea is never more
than half the maximum possible, but open water occurs in every subarea. The result
is that open water habitats have high relative risk for Port Valdez as a whole.
These results were based on the source–habitat combinations with the exposure
filter only applied. The effect filters further refined the scores and developed more
of relative risk (a) across the Port with the exposure filter alone, and (b) with the
exposure filter and the water quality effect filter. The results were similar, except
that the relative risk in two subareas (Gold and Mineral Creeks and Dayville Flats
and Solomon Gulch) changed from moderate to low with the water quality filter
applied. This difference reflected the removal of shoreline activity as a source of
concern for water quality issues.
Uncertainty
The features of the relative risk assessment gave rise to five general sources of
uncertainty:
1. Missing Information: Information gaps occur where sources or stressors in the
Port were not identified or important aspects of the ecology were not developed.
2. Ambiguities in the Available Information: Ambiguity exists in the anecdotal,
regulatory, and scientific data collected regarding the purposes of this study.
3. Error in the Conceptual Model: The conceptual model defines the components
and the links between these components that contribute to risk in the Port Valdez
system. Undefined links or links interpreted incorrectly will cause errors in accu-
racy or precision of the relative risk descriptions.
Figure 4.2 Total relative risk scores obtained for each subarea as categorized as high,
medium, and low risk.
L1655_C04.fm Page 76 Wednesday, September 22, 2004 2:45 PM
© 2005 by CRC Press LLC
specific results regarding each assessment endpoint. Figure 4.3 shows the distribution
APPLICATION OF THE RELATIVE RISK MODEL TO THE FJORD OF PORT VALDEZ 77
4. Error in the Estimate of Relative Risk: Misconceptions in the decision-making
process or inaccuracies in the numerical processing could result in erroneous
results. This error is partially evaluated through the sensitivity analysis.
5.Variability in the Environment: The combination of nonlinear and stochastic prop-
erties of nature creates variability in plant and animal populations and causes
variable responses to stressors. This form of uncertainty can be described, but not
reduced.
We assume that the estimates of ecological risk to Port Valdez derived from our
conceptual model contain substantial uncertainty. This uncertainty is reflected in our
categorizing relative risk in the broad terms of low, moderate, and high.
Figure 4.3 Relative risks associated with (a) exposure and (b) impacts to water quality.
D. Duck Flats and
Old Valdez
N
A. Shoup Bay
C. City
of Valdez
H. Sawmill to
Seven-Mile Creeks
K. Eastern Port
G. Valdez Marine
Terminal
I. Anderson Bay
B. Gold and
Mineral Creeks
(a) Exposure to Stressors
N
Nautical Miles
02
Nautical Miles
02
Nautical Miles
02
J. Western Port
E. Lowe and
Robe Rivers
F. Dayville Flats
and Solomon Gulch
D. Duck Flats and
Old Valdez
N
A. Shoup Bay
C. City
of Valdez
H. Sawmill to
Seven-Mile Creeks
K. Eastern Port
G. Valdez Marine
Terminal
I. Anderson Bay
B. Gold and
Mineral Creeks
(b) Water Quality
N
Nautical Miles
02
Nautical Miles
02
Nautical Miles
02
J. Western Port
E. Low and
Robe Rivers
F. Dayville Flats
and Solomon Gulch
Low
Moderate
Hi
g
h
Relative Risk Ratings:
L1655_C04.fm Page 77 Wednesday, September 22, 2004 2:45 PM
© 2005 by CRC Press LLC