Statistical Process Control 5 Part 2 pptx
Bạn đang xem bản rút gọn của tài liệu. Xem và tải ngay bản đầy đủ của tài liệu tại đây (414.96 KB, 35 trang )
22 Quality, processes and control
In spite of agreeing to your request to employ further inspection staff from
January to increase finished product inspection to 100 per cent, you will see
that overall quality costs have shown no significant change. I look forward
to receiving your comments on this.
Discuss the issues raised by the above memorandum.
5 You are a management consultant and have been asked to assist a
manufacturing company in which 15 per cent of the work force are final
product inspectors. Currently, 20 per cent of the firm’s output has to be
reworked or scrapped.
Write a report to the Managing Director of the company explaining, in
general terms, how this situation arises and what steps may be taken to
improve it.
6 Using a simple model of a process, explain the main features of a process
approach to total quality management and improvement.
7 Explain a system for statistical process control (SPC) which concentrates
attention on prevention of problems rather than their detection.
8 What are the basic tools of SPC and their main application areas?
2 Understanding the process
Objectives
᭹ To further examine the concept of process management and improving
customer satisfaction.
᭹ To introduce a systematic approach to:
defining customer–supplier relationships;
defining processes;
standardizing procedures;
designing/modifying processes;
improving processes.
᭹ To describe the various techniques of block diagramming and flowchart-
ing and to show their use in process mapping, examination and
improvement.
᭹ To position process mapping and analysis in the context of business
process re-engineering (BPR).
2.1 Improving customer satisfaction through process
management
An approach to improvement based on process alignment, starting with the
organization’s mission statement, analysing its critical success factors (CSFs),
and moving on to the key or critical processes is the most effective way to
engage the people in an enduring change process. In addition to the
knowledge of the business as a whole, which will be brought about by an
understanding of the mission→CSF→process breakdown links, certain tools,
techniques, and interpersonal skills will be required for good communication
around the processes, which are managed by the systems. These are essential
for people to identify and solve problems as teams, and form the components
of the model for TQM introduced in Chapter 1.
24 Understanding the process
Most organizations have functions: experts of similar backgrounds are
grouped together in a pool of knowledge and skills capable of completing any
task in that discipline. This focus, however, fosters a ‘vertical’ view and limits
the organization’s ability to operate effectively. Barriers to customer
satisfaction evolve, resulting in unnecessary work, restricted sharing of
resources, limited synergy between functions, delayed development time and
no clear understanding of how one department’s activities affect the total
process of attaining customer satisfaction. Managers remain tied to managing
singular functions, with rewards and incentives for their narrow missions,
inhibiting a shared external customer perspective (Figure 2.1).
Concentrating on managing processes breaks down these internal barriers
and encourages the entire organization to work as a cross-functional team with a
shared horizontal view of the business. It requires shifting the work focus from
managing functions to managing processes. Process owners, accountable for
the success of major cross-functional processes, are charged with ensuring that
employees understand how their individual work processes affect customer
satisfaction. The interdependence between one group’s work and the next
becomes quickly apparent when all understand who the customer is and the
value they add to the entire process of satisfying that customer (Figure 2.2).
The core business processes describe what actually is or needs to be done so
that the organization meets its CSFs. If the core processes are identified, the
questions will come thick and fast: Is the process currently carried out? By
Figure 2.1 Typical functional organization
Understanding the process 25
whom? When? How frequently? With what performance and how well
compared with competitors? The answering of these will force process
ownership into the business. The process owners should engage in
improvement activities which may lead through process analysis, self-
assessment and benchmarking to identifying the improvement opportunities for
the business. The processes must then be prioritized into those that require
continuous improvement, those which require re-engineering or re-design, and
those which require a complete re-think or visioning of the ideal process. The
outcome should be a set of ‘key processes’ which receive priority attention for
re-design or re-engineering.
Performance measurement of all processes is necessary to determine
progress so that the vision, goals, mission and CSFs may be examined and
reconstituted to meet new requirements for the organization and its customers
(internal and external). This whole approach forms the basis of a ‘Total
Organisational Excellence’
1
implementation framework (Figure 2.3).
Once an organization has defined and mapped out the core processes,
people need to develop the skills to understand how the new process structure
will be analysed and made to work. The very existence of new process quality
teams with new goals and responsibilities will force the organization into a
learning phase. These changes should foster new attitudes and behaviours.
Figure 2.2 Cross-functional approach to managing core processes
1
Oakland, J.S. (2001) Total Organisational Excellence, Butterworth-Heinemann, Oxford.
26 Understanding the process
2.2 Information about the process
One of the initial steps to understand or improve a process is to gather
information about the important activities so that a ‘dynamic model’ – a
process map or flowcharts – may be constructed. Process mapping creates a
picture of the activities that take place in a process. One of the greatest
difficulties here, however, is deciding how many tasks and how much detail
should be included. When initially mapping out a process, people often
include too much detail or too many tasks. It is important to consider the
sources of information about processes and the following aspects should help
to identify the key issues.
᭹ Defining supplier–customer relationships.
᭹ Defining the process.
᭹ Standardizing procedures.
᭹ Designing a new process or modifying an existing one.
᭹ Identifying complexity or opportunities for improvement.
Defining supplier–customer relationships
Since quality is defined by the customer, changes to a process are usually
made to increase satisfaction of internal and external customers. At many
Figure 2.3 Total organizational excellence framework
Understanding the process 27
stages in a process, it is necessary for ‘customers’ to determine their needs or
give their reaction to proposed changes in the process. For this it is often
useful to describe the edges or boundaries of the process – where does it start
and stop? This is accomplished by formally considering the inputs and outputs
of the process as well as the suppliers of the inputs and the customers of the
outputs – the ‘static model’. Figure 2.4 is a form that can be used to provide
focus on the boundary of any process and to list the inputs and suppliers to the
process, as well as the outputs and customers. These lists do not have to be
exhaustive, but should capture the important aspects of the process.
The form asks for some fundamental information about the process itself,
such as the name and the ‘owner’. The owner of a process is the person at the
lowest level in the organization that has the authority to change the process.
The owner has the responsibility of organizing and perhaps leading a team to
make improvements.
Documentation of the process, perhaps through the use of flowcharts, aids
the identification of the customers and suppliers at each stage. It is sometimes
surprisingly difficult to define these relationships, especially for internal
suppliers and customers. Some customers of an output may also have supplied
Figure 2.4 Describing the boundary of a process
28 Understanding the process
some of the inputs, and there are usually a number of customers for the same
output. For example, information on location and amount of stock or
inventory may be used by production planners, material handlers, purchasing
staff and accountants.
Defining the process
Many processes in need of improvement are not well defined. A production
engineering department may define and document in great detail a
manufacturing process, but have little or no documentation on the process of
design itself. If the process of design is to be improved, then knowledge of
that process will be needed to make it tangible.
The first time any process is examined, the main focus should be to put
everyone’s current knowledge of the process down on paper. A common
mistake is to have a technical process ‘expert’, usually a technologist,
engineer or supervisor, describe the process and then show it to others for their
comment. The first information about the process should come instead from
a brainstorming session of the people who actually operate or use the process,
day in and day out. The technical experts, managers and supervisors should
refrain from interjecting their ‘ideas’ until towards the end of the session. The
resulting description will be a reflection of how the process actually works.
During this initial stage, the concept of what the process could or should be
is distracting to the main purpose of the exercise. These ideas and concepts
should be discussed at a later time.
Flowcharts are important to study manufacturing processes, but they are
particularly important for non-manufacturing processes. Because of the lack
of documentation of administrative and service processes, it is sometimes
difficult to reach agreement on the flowcharts for a process. If this is the case,
a first draft of a process map can be circulated to others who are
knowledgeable of the process to seek their suggestions. Often, simply putting
a team together to define the process using flowcharts will result in some
obvious suggestions for improvement. This is especially true for non-
manufacturing processes.
Standardizing procedures
A significant source of variation in many processes is the use of different
methods and procedures by those working in the process. This is caused by the
lack of documented, standardized procedures, inadequate training or inade-
quate supervision. Flowcharts are useful for identifying parts of the process
where varying procedures are being used. They can also be used to establish
a standard process to be followed by all. There have been many cases where
standard procedures, developed and followed by operators, with the help of
Understanding the process 29
supervisors and technical experts, have resulted in a significant reduction in
the variation of the outcomes.
Designing or modifying an existing process
Once a process map has been developed, those knowledgeable in the operation
of the process should look for obvious areas of improvement or modification. It
may be that steps, once considered necessary, are no longer needed. Time
should not be wasted improving an activity that is not worth doing in the first
place. Before any team proceeds with its efforts to improve a process, it should
consider how the process should be designed from the beginning, and
‘assumption or rule-busting’ approaches are often required. Flowcharts of the
new process, compared to the existing process, will assist in identifying areas
for improvement. Flowcharts can also serve as the documentation of a new
process, helping those designing the process to identify weaknesses in the
design and prevent problems once the new process is put into use.
Identifying complexity or opportunities for improvement
In any process there are many opportunities for things to go wrong and, when
they do, what may have been a relatively simple activity can become quite
complex. The failure of an airline computer used to document reservations,
assign seats and print tickets can make the usually simple task of assigning a
seat to a passenger a very difficult one. Documenting the steps in the process,
identifying what can go wrong and indicating the increased complexity when
things do go wrong will identify opportunities for increased quality and
productivity.
2.3 Process mapping and flowcharting
In the systematic planning or examination of any process, whether it is a
clerical, manufacturing, or managerial activity, it is necessary to record the
series of events and activities, stages and decisions in a form which can be
easily understood and communicated to all. If improvements are to be made,
the facts relating to the existing method must be recorded first. The statements
defining the process should lead to its understanding and will provide the
basis of any critical examination necessary for the development of
improvements. It is essential, therefore, that the descriptions of processes are
accurate, clear and concise.
Process mapping and flowcharting are very important first steps in
improving a process. The flowchart ‘pictures’ will assist an individual or team
in acquiring a better understanding of the system or process under study than
would otherwise be possible. Gathering this knowledge provides a graphic
30 Understanding the process
definition of the system and the scope of the improvement effort. Process
mapping, is a communication tool that helps an individual or an improvement
team understand a system or process and identify opportunities for
improvement.
The usual method of recording and communicating facts is to write them
down, but this is not suitable for recording the complicated processes which
exist in any organization. This is particularly so when an exact record is
required of a long process, and its written description would cover several
pages requiring careful study to elicit every detail. To overcome this difficulty
certain methods of recording have been developed and the most powerful of
these are mapping and flowcharting. There are many different types of maps
and flowcharts which serve a variety of uses. The classical form of
flowcharting, as used in computer programming, can be used to document
current knowledge about a process, but there are other techniques which focus
efforts to improve a process.
Figure 2.5 is a high level process map showing how raw material for a
chemical plant was purchased, received, and an invoice for the material was
paid. Before an invoice could be paid, there had to be a corresponding
receiving report to verify that the material had in fact been received. The
accounts department was having trouble matching receiving reports to the
invoices because the receiving reports were not available or contained
incomplete or incorrect information. A team was formed with members from
the accounts, transportation, purchasing and production departments. At the
early stages of the project, it was necessary to have a broad overview of the
Figure 2.5 Acquisition of raw materials process map
Understanding the process 31
process, including some of the important outputs and some of the problems
that could occur at each stage. The process map or block diagram in Figure 2.5
served this purpose. The sub-processes, activities and tasks are shown under
each block.
Figure 2.6 is an example of a process diagram which incorporates another
dimension by including the person or group responsible for performing the
task in the column headings. This type of flowchart is helpful in determining
customer–supplier relationships and is also useful to see where departmental
boundaries are crossed and to identify areas where interdepartmental
Figure 2.6 Paperwork for sale of product flowchart
32 Understanding the process
communications are inadequate. The diagram in Figure 2.6 was drawn by a
team working on improving the administrative aspects of the ‘sales’ process.
The team had originally drawn a map of the entire sales operation using a
form similar to the one in Figure 2.5. After collecting and analysing some
data, the team focused on the problem of not being able to locate specific
paperwork. Figure 2.6 was then prepared to focus the movement of paperwork
from area to area, in what are sometimes known as ‘swim-lanes’.
Classic flowcharts
Certain standard symbols are used on the ‘classic’ detailed flowchart and
these are shown in Figure 2.7. The starting point of the process is indicated by
a circle. Each processing step, indicated by a rectangle, contains a description
of the relevant operation, and where the process ends is indicated by an oval.
A point where the process branches because of a decision is shown by a
diamond. A parallelogram contains useful information but it is not a
processing step; a rectangle with a wavy bottom line refers to paperwork or
records including computer files. The arrowed lines are used to connect
Figure 2.7 Flowcharting symbols
Understanding the process 33
symbols and to indicate direction of flow. For a complete description of the
process all operation steps (rectangles) and decisions (diamonds) should be
connected by pathways from the start circle to the end oval. If the flowchart
cannot be drawn in this way, the process is not fully understood.
Flowcharts are frequently used to communicate the components of a system
or process to others whose skills and knowledge are needed in the
improvement effort. Therefore, the use of standard symbols is necessary to
remove any barrier to understanding or communication.
The purpose of the flowchart analysis is to learn why the current system/
process operates in the manner it does, and to prepare a method for objective
analysis. The team using the flowchart should analyse and document their
findings to identify:
1 the problems and weaknesses in the current process system;
2 unnecessary steps or duplication of effort;
3 the objectives of the improvement effort.
The flowchart techniques can also be used to study a simple system and
how it would look if there were no problems. This method has been called
‘imagineering’ and is a useful aid to visualizing the improvements
required.
It is a salutary experience for most people to sit down and try to draw the
flowchart for a process in which they are involved every working day. It is
often found that:
1 the process flow is not fully understood;
2 a single person is unable to complete the flowchart without help from
others.
The very act of flowcharting will improve knowledge of the various levels of
the process, and will begin to develop the teamwork necessary to find
improvements. In many cases the convoluted flow and octopus-like
appearance of the charts will highlight unnecessary movement of people and
materials and lead to suggestions for waste elimination.
Flowchart construction features
The boundaries of the process must be clearly defined before the flowcharting
begins. This will be relatively easy if the outputs and customers, inputs and
suppliers are clearly identified. All work connected with the process to be
studied must be included. It is most important to include not only the formal,
but also the informal activities. Having said that, it is important to keep the
flowcharts as simple as possible.
34 Understanding the process
Figure 2.8 ‘Classic’ flowchart for part of a contact lens conversion process
Understanding the process 35
Every route through a flowchart must lead to an end point and each process
step must have one output line. Each decision diamond should have only two
outputs which are labelled ‘Yes’ and ‘No’, which means that the questions
must be phrased so that they may be answered in this way.
An example of a ‘classic’ flowchart for part of a contact lens conversion
process is given in Figure 2.8. Clearly several of the operational steps could
be flowcharted in turn to give further detail.
2.4 Process analysis
A flowchart is a picture of the steps used in performing a function. This
function can be anything from a chemical process step to accounting
procedures, even preparing a meal. Flowcharts provide excellent docu-
mentation and are useful trouble shooting tools to determine how each step
is related to the others. By reviewing the flowcharts it is often possible to
discover inconsistencies and determine potential sources of variation and
problems. For this reason, flowcharts are very useful in process improve-
ment when examining an existing process to highlight the problem area. A
group of people, with knowledge about the process, should follow the
simple steps:
1 Draw flowcharts of the existing process, ‘as is’.
2 Draw charts of the flow the process could or should follow, ‘to be’.
3 Compare the two sets of charts to highlight the sources of the problems or
waste, improvements required, and changes necessary.
A critical examination of the first set of flowcharts is often required, using a
questioning technique, which follows a well-established sequence to
examine:
the purpose for which
the place at which
the sequence in which the activities are undertaken,
the people by which
the method by which
·
eliminating
combining
with a view to rearranging those activities.
or
Ά
simplifying
·
36 Understanding the process
The questions which need to be answered in full are:
Purpose: What is actually done?
(or What is actually achieved?)
Why is the activity necessary at all?
What else might be or should be done?
·
Eliminate
unnecessary
parts of the
job.
Place: Where is it being done?
Why is it done at that particular place?
Where else might it or should it be done?
Sequence: When is it done?
Why is it done at that particular time?
When might or should it be done?
People: Who does it?
Why is it done by that particular person?
Who else might or should do it?
·
Combine
wherever
possible
and/or
rearrange
operations for
more effective
results or
reduction in
waste.
Method: How is it done?
Why is it done in that particular way?
How else might or should it be done?
·
Simplify
the operations
Questions such as these, when applied to any process, will raise many points
which will demand explanation.
There is always room for improvement and one does not have to look far
to find many real-life examples of what happens when a series of activities is
started without being properly planned. Examples of much waste of time and
effort can be found in factories and offices all over the world.
Development and re-design of the process
Process mapping or flowcharting and analysis is an important component of
business process re-design (BPR). As described at the beginning of this
chapter, BPR begins with the mission for the organization and an
identification of the critical success factors and critical processes. Successful
practitioners of BPR have made striking improvements in customer
Understanding the process 37
satisfaction and productivity in short periods of time, often by following these
simple steps of process analysis:
᭹ Document and map/flowchart the process – making visible the invisible
through mapping/flowcharting is the first crucial step that helps an
organization see the way work really is done and not the way one thinks
or believes it should be done. Seeing the process ‘as is’ provides a
baseline from which to measure, analyse, test and improve.
᭹ Identify process customers and their requirements; establish effectiveness
measurements – recognizing that satisfying the external customer is a
shared purpose, all internal and external suppliers need to know what
customers want and how well their processes meet customer
expectations.
᭹ Analyse the process; rank problems and opportunities – collecting
supporting data allows an organization to weigh the value each task adds
to the total process, to select areas for the greatest improvement and to
spot unnecessary work and points of unclear responsibility.
᭹ Identify root causes of problems; establish control systems – clarifying the
source of errors or defects, particularly those that cross department lines,
safeguards against quick-fix remedies and assures proper corrective
action.
᭹ Develop implementation plans for recommended changes – involving all
stakeholders, including senior management, in approval of the action plan
commits the organization to implementing change and following through
the ‘to be’ process.
᭹ Pilot changes and revise the process – validating the effectiveness of the
action steps for the intended effect leads to reinforcement of the ‘to be’
process strategy and to new levels of performance.
᭹ Measure performance using appropriate metrics – once the processes have
been analysed in this way, it should be possible to develop metrics for
measuring the performance of the ‘to be’ processes, sub-processes,
activities, and tasks. These must be meaningful in terms of the inputs and
outputs of the processes, and in terms of the customers of and suppliers.
2.5 Statistical process control and process understanding
Statistical process control (SPC) has played a major part in the efforts of many
organizations and industries to improve the competitiveness of their products,
services, prices and deliveries. But what does SPC mean? A statistician may
tell you that SPC is the application of appropriate statistical tools to processes
for continuous improvement in quality of products and services, and
productivity in the workforce. This is certainly accurate, but at the outset, in
38 Understanding the process
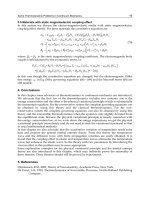
Figure 2.9 Step-by-step approach to developing or improving a process
Understanding the process 39
many organizations, SPC would be better defined as a simple, effective
approach to problem solving, and process improvement, or even Stop
Producing Chaos!
Every process has problems that need to be solved, and the SPC tools are
universally applicable to everyone’s job – manager, operator, secretary,
chemist, engineer, whatever. Training in the use of these tools should be
available to everyone within an organization, so that each ‘worker’ can
contribute to the improvement of quality in his or her work. Usually, the
technical people are the major focus of training in SPC, with concentration on
the more technical tools, such as control charts. The other simpler basic tools,
such as flowcharts, cause and effect diagrams, check sheets, and Pareto charts,
however, are well within the capacity of all employees.
Simply teaching individual SPC tools to employees is not enough.
Making a successful transition from classroom examples to on-the-job
application is the key to successful SPC implementation and problem
solving. With the many tools available, the employee often wonders which
one to use when confronted with a quality problem. What is often lacking
in SPC training is a simple step-by-step approach to developing or
improving a process.
Such an approach is represented in the flowchart of Figure 2.9. This ‘road
map’ for problem solving intuitively makes sense to most people, but its
underlying feature is that each step has certain SPC techniques that are
appropriate to use in that step. This should reduce the barriers to acceptance
of SPC and greatly increase the number of people capable of using it.
The various steps in Figure 2.9 require the use of the basic SPC ‘tool kit’
introduced in Chapter 1 and which will be described in full in the remaining
chapters of this book. This is essential if a systematic approach is to be
maintained and satisfactory results are to be achieved. There are several
benefits which this approach brings and these include:
᭹ There are no restrictions as to the type of problem selected, but the process
originally tackled will be improved.
᭹ Decisions are based on facts not opinions – a lot of the ‘emotion’ is
removed from problems by this approach.
᭹ The quality ‘awareness’ of the workforce increases because they are
directly involved in the improvement process.
᭹ The knowledge and experience potential of the people who operate the
process is released in a systematic way through the investigative
approach. They better understand that their role in problem solving is
collecting and communicating the facts with which decisions are made.
᭹ Managers and supervisors solve problems methodically, instead of by
using a ‘seat-of-the-pants’ style. The approach becomes unified, not
individual or haphazard.
40 Understanding the process
Chapter highlights
᭹ Improvement should be based on process alignment, starting with the
organization’s mission statement, its critical success factors (CSFs) and
critical processes.
᭹ Creation of ‘dynamic models’ through mapping out the critical processes
will engage the people in an enduring change process.
᭹ A systematic approach to process understanding includes: defining
supplier/customer relationships; defining the process; standardizing the
procedures; designing a new process or modifying an existing one;
identifying complexity or opportunities for improvement. The boundaries
of the process must be defined.
᭹ Process mapping and flowcharting allows the systematic planning,
description and examination of any process.
᭹ There are various kinds of flowcharts, including block diagrams, person/
function based charts, and ‘classic’ ones used in computer programming.
Detailed flowcharts use symbols to provide a picture of the sequential
activities and decisions in the process: start, operation (step), decision,
information/record block, flow, end. The use of flowcharting to map out
processes, combined with a questioning technique based on purpose
(what/why?), place (where?), sequence (when?), people (who?), and
method (how?) ensures improvements.
᭹ Business process re-design (BPR) uses process mapping and flowcharting
to achieve improvements in customer satisfaction and productivity by
moving from the ‘as is’ to the ‘to be’ process.
᭹ SPC is above all a simple, effective approach to problem solving and
process improvement. Training in the use of the basic tools should be
available for everyone in the organization. However, training must be
followed up to provide a simple stepwise approach to improvement.
᭹ The SPC approach, correctly introduced, will lead to decisions based on
facts, an increase in quality awareness at all levels, a systematic approach
to problem solving, release of valuable experience, and all-round
improvements, especially in communications.
᭹ Communications across and between all functions are enhanced, due to
the excellence of the SPC tools as modes of communication.
The combination of a systematic approach, SPC tools, and outside hand-
holding assistance when required, helps organizations make the difficult
transition from learning SPC in the classroom to applying it in the real world.
This concentration on applying the techniques rather than simply learning
them will lead to successful problem solving and process improvement.
Understanding the process 41
References
Harrington, H.J. (1991) Business Process Improvement, McGraw-Hill, New York, USA.
Harrington, H.J. (1995) Total Improvement Management, McGraw-Hill, New York, USA.
Modell, M.E. (1988) A Professional’s Guide to Systems, McGraw-Hill, New York, USA.
Oakland, J.S. (2001) Total Organisational Excellence, Butterworth-Heinemann, Oxford, UK.
Pyzdek, T. (1990) Pyzdek’s Guide to SPC, Volume One – Fundamentals, ASQ Press, Milwaukee
WI, USA.
Discussion questions
1 Outline the initial steps you would take first to understand and then to
improve a process in which you work.
2 Construct a ‘static model’ or map of a process of your choice, which you
know well. Make sure you identify the customer(s) and outputs, suppliers
and inputs, how you listen to the ‘voice of the customer’ and hear the ‘voice
of the process’.
3 Describe in detail the technique of flowcharting to give a ‘dynamic model’
of a process. Explain all the symbols and how they are used together to
create a picture of events.
4 What are the steps in a critical examination of a process for improvement?
Flowchart these into a systematic approach.
3 Process data collection and
presentation
Objectives
᭹ To introduce the systematic approach to process improvement.
᭹ To examine the types of data and how data should be recorded.
᭹ To consider various methods of presenting data, in particular bar charts,
histograms, and graphs.
3.1 The systematic approach
If we adopt the definition of quality as ‘meeting the customer requirements’,
we have already seen the need to consider the quality of design and the quality
of conformance to design. To achieve quality therefore requires:
᭹ an appropriate design;
᭹ suitable resources and facilities (equipment, premises, cash, etc.);
᭹ the correct materials;
᭹ people, with their skills, knowledge and training;
᭹ an appropriate process;
᭹ sets of instructions;
᭹ measures for feedback and control.
Already quality management has been broken down into a series of
component parts. Basically this process simply entails narrowing down each
task until it is of a manageable size. Considering the design stage, it is vital
to ensure that the specification for the product or service is realistic.
Excessive, unnecessary detail here frequently results in the specification being
ignored, at least partially, under the pressures to contain costs. It must be
reasonably precise and include some indication of priority areas. Otherwise it
will lead to a product or service that is unacceptable to the market. A
Process data collection and presentation 43
systematic monitoring of product/service performance should lead to better
and more realistic specifications. That is not the same thing as adding to the
volume or detail of the documents.
The ‘narrowing-down’ approach forces attention to be focused on one of
the major aspects of quality – the conformance or the ability to provide
products or services consistently to the design specification. If all the suppliers
in a chain adequately control their processes, then the product/service at each
stage will be of the specified quality.
This is a very simple message which cannot be over-stated, but some
manufacturing companies still employ a large inspectorate, including many
who devote their lives to sorting out the bad from the good, rather than
tackling the essential problem of ensuring that the production process remains
in control. The role of the ‘inspector’ should be to check and audit the systems
of control, to advise, calibrate, and where appropriate to undertake complex
measurements or assessments. Quality can be controlled only at the point of
manufacture or service delivery, it cannot be elsewhere.
In applying a systematic approach to process control the basic rules are:
᭹ No process without data collection
᭹ No data collection without analysis
᭹ No analysis without decision
᭹ No decision without action (which can include no action necessary).
Data collection
If data are not carefully and systematically recorded, especially at the point of
manufacture or operation, they cannot be analysed and put to use. Information
recorded in a suitable way enables the magnitude of variations and trends to
be observed. This allows conclusions to be drawn concerning errors, process
capability, vendor ratings, risks, etc. Numerical data are often not recorded,
even though measurements have been taken – a simple tick or initials is often
used to indicate ‘within specifications’, but it is almost meaningless. The
requirement to record the actual observation (the reading on a measured scale,
or the number of times things recurred), can have a marked effect on the
reliability of the data. For example, if a result is only just outside a specified
tolerance, it is tempting to put down another tick, but the actual recording of
a false figure is much less likely. The value of this increase in the reliability
of the data when recorded properly should not be under-estimated. The
practice of recording a result only when it is outside specification is also not
recommended, since it ignores the variation going on within the tolerance
limits which, hopefully, makes up the largest part of the variation and,
therefore, contains the largest amount of information.
44 Process data collection and presentation
Analysis, decision, action
The tools of the ‘narrowing-down’ approach are a wide range of simple, yet
powerful, problem-solving and data-handling techniques, which should form
a part of the analysis–decision–action chain with all processes. These
include:
᭹ Process mapping and flowcharting (Chapter 2);
᭹ Check sheets/tally charts;
᭹ Bar charts/histograms;
᭹ Graphs;
᭹ Pareto analysis (Chapter 11);
᭹ Cause and effect analysis (Chapter 11);
᭹ Scatter diagrams (Chapter 11);
᭹ Control charts (Chapters 5, 6, 7, 8, 9, and 12);
᭹ Stratification (Chapter 11).
3.2 Data collection
Data should form the basis for analysis, decision and action, and their form and
presentation will obviously differ from process to process. Information is
collected to discover the actual situation. It may be used as a part of a product or
process control system and it is important to know at the outset what the data are
to be used for. For example, if a problem occurs in the amount of impurity
present in a product that is manufactured continuously, it is not sufficient to take
only one sample per day to find out the variations between – say – different
operator shifts. Similarly, in comparing errors produced by two accounting
procedures, it is essential to have separate data from the outputs of both. These
statements are no more than common sense, but it is not unusual to find that
decisions and action are based on misconceived or biased data. In other words,
full consideration must be given to the reasons for collecting data, the correct
sampling techniques, and stratification. The methods of collecting data and the
amount collected must take account of the need for information and not the ease
of collection; there should not be a disproportionate amount of a certain kind of
data simply because it can be collected easily.
Types of data
Numeric information will arise from both counting and measurement.
Data that arise from counting can occur only in discrete steps. There can be
only 0, 1, 2, etc., defectives in a sample of 10 items, there cannot be 2.68
defectives. The number of defects in a length of cloth, the number of typing
errors on a page, the presence or absence of a member of staff, are all called
Process data collection and presentation 45
attributes. As there is only a two-way or binary classification, attributes give
rise to discrete data, which necessarily varies in steps.
Data that arise from measurements can occur anywhere at all on a
continuous scale and are called variable data. The weight of a tablet, share
prices, time taken for a rail journey, age, efficiency, and most physical
dimensions, are all variables, the measurement of which produces continuous
data. If variable data were truly continuous, they could take any value within
a given range without restriction. However, owing to the limitations of
measurement, all data vary in small jumps, the size of which is determined by
the instruments in use.
The statistical principles involved in the analysis of whole numbers are not
usually the same as those involved in continuous measurement. The
theoretical background necessary for the analysis of these different types of
data will be presented in later chapters.
Recording data
After data are collected, they are analysed and useful information is extracted
through the use of statistical methods. It follows that data should be obtained
in a form that will simplify the subsequent analysis. The first basic rule is to
plan and construct the pro formas paperwork or computer systems for data
collection. This can avoid the problems of tables of numbers, the origin and
relevance of which has been lost or forgotten. It is necessary to record not only
the purpose of the observation and its characteristics, but also the date, the
sampling plan, the instruments used for measurement, the method, the person
collecting the data, and so on. Computers can play an important role in both
establishing and maintaining the format for data collection.
Data should be recorded in such a way that they are easy to use.
Calculations of totals, averages, and ranges are often necessary and the format
used for recording the data can make these easier. For example, the format and
data recorded in Figure 3.1 have clearly been designed for a situation in which
the daily, weekly and grand averages of a percentage impurity are required.
Columns and rows have been included for the totals from which the averages
are calculated. Fluctuations in the average for a day can be seen by looking
down the columns, whilst variations in the percentage impurity at the various
sample times can be reviewed by examining the rows.
Careful design of data collection will facilitate easier and more meaningful
analysis. A few simple steps in the design are listed below:
᭹ agree on the exact event to be observed – ensure that everyone is
monitoring the same thing(s);
᭹ decide both how often the events will be observed (the frequency) and
over what total period (the duration);
46 Process data collection and presentation
᭹ design a draft format – keep it simple and leave adequate space for the
entry of the observations;
᭹ tell the observers how to use the format and put it into trial use – be careful
to note their initial observations, let them know that it will be reviewed
after a period of use and make sure that they accept that there is adequate
time for them to record the information required;
᭹ make sure that the observers record the actual observations and not a ‘tick’
to show that they made an observation;
᭹ review the format with the observers to discuss how easy or difficult it has
proved to be in use, and also how the data have been of value after
analysis.
All that is required is some common sense. Who cannot quote examples of
forms that are almost incomprehensible, including typical forms from
government departments and some service organizations? The author recalls
a whole improvement programme devoted to the re-design of forms used in a
bank – a programme which led to large savings and increased levels of
customer satisfaction.
3.3 Bar charts and histograms
Every day, throughout the world, in offices, factories, on public transport,
shops, schools and so on, data are being collected and accumulated in various
Figure 3.1 Data collection for impurity in a chemical process