The Water Encyclopedia: Hydrologic Data and Internet Resources - Chapter 9 potx
Bạn đang xem bản rút gọn của tài liệu. Xem và tải ngay bản đầy đủ của tài liệu tại đây (696 KB, 54 trang )
CHAPTER 9
Wastewater
William H. Lynch
CONTENTS
Section 9A Wastewater Characteristics 9-2
Section 9B Centralized Wastewater Treatment 9-20
Section 9C Decentralized Wastewater Treatment 9-40
Section 9D Industrial Wastewater Treatment 9-49
9-1
q 2006 by Taylor & Francis Group, LLC
SECTION 9A WASTEWATER CHARACTERISTICS
10.0
8.0
6.0
5.0
4.0
3.0
2.0
1.5
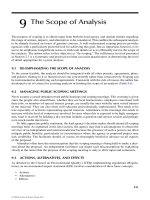
Ratio of Q peak hourly/Q design ave
1.0
0.1 0.2 0.3 0.4 0.5 0.7 1.0
Population in thousands
Q peak hourly: Maximum rate of wastewater flow (Peak hourly flow)
Q design ave: Design average daily wastewater flow
2 3 4 5 7 10 20 30 40 50 70 100
Source: Q peak hourly/Q design ave =
18 + P
- - - (P = population in thousands)
4 + P
Figure 9A.1 Ratio of peak hourly flow to design average flow. (From Board of State and Provincial Public Health and Environmental
Managers, Health Education Services Division, Recommended Standards for Wastewater Facilities, Figure 1, p. 10.5, 2004 Edition.
www.hes.org.)
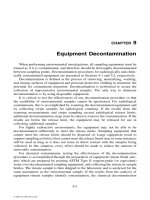
Preliminary Primary
Effluent Effluent Effluent
DisinfectionDisinfection Disinfection
Nitrogen removal
Nitrification–denitrification
selective ion exchange
breakpoint chlorination
gas stripping
overland flow
Phosphorus removal
Chemical precipitation
biological
Suspended solids removal
Chemical coagulation
filtration
Organics & metals removal
Carbon adsorption
chemical precipitation
Dissolved solids removal
Reverse osmosis
electrodialysis
distillation
ion exchange
Sedimentation
Low-rate processes
High-rate processes
Stabilization ponds
aerated lagoons
Activated sludge
trickling filters
RBCs
Disposal
Secondary
Advanced
Screening
comminution
grit removal
Disinfection
Secondary
sedimentation
Sludge processing
Figure 9A.2 Generalized flow sheet for wastewater treatment. (From USEPA, Manual Guidelines Water Reuse, Office of Water,
Figure 12 (EPA/625/R-92/004), September 1992.)
THE WATER ENCYCLOPEDIA: HYDROLOGIC DATA AND INTERNET RESOURCES9-2
q 2006 by Taylor & Francis Group, LLC
Table 9A.1 Typical Wastewater Flowrates from Urban Residential Sources in the United States
Household Size,
Flowrate, gal/capita d Flowrate, l/capita d
No. of Persons Range Typical Range Typical
1 75–130 97 285–490 365
2 63–81 76 225–385 288
3 54–70 66 194–335 250
4 41–71 53 155–268 200
5 40–68 51 150–260 193
6 39–67 50 147–253 189
7 37–64 48 140–244 182
8 36–62 46 135–233 174
Source: From Metcalf & Eddy, Inc., McGraw-Hill, Wastewater Engineering Treatment and Reuse, Fourth
Edition, 2003, Table 3.1, p. 156. With permission. Adapted in part from AWWARF (1999).
Table 9A.2 Typical Wastewater Flowrates from Recreational Facilities in the United States
Flowrate, gal/unit d Flowrate, l/unit d
Facility Unit Range Typical Range Typical
Apartment, resort Person 50–70 60 190–260 230
Cabin, resort Person 8–50 40 30–190 150
Cafeteria Customer 2–4 3 8–15 10
Employee 8–12 10 30–45 40
Camp
With toilets only Person 15–30 25 55–110 95
With central toilet
and bath facilities
Person 35–50 45 130–190 170
Day Person 15–20 15 55–76 60
Cottages, (seasonal
with private bath)
Person 40–60 50 150–230 190
Country club Member
present
20–40 25 75–150 100
Employee 10–15 13 38–57 50
Dining hall Meal
served
4–10 7 15–40 25
Dormitory, bunkhouse Person 20–50 40 75–190 150
Fairground Visitor 1–3 2 4–12 8
Picnic park with flush toilets Visitor 5–10 5 19–38 19
Recreational vehicle park
With individual connection Vehicle 75–150 100 280–570 380
With comfort station Vehicle 40–50 45 150–190 170
Roadside rest areas Person 3–5 4 10–19 15
Swimming pool Customer 5–12 10 19–45 40
Employee 8–12 10 30–45 40
Vacation home Person 25–60 50 90–230 190
Visitor center Visitor 3–5 4 10–19 15
Source: From Metcalf & Eddy, Inc., McGraw-Hill, Wastewater Engineering Treatment and Reuse, Fourth Edition,
2003, Table 3.4, p. 159. With permission. Adapted from Metcalf & Eddy (1991), Salvato (1992), and
Crites and Tchobanoglous (1998).
WASTEWATER 9-3
q 2006 by Taylor & Francis Group, LLC
Table 9A.3 Typical Wastewater Flowrates from Commercial Sources in the United States
Flowrate, gal/unit d Flowrate, l/unit d
Source Unit Range Typical Range Typical
Airport Passenger 3–5 4 11–19 15
Apartment Bedroom 100–150 120 380–570 450
Automobile service station Vehicle served 8–15 10 30–57 40
Employee 9–15 13 34–57 50
Bar/cocktail lounge Seat 12–25 20 45–95 80
Employee 10–16 13 38–60 50
Boarding house Person 25–65 45 95–250 170
Conference center Person 6–10 8 40–60 30
Department store Toilet room 350–600 400 1,300–2,300 1,500
Employee 8–15 10 30–57 40
Hotel Guest 65–75 70 150–230 190
Employee 8–15 10 30–57 40
Industrial building
(sanitary waste only)
Employee 15–35 20 57–130 75
Laundry (self-service) Machine 400–550 450 1,500–2,100 1,700
Customer 45–55 50 170–210 190
Mobile home park Unit 125–150 140 470–570 530
Motel (with kitchen) Guest 55–90 60 210–340 230
Motel (without kitchen) Guest 50–75 55 190–290 210
Office Employee 7–16 13 26–60 50
Public lavatory User 3–5 4 11–19 15
Restaurant:
Conventional Customer 7–10 8 26–40 35
With bar/ cocktail lounge Customer 9–12 10 34–45 40
Shopping center Employee 7–13 10 26–50 40
Parking space 1–3 2 4–11 8
Theater (Indoor) Seat 2–4 3 8–15 10
Source: From Metcalf & Eddy, Inc., McGraw-Hill, Wastewater Engineering Treatment and Reuse, Fourth
Edition, 2003, Table 3.2, p. 157. With permission. Adapted from Metcalf & Eddy (1991), Salvato (1992),
and Crites and Tchobanoglous (1998).
Table 9A.4 Typical Wastewater Flowrates from Institutional Sources in the United States
Flowrate, gal/unit d Flowrate, l/unit d
Source Unit Range Typical Range Typical
Assembly hall Guest 3–5 4 11–19 15
Hospital Bed 175–400 250 660–1,500 1,000
Employee 5–15 10 20–60 40
Institutions other than hospitals Bed 75–125 100 280–470 380
Employee 5–15 10 20–60 40
Prison Inmate 80–150 120 300–570 450
Employee 5–15 10 20–60 40
School, day:
With cafeteria, gym, and showers Student 15–30 25 60–120 100
With cafeteria only Student 10–20 15 40–80 60
School, boarding Student 75–100 85 280–380 320
Source: From Metcalf & Eddy, Inc., McGraw-Hill, Wastewater Engineering Treatment and Reuse, Fourth
Edition, 2003, Table 3.3, p. 158. With permission. Adapted from Metcalf & Eddy (1991), Salvato (1992),
and Crites and Tchobanoglous (1998).
THE WATER ENCYCLOPEDIA: HYDROLOGIC DATA AND INTERNET RESOURCES9-4
q 2006 by Taylor & Francis Group, LLC
Table 9A.5 Terminology Used to Quantify Observed Variations in Flowrate and Constituent Concentrations
Item Description
Average dry-weather flow (ADWF) The average of the daily flows sustained during dry-weather periods with limited infiltration
Average wet-weather flow (AWWF) The average of the daily flows sustained during wet-weather periods when infiltration is a factor
Average annual daily flow The average flowrate occurring over a 24-h period based on annual flowrate data
Instantaneous peak Highest record flowrate occurring for a period consistent with the recording equipment. In many
situations the recorded peak flow may be considerably below the actual peak flow because of
metering and recording equipment limitations
Peak hour The average of the peak flows sustained for a period of 1 h in the record examined (usually
based on 10-min increments)
Maximum day The average of the peak flows sustained for a period of 1 day in the record examined (the
duration of the peak flows may vary)
Maximum month The average of the maximum daily flows sustained for a period of 1 month in the record
examined
Minimum hour The average of the minimum flows sustained for a period of 1 h in the record examined
(usually based on 10-min increments)
Minimum day The average of the minimum flows sustained for a period of 1 day in the record examined
(usually for the period from 2 a.m. to 6 a.m.)
Minimum month The average of the minimum daily flows sustained for a period of 1 month in the record examined
Sustained flow (and load) The value (flowrate or mass loading) sustained or exceeded for a given period of time
(e.g., 1 h, 1 day, or 1 month)
Source: From Metcalf & Eddy, Inc., McGraw-Hill, Wastewater Engineering Treatment and Reuse, Fourth Edition, 2003, Table 3.11, p.
179. With permission. Adapted in part from Crites and Tchobanoglous (1998).
Table 9A.6 Terminology Commonly Used in the Field of Wastewater Engineering
Term Definition
Biosolids Primarily an organic, semisolid wastewater product that remains after solids are stabilized
biologically or chemically and are suitable for beneficial use
Class A biosolids
a
Biosolids in which the pathogens (including enteric viruses, pathogenic bacteria, and viable
helminth ova) are reduced below current detectable levels
Class B biosolids
a
Biosolids in which the pathogens are reduced to levels that are unlikely to pose a threat to
public health and the environment under specific use conditions. Class B biosolids cannot
be sold or given away in bags on other containers or applied on lawns or home gardens
Characteristics (wastewater) General classes of wastewater constituents such as physical, chemical, biological, and
biochemical
Composition The makeup of wastewater, including the physical, chemical, and biological constituents
Constituents
b
Individual components, elements, or biological entities such as suspended solids or
ammonia nitrogen
Contaminants Constituents added to the water supply through use
Disinfection Reduction of disease-causing microorganisms by physical or chemical means
Effluent The liquid discharged from a processing step
Impurities Constituents added to the water supply through use
Nonpoint sources Sources of pollution that originate from multiple sources over a relatively large area
Nutrient An element that is essential for the growth of plants and animals. Nutrients in wastewater,
usually nitrogen and phosphorus, may cause unwanted algal and plant growths in lakes
and streams
Parameter A measurable factor such as temperature
Point sources Pollutional loads discharged at a specific location from pipes, outfalls, and conveyance
methods from either municipal wastewater treatment plants or industrial waste treatment
facilities
Pollutants Constituents added to the water supply through use
Reclamation Treatment of wastewater for subsequent reuse application or the act of reusing treated
wastewater
(Continued)
WASTEWATER 9-5
q 2006 by Taylor & Francis Group, LLC
Table 9A.6 (Continued)
Term Definition
Recycling The reuse of treated wastewater and biosolids for beneficial purposes
Repurification Treatment of wastewater to a level suitable for a variety of applications including indirect or
direct potable reuse
Reuse Beneficial use of reclaimed or repurified wastewater or stabilized biosolids
Sludge Solids removed from wastewater during treatment. Solids that are treated further are termed
biosolids
Solids Material removed from wastewater by gravity separation (by clarifiers, thickeners, and
logoons) and is the solid residue from dewatering operations
a
U.S. EPA (1997b).
b
To avoid confusion, the term “constituents” is used in this text in place of contaminants, impurities, and pollutants.
Source: From Metcalf & Eddy, Inc., McGraw-Hill, Wastewater Engineering Treatment and Reuse, Fourth Edition, 2003, Table 1.1, p. 4.
With permission. Adapted in part from Crites and Tchobanoglous (1998).
Table 9A.7 Levels of Wastewater Treatment
Treatment Level Description
Preliminary Removal of wastewater constituents such as rags, sticks, floatables, grit, and grease that may
cause maintenance or operational problems with the treatment operations, processes, and
ancillary systems
Primary Removal of a portion of the suspended solids and organic matter from the wastewater
Advanced primary Enhanced removal of suspended solids and organic matter from the wastewater. Typically
accomplished by chemical addition or filtration
Secondary Removal of biodegradable organic matter (in solution or suspension) and suspended solids.
Disinfection is also typically included in the definition of conventional secondary treatment
Secondary with nutrient removal Removal of biodegradable organics, suspended solids, and nutrients (nitrogen, phosphorus, or
both nitrogen and phosphorus)
Tertiary Removal of residual suspended solids (after secondary treatment), usually by granular medium
filtration or microscreens. Disinfection is also typically a part of tertiary treatment. Nutrient
removal is often included in this definition
Advanced Removal of dissolved and suspended materials remaining after normal biological treatment
when required for various water reuse applications
Source: From Metcalf & Eddy, Inc., McGraw-Hill, Wastewater Engineering Treatment and Reuse, Fourth Edition, 2003, Table 1.4, p. 11.
Adapted in part from Crites and Tchobanoglous (1998).
THE WATER ENCYCLOPEDIA: HYDROLOGIC DATA AND INTERNET RESOURCES9-6
q 2006 by Taylor & Francis Group, LLC
Table 9A.8 Commonly Used Treatment Processes and Optional Treatment Methods
Treatment Objective Treatment Process Treatment Methods
Suspended solids removal Sedimentation Septic tank
Free water surface constructed wetland
Vegetated submerged bed
Filtration Septic tank effluent screens
Packed-bed media filters (incl. dosed systems)
Granular (sand, gravel, glass, bottom ash)
Peat, textile
Mechanical disk filters
Soil infiltration
Soluble carbonaceous BOD
and ammonium removal
Aerobic, suspended-growth
reactors
Extended aeration
Fixed-film activated sludge
Sequencing batch reactors (SBRs)
Fixed-film aerobic bioreactor Soil infiltration
Packed-bed media filters (incl. dosed systems)
Granular (sand, gravel, glass)
Peat, textile, foam
Trickling filter
Fixed-film activated sludge
Rotating biological contactors
Lagoons Facultative and aerobic lagoons
Free water surface constructed wetlands
Nitrogen transformation Biological Activated sludge (N)
Nitrification (N) Sequencing batch reactors (N)
Denitrification (D) Fixed film bio-reactor (N)
Recirculating media filter (N, D)
Fixed-film activated sludge (N)
Anaerobic upflow filter (N)
Anaerobic submerged media reactor (D)
Submerged vegetated bed (D)
Free water surface constructed wetland (N, D)
Ion exchange Cation exchange (ammonium removal)
Anion exchange (nitrate removal)
Phosphorus removal Physical/Chemical Infiltration by soil and other media
Chemical flocculation and settling
Iron-rich packed-bed media filter
Biological Sequencing batch reactors
Pathogen removal (bacteria,
viruses, parasites)
Filtration/Predation/Inactivation Soil infiltration
Packed-bed media filters
Granular (sand, gravel, glass bottom, ash)
Peat, textile
Disinfection Hypochlorite feed
Ultraviolet light
Grease removal Flotation Grease trap
Septic tank
Adsorption Mechanical skimmer
Aerobic biological treatment
(incidential removal will occur;
overloading is possible)
Aerobic biological systems
Source: From USEPA, On-Site Wastewater Treatment Systems Manual, Office of Water, Office of Research and Development, EPA,
(EPA/625/R-00/0008). www.epa.gov/ord/NRMRL/Pubs/625R00008/625R00008totaldocument.pdf.
WASTEWATER 9-7
q 2006 by Taylor & Francis Group, LLC
Table 9A.9 Number of Operational Treatment Facilities and Collection Systems in 2000
State Treatment Facilities Collection Systems
Alabama 272 275
Alaska 45 46
Arizona 118 132
Arkansas 335 367
California
a
586 797
Colorado
a
311 391
Connecticut 91 137
Delaware 18 42
District of Columbia 1 1
Florida 277 317
Georgia 352 403
Hawaii 21 21
Idaho 168 207
Illinois 721 1,018
Indiana 404 482
Iowa 726 756
Kansas 634 673
Kentucky 224 255
Louisiana 355 382
Maine 137 171
Maryland 156 201
Massachusetts 126 230
Michigan 396 663
Minnesota 514 655
Mississippi 303 352
Missouri 678 751
Montana 194 204
Nebraska 464 469
Nevada
b
85 117
New Hampshire 85 117
New Jersey 156 575
New Mexico 55 64
New York
a
588 1,048
North Carolina 491 617
North Dakota 282 284
Ohio 765 1,008
Oklahoma 489 495
Oregon 207 254
Pennsylvania 779 1,553
Rhode Island 21 34
South Carolina 186 206
South Dakota
a
271 274
Tennessee 246 281
Texas 1,363 1,675
Utah 97 164
Vermont 81 97
Virginia 227 290
Washington 235 331
West Virginia 212 289
Wisconsin 592 823
Wyoming
b
96 121
American Samoa
b
22
Guam
b
77
N. Mariana Islands
b
22
Puerto Rico
b
30 30
Virgin Islands
b
12 12
Total 16,255 21,107
a
California, Colorado, New York, and South Dakota did not have the resources to complete the updating of
these data.
b
Results presented in this table for American Samoa, Guam, Northern Mariana Islands, Nevada, Puerto
Rico, Virgin Islands, and Wyoming are from the 1996 survey because these States and Territories did not
participate in the CWNS 2000.
Source: From 2000 Clean Watersheds Needs Survey Report to Congress, Published 2003, Appendix C,
Table C.1, p. C.2. epa.gov/owm/mtb/cwns/2000rtc/cwns2000-appendix-c.pdf, epa.gov/owm/mtb/
cwns/2000rtc/toc.htm.
THE WATER ENCYCLOPEDIA: HYDROLOGIC DATA AND INTERNET RESOURCES9-8
q 2006 by Taylor & Francis Group, LLC
Table 9A.10 Number of Operational Treatment Facilities and Collection Systems if All Documented Needs
Are Met
State Treatment Facilities Collection Systems
Alabama 279 285
Alaska 50 51
Arizona 232 258
Arkansas 360 406
California
a
579 799
Colorado
a
331 430
Connecticut 99 159
Delaware 18 49
District of Columbia 1 1
Florida 302 346
Georgia 345 405
Hawaii 27 27
Idaho 177 219
Illinois 754 1,056
Indiana 424 510
Iowa 744 775
Kansas 665 712
Kentucky 301 369
Louisiana 371 405
Maine 145 184
Maryland 180 303
Massachusetts 141 267
Michigan 403 673
Minnesota 518 661
Mississippi 372 475
Missouri 729 848
Montana 208 218
Nebraska 475 483
Nevada
b
52 56
New Hampshire 85 120
New Jersey 164 600
New Mexico 58 68
New York
a
657 1,175
North Carolina 518 702
North Dakota 282 286
Ohio 837 1,213
Oklahoma 487 496
Oregon 219 270
Pennsylvania 1,013 1,936
Rhode Island 20 36
South Carolina 187 222
South Dakota
a
273 276
Tennessee 251 286
Texas 1,469 1,850
Utah 114 188
Vermont 84 100
Virginia 254 383
Washington 240 337
West Virginia 404 626
Wisconsin 628 974
Wyoming
b
96 121
American Samoa
b
22
Guam
b
67
N. Mariana Islands
b
22
Puerto Rico
b
30 30
Virgin Islands
b
12 12
Total 17,674 23,748
a
California, Colorado, New York, and South Dakota did not have the resources to complete the updating of these
data.
b
Results presented in this table for American Samoa, Guam, Northern Mariana Islands, Nevada, Puerto Rico, Virgin
Islands, and Wyoming are from the 1996 survey because these States and Territories did not participate in the
CWNS 2000.
Source: From 2000 Clean Watersheds Needs Survey Report to Congress, Published 2003, Appendix C, Table C.2,
p. C.3. www.epa.gov/owm/mtb/cwns/2000rtc/cwns2000-appendix-c.pdf, www.epa.gov/owm/mtb/cwns/
2000rtc/toc.htm.
WASTEWATER 9-9
q 2006 by Taylor & Francis Group, LLC
Table 9A.11 Number of Treatment Facilities by Flow Range
Treatment Facilities in Operation in 2000
a,b
Existing Flow Range (mgd) Number of Facilities Total Existing Flow (mgd)
0.001–0.100 6,583 290
0.101–1.000 6,462 2,339
1.001–10.000 2,665 8,328
10.001–100.000 487 12,741
100.001 and greater 46 11,201
Other
c
12 —
Total 16,255 34,899
Treatment Facilities in Operation in 2000 if All Documented Needs Are Met
a,b
Design Flow Range (mgd) Number of Facilities
Total Future Design Flow
Capacity (mgd)
0.001–0.100 6,112 298
0.101–1.000 7,223 2,750
1.001–10.000 3,525 12,081
10.001–100.000 748 19,873
100.001 and greater 64 15,040
Other
c
2—
Total 17,674 50,042
a
California, Colorado, New York, and South Dakota did not have the resources to complete the updating of
these data.
b
Results presented in this table for American Samoa, Guam, Nevada, Northern Mariana Islands, Puerto Rico,
Virgin Islands, and Wyoming are from the 1996 survey because these States and Territories did not
participate in the CWNS 2000.
c
Flow data for these facilities were unavailable.
Source: From 2000 Clean Watersheds Needs Survey Report to Congress, Published 2003, Appendix C,
Table C.3, p. C.4. www.epa.gov/owm/mtb/cwns/2000rtc/cwns2000-appendix-c.pdf, www.epa.gov/
owm/mtb/cwns/2000rtc/toc.htm.
Table 9A.12 Improvements in Treatment Level of the Nation’s Municipal Wastewater Treatment Facilities
Level of
Treatment
1992 Number of
Facilities
1996 Number of
Facilities
Change
1992–1996 (%)
2000 Number of
Facilities
Change
1992–2000 (%)
Change
1996–2000 (%)
No discharge
a
1,981 2,032 2.6 1,938 K2.2 K4.6
Less than
secondary
b
868 176 K79.7 47 K94.5 K73.3
Secondary 9,086 9,388 3.3 9,156 0.8 K2.5
Greater than
secondary
3,678 4,428 20.4 4,892 33.0 10.5
Total facilities 15,613 16,024 2.6 16,255
c
4.1 1.4
Note: A secondary treatment level is defined as meeting an effluent quality of 30 mg/L for biochemical oxygen demand (BOD) and
suspended solids.
a
No discharge refers to facilities that do not discharge effluent to surface waters (e.g., spray irrigation, groundwater recharge).
b
Includes facilities granted section 301(h) waivers from secondary treatment for discharges to marine waters. As of January 1, 2000,
waivers for 34 facilities in the CWNS 2000 database had been granted or were pending.
c
The number of facilities includes 222 facilities that provide partial treatment and whose flow goes to another facility for further treatment.
Source: From 2000 Clean Watersheds Needs Survey Report to Congress, Published 2003, Table 3.2, p. 3–4. www.epa.gov/
owm/mtb/cwns/2000rtc/toc.htm, www.epa.gov/owm/mtb/cwns/2000rtc/cwns2000-chapter-3.pdf.
THE WATER ENCYCLOPEDIA: HYDROLOGIC DATA AND INTERNET RESOURCES9-10
q 2006 by Taylor & Francis Group, LLC
Table 9A.13 Comparison of Total Needs for the 1992 Needs Survey, 1996 Clean Water Needs Survey, and CWNS 2000 (January
2000 Dollars in Billions)
Needs Category 1992
a
1996
a
2000
Publicly Owned Wastewater Treatment and Collection Systems and Storm Water Management Programs
I Secondary wastewater treatment 39.3 29.4 36.8
II Advanced wastewater treatment 19.4 19.4 20.4
III-A Infiltration/inflow correction 3.4 3.7 8.2
III-B Sewer replacement/rehabilitation 4.6 7.7 16.8
IV-A New collector sewers and
appurtenances
22.5 12.0 14.3
IV-B New interceptor sewers and
appurtenances
18.4 11.9 14.8
V Combined sewer overflow correction 51.7
b
49.6 50.6
VI Storm water management programs 0.1
b
8.2
b
5.5
Nonpoint Source Pollution Control Projects
VII-A Agriculture (cropland) 4.7
b
4.2
b
0.5
VII-B Agriculture (animals) 3.4
b
2.3
b
0.7
VII-C Silviculture 3.0
b
3.9
b
0.04
VII-D Urban — 1.1 4.4
VII-E Groundwater protection: unknown
source
1.4 1.1 0.9
Estuaries
c
0.01 0.04 —
Wetlands
c
0.04 0.01 —
VII-F Marinas — — 0.002
VII-G Resource extraction — — 0.04
VII-H Brownfields — — 0.4
VII-I Storage tanks — — 1.0
VII-J Sanitary landfills — — 1.8
VII-K Hydromodification — — 4.1
Total needs 172.0 154.6 181.2
Treatment categories I and II only 58.7 48.8 57.2
Collection and conveyance categories
III and IV only
48.9 35.3 54.1
Category I to V subtotal 159.3 133.7 161.9
a
The needs from 1992 and 1996 were inflated to January 2000 dollars for comparison with CWNS 2000 data.
b
Modeled needs.
c
Documented needs for estuaries and wetlands were provided by States during the 1992 and 1996 surveys, but they are no longer
reported as individual categories.
Source: From 2000 Clean Watersheds Needs Survey Report to Congress, Published 2003, Table 3.4, p. 3–6. www.epa.gov/
owm/mtb/cwns/2000rtc/toc.htm, www.epa.gov/owm/mtb/cwns/2000rtc/cwns2000-chapter-3.pdf.
WASTEWATER 9-11
q 2006 by Taylor & Francis Group, LLC
Table 9A.14 Number of Treatment Facilities by Level of Treatment
Treatment Facilities in Operation in 2000
a,b
Level of Treatment Number of Facilities
Present Design
Capacity (mgd)
Number of People
Served
Percent of U.S.
Population
Less than secondary
c
47 1,023 6,426,062 2.3
Secondary 9,156 19,268 88,221,896 32.0
Greater than secondary 4,892 22,165 100,882,207 36.6
No discharge
d
1,938 2,039 12,283,047 4.5
Partial treatment
e
222 563 — —
Total 16,255 45,058 207,813,212
f
75.4
Treatment Facilities in Operation in 2000 if All Documented Needs Are Met
a,b
Level of Treatment Number of Facilities
Future Design
Capacity (mgd)
Number of People
Served
Percent of U.S.
Population
Less than secondary
c
27 481 3,851,000 1.2
Secondary 9,463 20,008 103,716,058 31.9
Greater than secondary 5,739 26,239 140,251,554 43.2
No discharge
d
2,221 2,579 21,224,596 6.5
Partial treatment
e
224 734 — —
Total 17,674 50,041 269,043,208
f
82.8
a
California, Colorado, New York, and South Dakota did not have the resources to complete the updating of these data.
b
Results presented in this table for American Samoa, Guam, Nevada, Northern Mariana Islands, Puerto Rico, Virgin Islands, and
Wyoming are from the 1996 survey because these States and Territories did not participate in the CWNS 2000.
c
Less-than-secondary facilities include facilities granted or pending section 301(h) waivers from secondary treatment for discharges to
marine waters.
d
No-discharge facilities do not discharge treated wastewater to the Nation’s waterways. These facilities dispose of wastewater via
methods such as industrial reuse, irrigation, or evaporation.
e
These facilities provide some treatment to wastewater and discharge their effluents to wastewater facilities for further treatment and
discharge.
f
This table does not include the results for approximately 3.3 million people (present) and 3.5 million people (future) that are receiving
centralized collection because the data related to flow and effluent levels were not complete for the CWNS 2000.
Source: From 2000 Clean Watersheds Needs Survey Report to Congress, Published 2003, Appendix C, Table C.4, p. C.5.
www.epa.gov/owm/mtb/cwns/2000rtc/cwns2000-appendix-c.pdf, www.epa.gov/owm/mtb/cwns/2000rtc/toc.htm.
THE WATER ENCYCLOPEDIA: HYDROLOGIC DATA AND INTERNET RESOURCES9-12
q 2006 by Taylor & Francis Group, LLC
Table 9A.15 Clean Watersheds Needs Survey 2000 Total Needs (January 2000 Dollars in Millions)
Category of Need
State Total I II III-A III-B IV-A IV-B V VI VII Total (I–V)
Alabama 2,720 14 951 135 1,168 386 66 0 0 0 2,720
Alaska 560 306 7 7 65 163 7 5 0 0 560
Arizona 6,199 726 2,368 126 240 319 1,081 0 1,251 88 4,860
Arkansas 500 37 117 22 24 41 71 0 0 188 312
California 14,402 3,916 3,748 111 3,114 82 1,853 426 352 800 13,250
Colorado 1,340 183 812 5 179 16 37 9 48 51 1,241
Connecticut 2,349 399 923 85 16 170 161 500 0 95 2,254
Delaware 288 33 23 0 68 58 4 102 0 0 288
District of Columbia 1,478 305 37 14 64 0 0 1,019 37 2 1,439
Florida 9,966 299 2,853 129 562 1,191 1,012 0 680 3,240 6,046
Georgia 2,336 114 205 1,004 25 9 61 918 0 0 2,336
Hawaii 1,743 575 19 471 441 88 149 0 0 0 1,743
Idaho 207 119 29 3 18 18 20 0 0 0 207
Illinois 11,888 795 103 27 1,204 95 169 9,450 0 45 11,843
Indiana 7,222 626 171 65 419 291 176 5,468 0 6 7,216
Iowa 1,954 240 22 23 79 36 19 1,534 1 0 1,953
Kansas 1,419 373 100 213 2 65 270 396 0 0 1,419
Kentucky 2,797 654 101 193 280 756 592 217 3 1 2,793
Louisiana 2,370 410 146 1,167 216 240 189 0 0 2 2,368
Maine 1,102 176 7 3 31 88 16 653 0 128 974
Maryland 4,779 1,239 837 94 739 407 369 396 456 242 4,081
Massachusetts 4,675 874 249 59 92 662 406 2,324 0 9 4,666
Michigan 4,092 837 73 107 307 301 30 2,437 0 0 4,092
Minnesota 2,319 660 101 42 281 45 104 6 120 960 1,239
Mississippi 856 92 129 156 152 184 143 0 0 0 856
Missouri 4,998 725 22 720 297 301 193 1,180 0 1,560 3,438
Montana 516 170 70 14 55 100 60 0 0 47 469
Nebraska 1,194 149 56 7 11 11 75 861 24 0 1,170
Nevada NR NR NR NR NR NR NR NR NR NR NR
New Hampshire 906 127 47 7 33 6 135 485 0 66 840
New Jersey 12,827 2,818 368 339 610 1,007 411 4,385 89 2,800 9,938
New Mexico 206 94 15 9 42 18 21 0 0 7 199
New York 20,422 9,853 776 75 2,072 538 173 5,497 16 1,422 18,984
North Carolina 5,927 423 1,737 291 205 1,725 1,535 3 1 7 5,919
North Dakota 52 27 0
a
217 0 1 04 1 47
Ohio 8,722 1,219 391 1,493 112 725 533 3,623 0 626 8,096
(Continued)
WASTEWATER 9-13
q 2006 by Taylor & Francis Group, LLC
Table 9A.15 (Continued)
Category of Need
State Total I II III-A III-B IV-A IV-B V VI VII Total (I–V)
Oklahoma 586 85 25 1 207 33 45 0 190 0 396
Oregon 1,477 540 155 4 654 16 34 74 0 0 1,477
Pennsylvania 8,060 845 204 121 119 963 197 5,431 17 163 7,880
Rhode Island 1,415 109 113 12 52 345 119 633 0 32 1,383
South Carolina 1,309 551 334 1 13 283 125 0 0 2 1,307
South Dakota 142 16 29 0 44 13 6 2 14 18 110
Tennessee 604 66 45 48 107 58 36 244 0 0 604
Texas 9,152 2,009 813 235 1,323 616 1,890 0 2,225 41 6,886
Utah 848 347 74 0
a
97 98 217 0 5 10 833
Vermont 144 45 32 0
a
0
a
33 2 31 0 1 143
Virginia 3,519 727 777 111 358 516 570 460 0 0 3,519
Washington 2,744 1,000 52 226 136 198 521 608 0 3 2,741
West Virginia 2,529 298 12 134 47 691 478 869 0 0 2,529
Wisconsin 3,338 588 141 54 365 260 462 342 16 1,110 2,212
Wyoming NR NR NR NR NR NR NR NR NR NR NR
American Samoa NR NR NR NR NR NR NR NR NR NR NR
Guam NR NR NR NR NR NR NR NR NR NR NR
N. Mariana Islands NR NR NR NR NR NR NR NR NR NR NR
Puerto Rico NR NR NR NR NR NR NR NR NR NR NR
Virgin Islands NR NR NR NR NR NR NR NR NR NR NR
Total 181,198 36,833 20,419 8,165 16,762 14,265 14,844 50,588 5,549 13,773 161,876
Categories
I Secondary wastewater treatment III-B Sewer replacement/rehabilitation V Combined sewer overflow correction
II Advanced wastewater treatment IV-A New collector sewers and appurtenances VI Storm water management programs
III-A Infiltration/inflow correction IV-B New interceptor sewers and
appurtenances
VII NPS pollution control (see Table A.2
for totals by subcategory)
Note: NR, not reported. American Samoa, Guam, Nevada, Northern Mariana Islands, Puerto Rico, Virgin Islands, and Wyoming did not participate in the CWNS 2000.
a
Estimate is less than $0.5 million.
Source: From 2000 Clean Watersheds Needs Survey Report to Congress, Published 2003, Appendix A, Table A.1, p. A.2 and A.3. www.epa.gov/owm/mtb/cwns/2000rtc/toc.htm,
www.epa.gov/owm/mtb/cwns/2000rtc/cwns2000-appendix-a.pdf.
THE WATER ENCYCLOPEDIA: HYDROLOGIC DATA AND INTERNET RESOURCES9-14
q 2006 by Taylor & Francis Group, LLC
Table 9A.16 Number of Treatment Facilities and Population Served Per State by Level of Treatment for Year 2000
Number of Facilities Providing Listed Effluent Level Population Served by Listed Effluent Level
State
Less than
Secondary
a
Secondary
Greater
than
Secondary
No
Discharge
b
Less than
Secondary
a
Secondary
Greater
than
Secondary
No
Discharge
b
Alabama 0 130 129 8 0 732,009 1,994,219 7,593
Alaska 5 30 0 9 207,994 108,879 0 21,920
Arizona 0 17 18 81 0 111,767 2,215,703 1,378,004
Arkansas 0 118 207 9 0 726,471 803,753 12,155
California
c
5 182 77 309 4,198,270 12,159,009 7,919,130 3,577,181
Colorado
c
0 246 38 22 0 1,556,854 2,142,434 7,788
Connecticut 0 49 38 4 0 1,266,574 813,536 1,210
Delaware 0 3 11 4 0 10,476 728,997 13,070
District of
Columbia
d
0 0 1 0 0 0 1,298,601 0
Florida 0 17 84 175 0 238,764 6,155,714 4,931,819
Georgia 0 227 80 35 0 1,721,572 2,594,389 89,249
Hawaii 2 5 2 12 532,378 139,609 20,286 89,512
Idaho 0 107 5 55 0 562,008 265,812 60,303
Illinois 0 415 301 1 0 683,543 9,811,768 572
Indiana 0 125 274 0 0 410,940 3,416,852 0
Iowa 0 707 9 3 0 1,925,926 181,763 1,393
Kansas 0 355 79 197 0 694,512 1,277,425 101,964
Kentucky 0 123 94 0 0 1,242,187 921,134 0
Louisiana 1 184 163 1 3,000 2,268,451 878,478 207
Maine 12 116 2 7 9,303 624,604 16,038 5,956
Maryland 0 75 75 6 0 949,367 2,045,325 3,920
Massachusetts 1 77 35 7 20,074 4,235,095 822,135 17,043
Michigan 0 204 120 68 0 1,254,599 6,161,491 108,121
Minnesota 1 411 100 0 42 967,813 2,073,977 0
Mississippi 0 195 75 1 0 1,139,734 507,809 524
Missouri 0 578 77 21 0 3,757,717 451,630 2,663
Montana 0 107 5 80 0 397,988 89,635 63,564
Nebraska 0 298 19 146 0 977,825 155,078 64,166
Nevada
e
0 44 3 4 0 139,996 252,229 237,442
New Hampshire 1 70 2 10 25,409 555,435 17,890 7,984
New Jersey 0 94 55 1 0 6,762,536 1,090,502 34,307
New Mexico 0 57 1 17 0 898,530 7,150 135,338
New York
c
0 360 178 27 0 11,273,282 3,748,413 116,814
North Carolina 0 313 134 33 0 1,056,606 2,576,092 112,989
North Dakota 0 254 1 27 0 468,946 21,531 5,909
Ohio 0 169 593 2 0 1,401,922 7,404,543 956
Oklahoma 0 249 39 199 0 1,716,478 712,679 151,004
Oregon 1 101 67 37 625 1,333,432 1,219,279 33,050
Pennsylvania 2 360 397 2 1,476 6,237,683 4,157,929 2,314
Rhode Island 0 19 2 0 0 687,805 10,184 0
South Carolina 0 123 53 7 0 1,769,072 549,626 30,628
South Dakota
c
0 234 8 29 0 268,874 164,144 14,467
Tennessee 0 110 130 5 0 1,459,559 1,700,862 4,193
Texas 2 524 661 160 1,070 2,538,924 14,025,086 640,857
Utah 0 49 4 44 0 1,636,148 190,027 134,011
Vermont 0 48 31 2 0 90,497 193,684 722
Virginia 0 157 60 2 0 2,166,150 2,318,144 1,373
Washington 0 201 7 27 0 2,847,237 894,801 31,127
West Virginia 3 142 63 0 2,205 581,527 374,677 0
Wisconsin 0 283 279 26 0 573,346 3,250,360 20,360
Wyoming
e
0 78 3 14 0 244,075 87,923 3,030
American Samoa
e
2 0 0 0 5,511 0 0 0
Guam
e
2 2 0 2 62,639 9,236 0 4,275
N. Mariana
Islands
e
0 2 0 0 0 1,118 0 0
Puerto Rico
e
6 22 2 0 1,336,535 581,405 151,290 0
(Continued)
WASTEWATER 9-15
q 2006 by Taylor & Francis Group, LLC
Table 9A.16 (Continued)
Number of Facilities Providing Listed Effluent Level Population Served by Listed Effluent Level
State
Less than
Secondary
a
Secondary
Greater
than
Secondary
No
Discharge
b
Less than
Secondary
a
Secondary
Greater
than
Secondary
No
Discharge
b
Virgin Islands
e
1 10 1 0 19,531 58,294 50 0
Total 47 9,156 4,892 1,938 6,426,062 88,221,896 100,882,207 12,283,047
a
Less-than-secondary facilities include facilities granted or pending section 301(h) waivers from secondary treatment for discharges to
marine waters.
b
No-discharge facilities do not discharge treated wastewater to the Nation’s waterways. These facilities dispose of wastewater via
methods such as industrial reuse, irrigation, or evaporation.
c
California, Colorado, New York, and South Dakota did not have the resources to complete updating of these data.
d
The reported population served for the District of Columbia includes populations from Maryland and Virginia that receive wastewater
treatment at the Blue Plains facility in the District of Columbia.
e
Results presented in this table for American Samoa, Guam, Northern Mariana Islands, Nevada, Puerto Rico, Virgin Islands, and
Wyoming are from the 1996 survey because these States and Territories did not participate in the CWNS 2000.
Source: From 2000 Clean Watersheds Needs Survey Report to Congress, Published 2003, Appendix C, Table C.7, p. C.10 and C.11.
www.epa.gov/owm/mtb/cwns/2000rtc/cwns2000-appendix-c.pdf, www.epa.gov/owm/mtb/cwns/2000rtc/toc.htm.
Table 9A.17 Typical Wastewater Pollutants of Concern
Pollutant Reason for Concern
Total suspended solids (TSS) and
turbidity (NTU)
In surface waters, suspended solids can result in the development of sludge deposits that
smother benthic macroinvertebrates and fish eggs and can contribute to benthic enrichment,
toxicity, and sediment oxygen demand. Excessive turbidity (colloidal solids that interfere with
light penetration) can block sunlight, harm aquatic life (e.g., by blocking sunlight needed by
plants), and lower the ability of aquatic plants to increase dissolved oxygen in the water
column. In drinking water, turbidity is aesthetically displeasing and interferes with disinfection
Biodegradable organics (BOD) Biological stabilization of organics in the water column can deplete dissolved oxygen in surface
waters, creating anoxic conditions harmful to aquatic life. Oxygen-reducing conditions can
also result in taste and odor problems in drinking water
Pathogens Parasites, bacteria, and viruses can cause communicable diseases through direct/indirect body
contact or ingestion of contaminated water or shellfish. A particular threat occurs when
partially treated sewage pools on ground surfaces or migrates to recreational waters.
Transport distances of some pathogens (e.g., viruses and bacteria) in groundwater or surface
waters can be significant
Nitrogen Nitrogen is an aquatic plant nutrient that can contribute to eutrophication and dissolved oxygen
loss in surface waters, especially in lakes, estuaries, and coastal embayments. Algae and
aquatic weeds can contribute trihalomethane (THM) precursors to the water column that may
generate carcinogenic THMs in chlorinated drinking water. Excessive nitrate-nitrogen in
drinking water can cause methemoglobinemia in infants and pregnancy complications for
women. Livestock can also suffer health impacts from drinking water high in nitrogen
Phosphorus Phosphorus is an aquatic plant nutrient that can contribute to eutrophication of inland and coastal
surface waters and reduction of dissolved oxygen
Toxic organics Toxic organic compounds present in household chemicals and cleaning agents can interfere with
certain biological processes in alternative OWTSs. They can be persistent in groundwater and
contaminate downgradient sources of drinking water. They can also cause damage to surface
water ecosystems and human health through ingestion of contaminated aquatic organisms
(e.g., fish, shellfish)
Heavy metals Heavy metals like lead and mercury in drinking water can cause human health problems. In the
aquatic ecosystem, they can also be toxic to aquatic life and accumulate in fish and shellfish
that might be consumed by humans
Dissolved inorganics Chloride and sulfide can cause taste and odor problems in drinking water. Boron, sodium,
chlorides, sulfate, and other solutes may limit treated wastewater reuse options (e.g.,
irrigation). Sodium and to a lesser extent potassium can be deleterious to soil structure and
SWIS performance
Source: From USEPA, On-Site Wastewater Treatment Systems Manual, Office of Water, Office of Research and Development, EPA,
(EPA/625/R-00/0008), Table 3.16, p. 3–23. www.epa.gov/ord/NRMRL/Pubs/625R00008/625R00008totaldocument.pdf;
Adapted in part from Tchobanoglous and Burton, 1991.
THE WATER ENCYCLOPEDIA: HYDROLOGIC DATA AND INTERNET RESOURCES9-16
q 2006 by Taylor & Francis Group, LLC
Table 9A.18 Wastewater Constituents of Concern and Representative Concentrations in the Effluent of Various Treatment Units
Tank-Based Treatment Unit Effluent Concentrations
Constituents of
Concern
Example Direct or
Indirect Measures
(Units) Domestic STE
a
Domestic STE
with N-Removal
Recycle
b
Aerobic Unit
Effluent
Sand Filter
Effluent
Foam or Textile
Filter Effluent
SWIS Percolate
into Groundwater
at 3 to 5 ft Depth
(% Removal)
Oxygen demand BOD
5
(mg/L) 140–200 80–120 5–50 2–15 5–15 O90
Particulate solids TSS (mg/L) 50–100 50–80 5–100 5–20 5–10 O90
Nitrogen Total N (mg N/L) 40–100 10–30 25–60 10–50 30–60 10–20
Phosphorus Total P (mg P/L) 5–15 5–15 4–10 !1–10
4
5–15
4
0–100
Bacteria (e.g., Clostridium
perfringens, Salmonella
Shigella)
Fecal coliform
(organisms per
100 mL)
10
6
–10
8
10
6
–10
8
10
3
–10
4
10
1
–10
3
10
1
–10
3
O99.99
Virus (e.g., hepatitis, polio,
echo, coxsackie, coliphage)
Specific virus
(pfu/mL)
0–10
5
(episodically
present at high
levels)
0–10
5
(episodically
present at high
levels)
0–10
5
(episodically
present at high
levels)
0–10
5
(episodically
present at high
levels)
0–10
5
(episodically
present at high
levels)
O99.9%
Organic chemicals (e.g.,
solvents, petrochemicals,
pesticides)
Specific organics or
totals (mg/L)
0 to trace levels (?) 0 to trace levels (?) 0 to trace levels (?) 0 to trace levels (?) 0 to trace levels (?) O99%
Heavy metals (e.g., Pb, Cu,
Ag, Hg)
Individual metals
(mg/L)
0 to trace levels 0 to trace levels 0 to trace levels 0 to trace levels 0 to trace levels O99%
a
Septic tank effluent (STE) concentrations given are for domestic wastewater. However, restaurant STE is markedly higher particularly in BOD, COD, and suspended solids while
concentrations in graywater STE are noticeably lower in total nitrogen.
b
N-removal accomplished by recycling STE through a packed bed for nitrification with discharge into the influent end of the septic tank for denitrification.
Source: From Van Cuyk, S.M., R.L. Siegrist, and A.L. Logan. 2001. Evaluation of virus and microbiological purification in wastewater soil absorption systems using multicomponent surrogate
and tracer additions. On-Site Wastewater Treatment: Proceedings of the Ninth National Symposium on Individual and Small Community Sewage Systems. American Society of
Agricultural Engineers, St. Joseph, MI; USEPA, On-Site Wastewater Treatment Systems Manual, Office of Water, Office of Research and Development, EPA (EPA/625/
R-00/0008), Table 3.19, p. 3–29. www.epa.gov/ord/NRMRL/Pubs/625R00008/625R00008totaldocument.pdf.
WASTEWATER 9-17
q 2006 by Taylor & Francis Group, LLC
Table 9A.19 Proposed On-Site System Treatment Performance Standards in Various Control Zones
Standard
BOD
(mg/L)
TSS
(mg/L)
PO P
(mg/L)
NH N
(mg/L)
N03-N
(mg/L)
Total N
(% Removed)
a
Fecal Coliforms
(CFU/1,000 mL)
b
T81—primary treatment
T81u—unfiltered 300 300 15 80 NA NA 10,000,000
T811—filtered 200 80 15 80 NA NA 10,000,000
T82—secondary treatment 30 30 15 10 NA NA 50,000
T83—tertiary treatment 10 10 15 10 NA NA 10,000
T84—nutrient reduction
T84n—nitrogen reduction 10 10 15 5 NA 50 10,000
T84p—phosphorus
reduction
10 10 2 10 NA 25 10,000
T84np—N & P reduction 10 10 2 5 NA 50 10,000
T85—bodily contact
disinfection
10 10 15 10 NA 25 200
T86—wastewater reuse 5 5 15 5 NA 50 14
T87—near drinking water 5 5 1 5 10 75 !1b
Note: NA, not available.
a
Minimum percentage reduction of total nitrogen (as nitrate-nitrogen plus ammonium nitrogen) concentration in the raw, untreated wastewater.
b
Total coliform colony densities !50 per 100 mL of effluent.
Source: From Hoover, M.T., A. Arenovski, D. Daly, and D. Lindbo. 1998. A risk-based approach to on-Site system siting, design and management. In On-Site Wastewater Treatment.
Proceedings of the Eighth National Symposium on Individual and Small Community Sewage Systems. American Society of Agricultural Engineers, St. Joseph, MI; USEPA, On-Site
Wastewater Treatment Systems Manual, Office of Water, Office of Research and Development, EPA, (EPA/625/R-00/0008), Table 3.27, p. 3–48. www.epa.gov/ord/NRMRL/
Pubs/625R00008/625R00008totaldocument.pdf.
THE WATER ENCYCLOPEDIA: HYDROLOGIC DATA AND INTERNET RESOURCES9-18
q 2006 by Taylor & Francis Group, LLC
Table 9A.20 Typical Wastewater Constituent Data for Various Countries
Country/ Constituent BOD, g/capita d TSS, g/capita d TKN, g/capita d NH
3
-N, g/capita d Total P, g/capita d
Brazil 55–68 55–68 8–14 ND 0.6–1
Denmark 55–68 82–96 14–19 ND 1.5–2
Egypt 27–41 41–68 8–14 ND 0.4–0.6
Germany 55–68 82–96 11–16 ND 1.2–1.6
Greece 55–60 ND ND 8–10 1.2–1.5
India 27–41 ND ND ND ND
Italy 49–60 55–82 8–14 ND 0.6–1
Japan 40–45 ND 1–3 ND 0.15–0.4
Palestine
a
32–68 52–72 4–7 3–5 0.4–0.7
Sweden 68–82 82–96 11–16 ND 0.8–1.2
Turkey 27–50 41–68 8–14 9–11 0.4–2
Uganda 55–68 41–55 8–14 ND 0.4–0.6
United States
b
50–120 60–150 9–22 5–12 2.7–4.5
a
West Bank and Gaza Strip.
b
From Table 3.11.
Source: From Metcalf & Eddy, Inc., McGraw-Hill, Wastewater Engineering Treatment and Reuse, Fourth Edition, 2003, Table 3.14,
p. 184. With permission. Adapted from Henze et al. (1997), Ozturk et al. (1992), Andreadakis (1992), and Nashashibi and van
Duijl (1995).
WASTEWATER 9-19
q 2006 by Taylor & Francis Group, LLC
SECTION 9B CENTRALIZED WASTEWATER TREATMENT
Table 9B.21 Gravity Sewer Average Design Flows for Development Types
Type of Development Design Flow (GPD)
Residential
General 100/person
Single family 370/residence
Townhouse unit 300/unit
Apartment unit 300/unit
Commercial
General 2,000/acre
Motel 130/unit
Office 20/employee
0.20/net sq.ft
Industrial (varies with type of industry)
General 10,000/acre
Warehouse 600/acre
School site (general) 16/student
Source: From Darby, 1995; USEPA, Collection Systems Technology Fact Sheet, Sewers,
Conventional Gravity, Office of Water, Municipal Technology Branch, Table 1,
(EPA/823/F-02/007), September 2002. epa.gov/owm/mtb/congrasew.pdf.
Table 9B.22 Minimum Slope for Gravity Sewers
Nominal Sewer Size
Minimum Slope (in ft per
100 ft Im/100 m)
8 in. (200 mm) 0.40
10 in. (250 mm) 0.28
12 in. (300 mm) 0.22
14 in. (350 mm) 0.17
15 in. (375 mm) 0.15
16 in. (400 mm) 0.14
18 in. (450 mm) 0.12
21 in. (525 mm) 0.10
24 in. (600 mm) 0.08
27 in. (675 mm) 0.067
30 in. (750 mm) 0.058
33 in. (825 mm) 0.052
36 in. (900 mm) 0.046
39 in. (975 mm) 0.041
42 in. (1,050 mm) 0.037
Source: From Board of State and Provincial Public Health and
Environmental Managers, Health Education Services
Division, Recommended Standards for Wastewater Facili-
ties, 2004 Edition. hes.org.
Table 9B.23 Force Main Capacity
VelocityZ2 fps VelocityZ4 fps VelocityZ6 fps
Diameter (in.) gpm lps gpm lps gpm lps
6 176 11 362 22 528 33
8 313 20 626 40 626 60
10 490 31 980 62 1,470 93
18 1,585 100 3,170 200 4,755 300
24 2,819 178 5,638 356 8,457 534
36 6,342 400 12,684 800 19,026 1,200
Source: From Metcalf and Eddy, 1981; USEPA, Wastewater Technology Fact Sheet Sewers, Force Main, Office of
Water, Municipal Technology Branch, Table 2 (EPA /823/f-00/071), September 2000. epa.gov/own/mtb/
force_main_sewers.pdf.
THE WATER ENCYCLOPEDIA: HYDROLOGIC DATA AND INTERNET RESOURCES9-20
q 2006 by Taylor & Francis Group, LLC
Table 9B.24 Common Sewer Cleaning Methods
Technology Uses and Applications
Mechanical
Rodding Uses an engine and a drive unit with continuous rods or sectional rods. As blades rotate
they break up grease deposits, cut roots, and loosen debris
Rodders also help thread the cables used for TV inspections and bucket machines
Most effective in lines up to 300 mm (12 in.) in diameter
Bucket machine Cylindrical device, closed on one end with 2 opposing hinged jaws at the other
Jaws open and scrape off the material and deposit it in the bucket
Partially removes large deposits of silt, sand, gravel, and some types of solid waste
Hydraulic
Balling A threaded rubber cleaning ball that spins and scrubs the pipe interior as flow increases
in the sewer line
Removes deposits of settled inorganic material and grease build-up
Most effective in sewers ranging in size from 13 to 60 cm (5–24 in.)
Flushing Introduces a heavy flow of water into the line at a manhole. Removes floatables and
some sand and grit
Most effective when used in combination with other mechanical operations, such as
rodding or bucket machine cleaning
Jetting Directs high velocities of water against pipe walls. Removes debris and grease build-up,
clears blockages, and cuts roots within small diameter pipes
Efficient for routine cleaning of small diameter, low flow sewers
Technology Applications
Scooter Round, rubber-rimmed, hinged metal shield that is mounted on a steel framework on
small wheels. The shield works as a plug to build a head of water
Scours the inner walls of the pipe lines
Effective in removing heavy debris and cleaning grease from line
Kites, bags, and poly pigs Similar in function to the ball
Rigid rims on bag and kite induce a scouring action
Effective in moving accumulations of decayed debris and grease downstream
Silt traps Collect sediments at convenient locations
Must be emptied on a regular basis as part of the maintenance program
Grease traps and sand/oil interceptors The ultimate solution to grease build-up is to trap and remove it
These devices are required by some uniform building codes and/or sewer-use
ordinances. Typically sand/oil interceptors are required for automotive business
discharge
Need to be thoroughly cleaned to function properly
Cleaning frequency varies from twice a month to once every 6 months, depending on
the amount of grease in the discharge
Need to educate restaurant and automobile businesses about the need to maintain
these traps
Chemicals
Before using these chemicals review
the material safety data sheets
(MSDS) and consult the local
authorities on the proper use of
chemicals as per local ordinance and
the proper disposal of the chemicals
used in the operation. If assistance or
guidance is needed regarding the
application of certain chemicals,
contact the U.S. EPA or state water
pollution control agency
Used to control roots, grease, odors (H
2
S gas), concrete corrosion, rodents and
insects
Root control — Longer lasting effects than power rodder (approximately 2–5 years)
H
2
S gas — Some common chemicals used are chlorine (Cl
2
), hydrogen peroxide
(H
2
O
2
), pure oxygen (O
2
), air, lime (Ca(OH
2
)), sodium hydroxide (NaOH), and iron
salts
Grease and soap problems — Some common chemicals used are bioacids,
digester, enzymes, bacteria cultures, catalysts, caustics, hydroxides, and
neutralizers
Source: From information provided by Arbour and Kerri, 1997 and Sharon, 1989; USEPA, Collection Systems, O&M Fact Sheet, Sewer
Cleaning and Inspection, Office of Water, Municipal Technology Branch, Table 1 (EPA/823/f-99/031), September 1999.
www.epa.gov/owm/mtb/sewcl.pdf.
WASTEWATER 9-21
q 2006 by Taylor & Francis Group, LLC
Table 9B.26 Limitations of Standard Inspection Techniques for Sewer Lines
Inspection Technique Limitations
Visual inspection In smaller sewers, the scope of problems detected is minimal because the only portion of the
sewer that can be seen in detail is near the manhole. Therefore, any definitive information on
cracks or other structural problems is unlikely. However, this method does provide information
needed to make decisions on rehabilitation
Camera inspection When performing a camera inspection in a large diameter sewer, the inspection crew is
essentially taking photographs haphazardly, and as a result, the photographs tend to be less
comprehensive
Closed circuit television (CCTV) This method requires late night inspection and as a result the TV operators are vulnerable to
lapses in concentration. CCTV inspections are also quite expensive and time-consuming
Lamping inspection The video camera does not fit into the pipe and during the inspection it remains only in the
maintenance hole. As a result, only the first 10 ft of the pipe can be viewed or inspected using
this method
Source: From Water Pollution Control Federation, 1989; USEPA, Collection Systems, O&M Fact Sheet, Sewer Cleaning and Inspection,
Office of Water, Municipal Technology Branch, Table 3 (EPA/823/F-99/031), September 1999. www.epa.gov/owm/mtb/-
sewcl.pdf.
Table 9B.27 Limitations of Cleaning Methods for Sewer Lines
Cleaning Method Limitations
Balling, jetting, scooter In general, these methods are only successful when necessary water pressure or head is maintained
without flooding basements or houses at low elevations. Jetting—The main limitation of this
technique is that caution needs to be used in areas with basement fixtures and in steep-grade hill
areas. Balling—Balling cannot be used effectively in pipes with bad offset joints or protruding service
connections because the ball can become distorted
Scooter—When cleaning larger lines, the manholes need to be designed to a larger size in order to
receive and retrieve the equipment. Otherwise, the scooter needs to be assembled in the manhole.
Caution also needs to be used in areas with basement fixtures and in steep-grade hill areas
Bucket, machine This device has been known to damage sewers. The bucket machine cannot be used when the line is
completely plugged because this prevents the cable from being threaded from one manhole to the
next. Set-up of this equipment is time-consuming
Flushing This method is not very effective in removing heavy solids. Flushing does not remedy this problem
because it only achieves temporary movement of debris from one section to another in the system
High velocity cleaner The efficiency and effectiveness of removing debris by this method decreases as the cross-sectional
areas of the pipe increase. Backups into residences have been known to occur when this method
has been used by inexperienced operators. Even experienced operators require extra time to clear
pipes of roots and grease
Kite or bag When using this method, use caution in locations with basement fixtures and steep-grade hill areas
Rodding Continuous rods are harder to retrieve and repair if broken and they are not useful in lines with a
diameter of greater than 300 mm (0.984 ft) because the rods have a tendency to coil and bend. This
device also does not effectively remove sand or grit, but may only loosen the material to be flushed
out at a later time
Source: From USEPA, 1993; USEPA, Collection Systems, O&M Fact Sheet, Sewer Cleaning and Inspection, Office of Water, Municipal
Technology Branch, Table 4 (EPA/823/F-99/031), September 1999. www.epa.gov/owm/mtb/sewcl.pdf.
Table 9B.25 Frequency of Maintenance Activities for Sewer Lines
Activity Average (% of system/year)
Cleaning 29.9
Root removal 2.9
Manhole inspection 19.8
CCTV inspection 6.8
Smoke testing 7.8
Source: From ASCE, 1998; USEPA, Collection Systems, O&M Fact Sheet, Sewer
Cleaning and Inspection, Office of Water, Municipal Technology Branch,
Table 2 (EPA/823/f-99/031), September 1999. www.epa.gov/owm/mtb/
sewcl.pdf.
THE WATER ENCYCLOPEDIA: HYDROLOGIC DATA AND INTERNET RESOURCES9-22
q 2006 by Taylor & Francis Group, LLC
Table 9B.28 Comparison of Various Sewer Rehabilitation Techniques
Method Diameter Range (mm)
Maximum
Installation (m) Liner Material
In-line expansion Pipe bursting 100–600 (4–24 in.) 230 (750 ft) PE, PP, PVC, GRP
Sliplining Segmental 100–4,000 (4–158 in.) 300 (1,000 ft) PE, PP, PVC, GRP
(KEP & KUP)
Continuous 100–1,600 (4–63 in.) 300 (1,000 ft) PE, PP, PE/EPDM, PVC
Spiral wound 150–2,500 (6–100 in.) 300 (1,000 ft) PE, PVC, PP, PVDF
Cured-in-place Inverted-in-place 100–2,700 (4–108 in.) 900 (3,000 ft) Thermoset
Product linings Resin/fabric composite
Winched-in-place 100–1,400 (4–54 in.) 150 (500 ft) Thermoset resin/fabric
composite
Spray-on-linings 76–4,500 (3–180 in.) 150 (500 ft) Epoxy resins/cement
mortar
Modified cross-sectional
methods
Fold and form 100–400 (4–15 in.) 210 (700 ft) PVC
Deformed/reformed 100–400 (4–15 in.) 800 (2,500 ft) (Thermoplastics) HDPE
(thermoplastics)
Drawdown 62–600 (3–24 in.) 300 (1,000 ft) HDPE, MDPE
Rolldown 62–600 (3–24 in.) 300 (1,000 ft) HDPE, MDPE
Thin-walled lining 500–1,100 (20–46 in.) 960 (3,000 ft) HDPE
Internal point Robotic repair 200–760 (8–30 in.) N/A Exopy resins
Repair Cement mortar
Grouting/sealing & spray-on N/A N/A Chemical grouting
Link seal 100–600 (4–24 in.) N/A Special sleeves
Point CIPP 100–600 (4–24 in.) 15 (50 ft) Fiberglass/polyester,
etc
Note: Spiral wound sliplining, robotic repair, and point CIPP can only be used only with gravity pipeline. All other methods can be used with
both gravity and pressure pipeline. EPDM, ethylene polypelene diene monomer; GRP, glassfiber reinforced polyester; HDPE, high
density polyethylene; MDPE, medium density polyethylene; PE, polyethylene; PP, polypropylene; PVC, poly vinyl chloride; PVDF,
poly vinylidene chloride.
Source: From Iseley and Najafi (1995); USEPA, Collection Systems, O&M Fact Sheet, Trenchless Sewer Rehabilitation, Office of Water,
Municipal Technology Branch, Table 1 (EPA/823/F-99/0032), September 1999. www.epa.gov/owm/mtb/rehabl.pdf.
Table 9B.29 Limitations of Trenchless Sewer Rehabilitation Techniques
Method Limitations
Pipe bursting Bypass or diversion of flow required
Insertion pit required
Percussive action can cause significant ground
movement may not be suitable for all materials
Sliplining Insertion pit required
Reduces pipe diameter
Not well suited for small diameter pipes
CIPP Bypass or diversion of flow required
Curing can be difficult for long pipe segments
Must allow adequate curing time
Defective installation may be difficult to rectify
Resin may clump together on bottom of pipe
Reduces pipe diameter
Modified cross section Bypass or diversion of flow required
The cross section may shrink or unfold after expansion
Reduces pipe diameter
Infiltration may occur between liner and host pipe unless
sealed
Liner may not provide adequate structural support
Source: From USEPA, Collection Systems, O&M Fact Sheet, Trenchless Sewer Rehabilitation, Office of
Water, Municipal Technology Branch, Table 2 (EPA/823/F-99/0032), September 1999.
www.epa.gov/owm/mtb/rehabl.pdf.
WASTEWATER 9-23
q 2006 by Taylor & Francis Group, LLC
Table 9.31 Design Parameters for Static Screens
Hydraulic loading, gal/min/ft of width 100–180
Incline of screens, degrees from vertical
a
35
Slot space, mm 250–1,600
Automatic controls None
Note: gal/min/ft ! 0.207Z l/m/s.
a
Bauer Hydrasievese have 3-stage slopes on each screen: 258,358,458.
Source: From USEPA, Combined Sewer Overflow, Technology Fact Sheet, Screens
Office of Water, Municipal Technology Brach, Table 1 (EPA/823/F/F-99/040),
September 1999. www.epa.gov/own/mtb/screens.pdf.
Table 9B.30 Characteristics of Common Force Main Pipe Materials
Material Application Key Advantages Key Disadvantages
Cast or ductile iron, cement lined High pressure available
sizes of 4–54 in.
Good resistance to pressure
surges
More expensive than
concrete and fiberglass
Steel, cement lined High pressure all pipe sizes Excellent resistance to
pressure surges
More expensive than
concrete and fiberglass
Asbestos cement Moderate pressure for
36-in. C pipe sizes
No corrosion slow grease
buildup
Relatively brittle
Fiberglass reinforced epoxy pipe Moderate pressure for up to
36-in. pipe sizes
No corrosion slow grease
buildup
350 psi max pressure
Plastic Low pressure for up to 36-in.
pipe sizes
No corrosion slow grease
buildup
Suitable for small pipe sizes
and low pressure only
Source: From Sanks, 1998; USEPA, Wastewater Technology Fact Sheet Sewers, Force Main, Office of Water, Municipal Technology
Branch, Table 1 (EPA/823/F-99/040), September 1999. www.epa.gov/owm/mtb/force_main_sewers.pdf.
Table 9B.32 Design Parameters for Drum Screens and Rotary Screen
Parameter Drum/Band Screen Rotary Screen
Screen spacing, mm 100–420 74–167
105 recommended
Screen material Stainless steel or plastic Stainless steel or plastic
Drum speed, r/min
Speed range 2–7 30–65
Recommended speed 5 55
Peripheral speed, ft/s 14–16
Submergence of drum, % 60–70
Flux density, gal/ft
2
/min of
submergence screen
20–50 70–150
Hydraulic efficiency, % of inflow 75–90
Headloss, in. 6–24
Backwash
Volume, % of inflow 0.5–3 0.02–2.5
Pressure, lb/in.
2
30–50 50
Note: gal/ft
2
/min ! 2.44Z m
3
/h/m
2
in. ! 2.54Z cm ft ! 0.305Z cm; lb/in.
2
! 0.0703Z kg/cm
2
.
Source: From USEPA, Combined Sewer Overflow, Technology Fact Sheet, Screens Office of Water, Municipal Tech-
nology Brach, Table 2 (EPA/823/F/F-99/040), September 1999. www.epa.gov/owm/mtb/screens.pdf.
THE WATER ENCYCLOPEDIA: HYDROLOGIC DATA AND INTERNET RESOURCES9-24
q 2006 by Taylor & Francis Group, LLC
Table 9B.33 Typical Design Parameters for Package Plant
Extended Aeration SBR Oxidation Ditch
BOD
5
loading (F:M) (lb BOD
5
/lb MLVSS) 0.05–0.15 0.05–0.30 0.05–0.30
Oxygen required avg. at 20 8C (lb/lb BOD
5
applied) 2–3 2–3 2–3
Oxygen required peak at 20 8C (value ! avg. flow) 1.5–2.0 1.25–2.0 1.5–2.0
MLSS (mg/L) 3,000–6,000 1,500–5,000 3,000–6,000
Detention time (hours) 18–36 16–36 18–36
Volumetric Loading (lb BOD
5
/d/10
3
cu ft) 10–25 5–15 5–30
Source: Adapted from Metcalf and Eddy, 1991 and WEF, 1998; USEPA, Wastewater Technology Fact Sheet, Package Plants,
Office of Water, Municipal Technology Branch, Table 1 (EPA/823/F-00/016) September 2000. www.epa.gov/owm/mtb/
package_plant.pdf.
Table 9B.34 Extended Aeration Performance
Typical Effluent Quality
Aldie WWTP
(Monthly Average)
BOD (mg/L) !30 or !10 5
TSS (mg/L) !30 or !10 17
TP (mg/L) !2
ab
NH
3
-N (mg/L) !2
b
a
May require chemicals to achieve.
b
DEQ does not require monitoring of these parameters.
Source: From Sloan, 1999 and Broderick, 1999; USEPA, Wastewater Technology Fact Sheet,
Package Plants, Office of Water, Municipal Technology Brach, Table 1 (EPA/823/F-00/016)
September 2000. www.epa.gov/owm/mtb/package_plant.pdf.
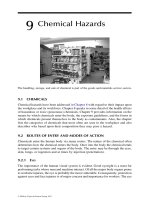
Influent
Screening/
grinding
SBR Disinfection
Effluent
Digestion
To solids handling,
disposal, or
beneficial reuse
Thickening
Equalization Filtration
Figure 9B.3 Sequencing batch reactors key design parameters for a conventional load. (From USEPA, Wastewater Technology
Fact Sheet, Sequencing Batch Reactors, Office of Water, Municipal Technology Branch, Figure 1 (EPA/823/F-99/073) September 1999.
www.epa.gov/owm/mtb/sbr_new.pdf.)
WASTEWATER 9-25
q 2006 by Taylor & Francis Group, LLC