The Water Encyclopedia: Hydrologic Data and Internet Resources - Chapter 10 ppsx
Bạn đang xem bản rút gọn của tài liệu. Xem và tải ngay bản đầy đủ của tài liệu tại đây (6.36 MB, 366 trang )
CHAPTER 10
Environmental Problems
Katherine L. Thalman
CONTENTS
Section 10A Pollution Sources and Pathways . . . . 10-2
Section 10B Surface Water Pollution . . . 10-7
Section 10C Groundwater Contamination . . . . . . 10-121
Section 10D Solid Waste. . . . 10-160
Section 10E Agricultural Activities 10-179
Section 10F Urban Runoff/Deicing Materials. . . . 10-277
Section 10G Air Emissions/Acid Rain/Sea Level Rise . 10-280
Section 10H Offshore Waste Disposal . . 10-309
Section 10I Energy Development . 10-312
Section 10J Waterborne Diseases/Health Hazards 10-316
10-1
q 2006 by Taylor & Francis Group, LLC
SECTION 10A POLLUTION SOURCES AND PATHWAYS
Dry
soil
Water
Water
Moisture
Moisture
Moisture Atmosphere (particles)
Atmosphere (vapor)
Filter/
bottom feeder
Groundwater
Water
Water
Fish
Foliage
Animal
Man
Plant crop
Root crop
Hydro soil
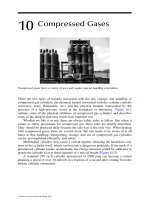
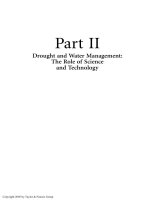
Figure 10A.1 Pollutant pathways from soil to man. (From Dacre, I.C., Rosenblatt, D.H., and Cogley, D.R., 1980, Preliminary Pollutant
Limit Values for Human Health Effects, Environmental Technology 14: 778–783, Copyright American Chemical Society,
Washington, DC.)
Climate change
Pathogens
Pesticides
Algal toxins
Acidification
Global trends
Genetically
modified
organisms
Nutrients
Municipal
wastewater
Industrial
discharges
Persisent
organic
pollutants
Endocrine
disrupting
substances
Landfills and
Waste Disposal
Natural
sources
Urban
runoff
Agricultural/Forestry
land use
SOURCES
CONTAMINANTS
WATER QUANTITY
IMPACTS
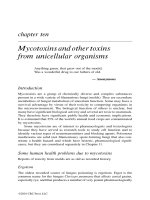
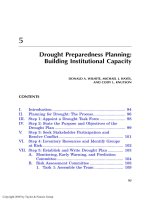
Figure 10A.2 Threats to water sources. (From Threats to Sources of Drinking Water and Aquatic Ecosystem Health in Canada, page x,
Environment Canada, 2001. Reproduced with permission from the National Water Research Institute, Environment
Canada, 2006.)
THE WATER ENCYCLOPEDIA: HYDROLOGIC DATA AND INTERNET RESOURCES10-2
q 2006 by Taylor & Francis Group, LLC
Table 10A.1 Causes of Damage to the Quality of Water Resources
Types of Waste Wastewater Sources Water-Quality Measures Effects on Water Quality Effects on Aquatic Life Effects on Recreation
Disease-carrying agents
— human feces, warm-
blooded animal feces
Municipal discharges, watercraft
discharges, urban runoff, agricultural
runoff, feedlot wastes, combined sewer
overflows, industrial discharges
Fecal coliform, fecal
streptococcus, other
microbes
Health hazard for human
consumption and contact
Inedibility of shellfish for
humans
Reduced contact
recreation
Oxygen-demanding
wastes — high
concentrations of
biodegradable organic
matter
Municipal discharges, industrial
discharges, combined sewer overflows,
watercraft discharges, urban runoff,
agricultural runoff, feedlot wastes,
natural sources
Biochemical oxygen
demand, dissolved
oxygen, volatile solids
sulfides
Deoxygenation, potential
for septic conditions
Fish kills If severe, eliminated
recreation
Suspended organic and
inorganic material
Mining discharges, municipal
discharges, industrial discharges,
construction runoff, agricultural runoff,
urban runoff, silvicultural runoff, natural
sources, combined sewer overflows
Suspended solids,
turbidity, biochemical
oxygen demand, sulfides
Reduced light penetration,
deposition on bottom,
benthic deoxygenation
Reduced photosynthesis,
changed bottom organism
population, reduced fish
production, reduced sport
fish population, increased
nonsport fish population
Reduced game fishing,
aesthetic appreciation
Inorganic materials,
mineral substances —
metal, salts, acids, solid
matter, other chemicals,
oil
Mining discharges, acid mine drainage,
industrial discharges, municipal
discharges, combined sewer overflows,
urban runoff, oil fields, agricultural
runoff, irrigation return flow, natural
sources, cooling tower blowdown,
transportation spills, coal gasification
pH, acidity, alkalinity,
dissolved solids, chlorides,
sulfates, sodium, specific
metals, toxicity bioassay,
visual (oil spills)
Acidity, salination, toxicity
of heavy metals, floating
oils
Reduced biological
productivity, reduced flow,
fish kills, reduced
production, tainted fish
Reduced recreational use,
fishing, aesthetic
appreciation
Synthetic organic
chemicals — dissolved
organic material, e.g.,
detergents, household
aids, pesticides
Industrial discharges, urban runoff,
municipal discharges, combined sewer
overflow, agricultural runoff, silvicultural
runoff, transportation spills, mining
discharges
Cyanides, phenols, toxicity
bioassay
Toxicity of natural
organics, biodegradable or
persistent synthetic
organics
Fish kills, tainted fish,
reduced reproduction,
skeletal development
Reduced fishing, inedible
fish for humans
Nutrients — nitrogen,
phosphorus
Municipal discharges, agricultural
runoff, combined sewer overflows,
industrial discharges, urban runoff,
natural sources
Nitrogen, phosphorus Increased algal growth,
dissolved oxygen
reduction
Increased production,
reduced sport fish
population, increased
nonsport fish population
Tainted drinking water,
reduced fishing and
aesthetic appreciation
Radioactive materials Industrial discharges, mining Radioactivity Increased radioactivity Altered natural rate of
genetic mutation
Reduced opportunities
Heat Cooling water discharges, industrial
discharges, municipal discharges,
cooling tower blowdown
Temperature Increased temperature,
reduced capacity to
absorb oxygen
Fish kills, altered species
composition
Possible increased sport
fishing by extended
season for fish, which
might otherwise migrate
Source: From Council of Environmental Quality, 1981, Environmental Trends.
ENVIRONMENTAL PROBLEMS 10-3
q 2006 by Taylor & Francis Group, LLC
Table 10A.2 Point- and Nonpoint Sources of Water Pollution
Sources Common Pollutant Categories
POINT SOURCES
Municipal sewage treatment plants BOD; bacteria; nutrients;
ammonia; toxics
Industrial facilities Toxics; BOD
Combined sewer overflows BOD; bacteria; nutrients;
turbidity; total dissolved solids;
ammonia; toxics; bacteria
NONPOINT SOURCES
Agricultural runoff Nutrients; turbidity; total
dissolved solids; toxics; bacteria
Urban runoff Turbidity; bacteria; nutrients; total
dissolved solids; toxics
Construction runoff Turbidity; nutrients; toxics
Mining runoff Turbidity; acids; toxics; total
dissolved solids
Septic systems Bacteria; nutrients
Landfills/spills Toxics; miscellaneous
substances
Silvicultural runoff Nutrients; turbidity; toxics
Source: From U.S. Environmental Protection Agency, National Water Quality Inventory,
1986 Report to Congress.
THE WATER ENCYCLOPEDIA: HYDROLOGIC DATA AND INTERNET RESOURCES10-4
q 2006 by Taylor & Francis Group, LLC
Table 10A.3 Classes of Nonpoint Source Pollution
a
BOD, Biological Oxygen Demand.
b
PAH, Polycyclic Aromatic Hydrocarbons.
c
PCB, Polycyclic Chlorinated Bi-Phenyls.
d
COD, Chemical Oxygen Demand.
Source: From Ongley, E.D., 1996, Control of water pollution from agriculture-FAO irrigation and drainage paper 55, Food and Agriculture Organization of the United Nations, Rome.
Reprinted with permission.
ENVIRONMENTAL PROBLEMS 10-5
q 2006 by Taylor & Francis Group, LLC
Table 10A.4 Contamination Sources Reported by Public Water-Supply Systems in the United States
Water-Supply Source
Type of Contamination Groundwater River/Stream Lake/Reservoir
Industrial/commercial discharges 62 97 38
Leaking underground tanks 81 33 23
Urban runoff 35 91 24
Landfills 67 49 22
Synthetic or volatile organics 83 56 18
Hazardous waste site(s) 37 31 8
Land development 36 76 32
Underground waste injection 27 5 3
Agricultural runoff (pesticides,
fertilizers, etc.)
49 126 86
Algae/bacteria 15 117 124
Overdraft 40 7 4
Water rights disputes 16 22 12
Natural contamination (radionuclides,
salinity, etc.)
52 56 35
Note: Number of utilities reporting in each category.
Source: From American Water Works Association, 1984 Water Utility Operating Data; Copyright AWWA.
Table 10A.5 Anthropogenic Sources of Pollutants in the Aquatic Environment
Source Bacteria Nutrients
Trace
Elements
Pesticides/
Herbicides
Industrial
Organic Micro
Pollutants
Oils and
Greases
Atmosphere x xxxG xxxG xxxG
Point sources
Sewage xxx xxx xxx x xxx
Industrial effluents x xxxG xxxG xx
Diffuse sources
Agriculture xx xxx x xxxG
Dredging x xxx xx xxx x
Navigation and
harbors
xxxx x xxx
Mixed sources
Urban runoff and
waste disposal
xx xxx xxx xx xx xx
Industrial waste
disposal sites
x xxx x xxx x
Note: x, Low local significance; xx, Moderate local/regional significance; xxx, High local/regional significance; G, Globally significant.
Source: From Chapman, D. (ed.), 1996, Water quality assessments-A guide to use of biota, Sediments and Water in Environmental
Monitoring—Second Edition, Copyright q UNESO/WHO/UNEP, 1996, www.who.int. Reprinted with permission.
THE WATER ENCYCLOPEDIA: HYDROLOGIC DATA AND INTERNET RESOURCES10-6
q 2006 by Taylor & Francis Group, LLC
SECTION 10B SURFACE WATER POLLUTION
Percent of impaired
waters by 8-digit
hydrologic unit code
No waters listed
< 5%
5−10%
10−25%
> 25%
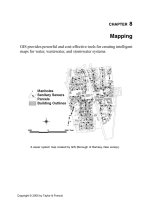
Figure 10B.3 Percentage of impaired waters in the United States by 8-digit hydrologic unit code. (From United States Environmental
Protection Agency, 2000, Atlas of America’s Polluted Waters, EPA-840-B-00-002, May 2000, www.epa.gov.)
ENVIRONMENTAL PROBLEMS 10-7
q 2006 by Taylor & Francis Group, LLC
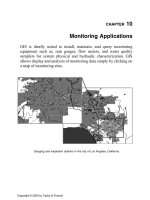
MilesLeading pollutants/stressors
Pathogens (bacteria)
Siltation
Habitat alterations
Nutrients
Thermal modifications
Metals
Flow alterations
Oxygen-Depleting substances
Percent of IMPAIRED river miles
Percent of ASSESSED river miles
0 5 10 15 20
0 102030405060
93,431
84,503
58,807
55,398
52,870
44,962
41,400
25,355
Leading sources
b
Miles
Agriculture
Hydrologic modification
Habitat modification
Urban runoff/Storm sewers
Forestry
Municipal point sources
Resource extraction
Percent of IMPAIRED river miles
Percent of ASSESSED river miles
0
0 5 10 15 20
10 20 30 40 50
128,859
53,850
37,654
34,871
28,156
27,988
27,695
Total rivers and streams
3,692,830 miles
81%
Not
Assessed
19%
ASSESSED
61%
Good
ASSESSED rivers and streams
699,946 miles
a
426,633
miles
269,258
miles
39%
IMPAIRED
Figure 10B.4 Leading pollutants and sources of river and stream impairment in the United States.
a
Excluding unknown and natural
sources.
b
Includes miles assessed as not attainable. Percentages do not add up to 100% because more than one pollutant
or source may impair a river segment. (From United States Environmental Protection Agency, 2002, National Water Quality
Inventory 2000 Report, EPA-841-R-02-001, www.epa.gov.)
THE WATER ENCYCLOPEDIA: HYDROLOGIC DATA AND INTERNET RESOURCES10-8
q 2006 by Taylor & Francis Group, LLC
89
3.0
2.5
2.0
1.5
1.0
0.5
0
81 74 69 66 64 60 48 45 44 37 32 29 27 24
Detection frequency (percent)
Total concentration (micrograms per liter)
EXPLANATION
Maximum value
Minimum value
Steroids, nonprescription drugs, and an insects repellent were
the three chemical groups most commonly detected in
susceptible streams. Detergent and metabolites, steroids, and
plasticizers generally were found at the highest
concentrations.
Median
75
th
pencentile
25
th
pencentile
''Maximum values not shown:
Steroids: 18.3
Plasticizers: 17.4
Antibiotics: 3.6
Insecticides
Antibiotics
Fragrances: 4.3
Fragrances
Solvant
Other prescription drugs
Antioxidants
Hormones
PAHs
Detergent metabolies: 55.6
Non prescription drugs: 17.4
Nonprescription drugs
Steroids
Insects repellent
Detergent metabolites
Plasticizers
Disinfects
Fire retardants
Figure 10B.5 Pharmaceuticals, hormones, and other organic wastewater contaminants in United States streams. (From Buxton, H.T. and
Kolpin, D.W., 2002, Pharmaceuticals, Hormones, and Other Organic Wastewater Contaminants in U.S. Streams, USGS
Fact Sheet FS-027-02, June 2002, www.usgs.gov.)
ENVIRONMENTAL PROBLEMS 10-9
q 2006 by Taylor & Francis Group, LLC
Alaska Hawaii Puerto Rice
Total Number of Stations: 8,348
Figure 10B.6 Sampling stations classified as tier 1 (associated adverse effects are probable). (From USEPA, 2004, The incidence and
severity of sediment contamination in surface waters of the United States, National Sediment Quality Survey: Second
Edition, EPA 823-R-04-007, www.epa.gov.)
THE WATER ENCYCLOPEDIA: HYDROLOGIC DATA AND INTERNET RESOURCES10-10
q 2006 by Taylor & Francis Group, LLC
CCPT
WILL
USNK
NVBR
NVBR
EXPLANATION
SANJ
Total PCB concentration
in sediment, micrograms
per kilogram dry weight
SPLT
CNBR
OZRK
ACFB
GAFL
ALBE
POTO
LSUS
CONN
HDSN
WHIT
RIOG
TRIN
REDN
WMIC
< 100
> 146
Study unit
100 146
400 MILES
400 KILOMETERS
0
0
Figure 10B.7 Geographic distribution of total polychlorinated biphenyls in sediment samples in the United States. (From Wong, C.S.,
Capel, P.D., and Nowell, L.H., 2000, Organochlorine Pesticides and PCBs in Stream Sediment and Aquatic Biota—Initial
Results from the National Water-Quality Assessment Program, 1992–1995, Water-Resources Investigations Report 00-
4053, www.usgs.gov.)
Explanation
Decreasing trend
Increasing trend
No trend
Figure 10B.8 PAH trends throughout the United States using sediment core data from 1970 to top of core. (From USEPA, 2004, The
incidence and severity of sediment contamination in surface waters of the United States, National Sediment Quality Survey:
Second Edition, EPA 823-R-04-007, www.epa.gov.)
ENVIRONMENTAL PROBLEMS 10-11
q 2006 by Taylor & Francis Group, LLC
Explanation
Decreasing trend
No trend
Figure 10B.9 Lead trends throughout the United States using sediment core data from 1975 to top of core. (From USEPA, 2004, The
incidence and severity of sediment contamination in surface waters of the United States, National Sediment Quality Survey:
Second Edition, EPA 823-R-04-007, www.epa.gov.)
2
1.8
1.6
1.4
1.2
1
0.8
0.6
0.4
0.2
0
A/F
Mine
Ag
Urb
Bk
g
HgTot sediment/100
MeHg sediment
MeHg water × 10
Hg fish
HgTot water/10
Ag = Agriculture
A/F = Mixed agriculture
and forest
Bkg = Background
Urb = Urban
Figure 10B.10 Geometric mean of mercury and methylmercury in fish (mg/g wet), water (mg/L), and sediment (hg/g dry) for land use
categories: mixed agriculture and forest, mine, agriculture, urban or industrial activity, and background. (Number of
observationZ13, 42, 23, 15, and 34 for A/F, Mine, Ag, Bkg and Urb, respectively. Excludes South Florida Basin.) (From
Brumbaugh, W.G. et al., 2001, A national pilot study mercury contamination of aquatic ecosystems along multiple
gradients: Bioaccumulation in Fish, USGS, Biological Science Report USGS/BRD/BSR-2001-0009, www.usgs.gov.)
THE WATER ENCYCLOPEDIA: HYDROLOGIC DATA AND INTERNET RESOURCES10-12
q 2006 by Taylor & Francis Group, LLC
Leading pollutants/stressors
Metals
Pesticides
Oxygen-depleting substances
Pathogens (bacteria)
Priority toxic organic chemicals
PCBs
Total dissolved solids
Percent of IMPAIRED estuarine square miles
Percent of ASSESSED estuarine square miles
010
0 5 10 15 20 25
20 30 40 50
8,077
5,985
5,324
4,764
3,652
2,622
2,494
Square miles
Municipal point sources
Urban runoff/storm sewers
Industrial discharges
Atmospheric deposition
Agriculture
Hydrologic modifications
Resource extraction
Percent of IMPAIRED estuarine square miles
Percent of ASSESSED estuarine square miles
0
0
10
5101520
20 30 40
5,779
5,045
4,116
3,692
2,811
2,171
1,913
Leading sources
a
Square miles
Total estuaries
87,369 mi
2
ASSESSED estuaries
31,072 mi
2
14,873 mi
2
15,676 mi
2
64%
Not
Assessed
49%
Good
51%
IMPAIRED
36%
ASSESSED
Figure 10B.11 Leading pollutants and sources of estuary impairment in the United States.
a
Excludes unknown, natural, and “other
sources.” Percentages do not add up to 100% because more than one pollutant or source may impair an estuary. (From
United States Environmental Protection Agency, 2002, National Water Quality Inventory 2000 Report, EPA-841-R-02-
001, www.epa.gov.)
ENVIRONMENTAL PROBLEMS 10-13
q 2006 by Taylor & Francis Group, LLC
Leading sources
b
Miles
Present of IMPAIRED shoreline miles
Present of ASSESSED shoreline miles
Urban runoff/storm
sewers
Nonpoint sources
Land disposal
Septic tanks
Municipal point sources
Industrial discharges
Construction
02468
241
142
123
103
89
76
29
0 102030405060
Leading pollutants/stressors Miles
Present of IMPAIRED shoreline miles
Present of ASSESSED shoreline miles
0
Pathogens (bacteria)
Oxygen-depleting
substances
Turbidity
Suspended solids
Oil and grease
Metals
Nutrients
024681012
384
102
53
50
48
46
43
10 20 30 40 50 60 70 80 90
Total ocean shoreline
58,618
mi
ASSESSED ocean shoreline
3,221
mi
a
14%
IMPAIRED
434
mi
2,755 mi
86%
Good
94%
Not
Assessed
6%
ASSESSED
Figure 10B.12 Leading pollutants and sources of ocean shoreline water impairment in the United States.
a
Includes miles assessed as not
attainable.
b
Excludes natural sources. Percentages do not add up to 100% because more than one pollutant or source
may impair a segment of ocean shoreline. (From United States Environmental Protection Agency, 2002, National Water
Quality Inventory 2000 Report, EPA-841-R-02-001, www.epa.gov.)
THE WATER ENCYCLOPEDIA: HYDROLOGIC DATA AND INTERNET RESOURCES10-14
q 2006 by Taylor & Francis Group, LLC
Nonpoint sources (general)
Municipal discharges
Marinas
Industrial discharges
Combined sewer overflows
02040
Square miles impacted
60 80 100
100
49
27
10
8
Sources 3 States reporting Total
Figure 10B.13 Sources associated with shellfish harvesting restrictions. (From United States Environmental Protection Agency, 2002,
National Water Quality Inventory 2000 Report, EPA-841-R-02-001, www.epa.gov.)
Overall
West
Overall
Great Lakes
Overall
Gulf
Overall
Southeast
Overall
Northeast
Good Fair Poor
Good Fair Poor
Good Fair Poor
Good Fair Poor
Overall
West
Overall
Great Lakes
Overall
Gulf
Overall
Southeast
Overall
Northeast
Good Fair Poor
Overall National
Coastal Condition
Good Fair Poor
Surveys completed, but no indicator
data available until the next report
Overall
Puerto Rico
Good Fair Poor
*
*
Ecological Health
Water Quality Index
Sediment Quality Index
Benthic Index
Coastal Habitat Index
Fish Tissue Index
*
Surveys completed, but no indicator
data available until the next report
Overall
Puerto Rico
Figure 10B.14 Overall United States national coastal condition. (From United States Environmental Protection Agency, 2004, National
Coastal Condition Report II, EPA-620/R-03/002, December 2004, www.epa.gov.)
ENVIRONMENTAL PROBLEMS 10-15
q 2006 by Taylor & Francis Group, LLC
The area and duration of hypoxia are tracked in the Gulf of Mexico and Long Island Sound as indicators of the natural variability in those water-
bodies to determine whether actions to control nutrients are having the desired effect and how local species are affected.
The largest of oxygen-depleted coastal waters in the U.S. is in the northern Gulf of Mexico on the Louisiana/Texas continental shelf. Hypoxic
waters are most prevalent from late spring through late summer and are more widespread and persistent in some years that in others, depending
on river flow, winds, and other environmental variables. Hypoxia occurs mostly in the lower water column, but can encompass as much as the
lower half to two-thirds of the entire column.
The midsummer bottom area extent of hypoxic water in the Gulf of Mexico increased from 3,500 mi
2
(9,000 km
2
) in 1985
to 8,500 mi
2
(22,000 km
2
) in July 2002 (Exhibit 2-3). The primary cause of the hypoxic conditions is probably the
eutrophication of those waters from nutrient enrichment delivered to the Gulf by the Mississippi River and its drainage basin.
13,14
The maximum area of hypoxia in Long
Island Sound averaged 201
mi
2
(521
km
2
) from 1987 through
2001. The largest area was 395
mi
2
(1,023
km
2
) in 1994, and the smallest
was 30
mi
2
(78
km
2
) in 1997
(Exhibit 2-4). The duration
of hypoxia averaged 56 days
during the same period, with a low of
34 days in 1996 and a high of 82 days
in 1989. Hypoxia is typically more
severe in the western portions of the
sound, where the nitrogen load is
higher and mixing of fresh and salt
water is more restricted.
15
Exhibit 2-3: Area extent of midsummer hypoxia in the Gulf of Mexico, 1985−2002
1985
0
5,000
Square Kilometers
10,000
15,000
20,000
25,000
(9,702 mi
2
)
(7,772
mi
2
)
(5,792
mi
2
)
(3,861
mi
2
)
(1,930
mi
2
)
1986 1987 1988 1989 1990 1991 1992 1993 1994 1995 1996 1997 1998 1999 2000 2001 2002
Note:
Hypoxia in the Gulf is defined as less than 2.0 parts per million (ppm).
Annual Midsummer cruises have been conducted systematically over the past 15 years (with the exception of 1989). Hypoxia in bottom waters covered an
average of 8,000−9,000 km
2
in 1985−92 but increased to 16,000−20,000 km
2
in 1993−99.
Exhibit 2-4: Maximum area and duration of hypoxia in Long Island Sound, 1987−2001
450
400
350
300
250
200
150
100
50
0
1987 1989 1991 1993 1995 1997 1999 2001
0
10
20
30
Days
Square Miles
40
50
60
70
80
90
Note:
Hypoxia in Long Island Sound is defined as less than 3.0 parts per million (ppm).
Area of hypoxia Duration of hypoxia
Figure 10B.15 Hypoxia in the Gulf of Mexico and Long Island Sound. (From United States Environmental Protection Agency, 2003,
EPA’s Draft Report on the Environment, 2003, EPA 600-R-03-050, www.epa.gov.)
THE WATER ENCYCLOPEDIA: HYDROLOGIC DATA AND INTERNET RESOURCES10-16
q 2006 by Taylor & Francis Group, LLC
Southern
California
Gulf of
Mexico
South
Florida
Southeast
Mid-
Atlantic
U.S.
0204060
Percent area
80
Metals
82
46
40
75
28
29
93
99
53
59
11
34
77
63
46
75
45
40
Pesticides
PCBs
100 120
Figure 10B.16 Regional sediment enrichment (1990–1997) in United States coastal waters due to human sources. (From United States
Enviornmental Protection Agency, 2003, EPA’s Draft Report on the Environment, 2003, EPA 600-R-03-050,
www.epa.gov.) Original Source: USEPA, National Coastal Condition Report, September 2001.
Covera
g
e: United States east coast (excludin
g
waters north of Cape Cod) and Gulf of Mexico
Contaminant Concentrations with Adverse Effects on Organisms
Pesticides Metals PAHs/PCBs
89% < ERL76% < ERL70% < ERL
29%
between
ERL and ERM
23%
between
ERL and ERM
1% > ERM1% > ERM1% > ERM
10%
between ERL
and ERM
Below Levels Associated with Adverse Affects Effects Possible but Unlikely Effects Likely
Figure 10B.17 Distribution of sediment contaminant concentrations in sampled estuarine sites, 1990–1997. ERL, NOAA Effects Range
Low; ERM, NOAA Effects Range median. (From United States Enviornmental Protection Agency, 2003, EPA’s Draft
Report on the Environment, 2003, EPA 600-R-03-050, www.epa.gov.) Original Source: USEPA, National Coastal
Condition Report, September 2001.
ENVIRONMENTAL PROBLEMS 10-17
q 2006 by Taylor & Francis Group, LLC
3.0
2.8
2.6
2.4
2.2
2.0
1.8
1.6
Median concentration relative to 1990
1.4
1.2
1.0
0.8
0.4
0.6
0.2
0.0
1984 1986 1988 1990 1992 1994
Year
1996 1998 2000 2002
LMWPAH DDT
PCB
Chlordane
Dieldrin
HMWPAH
Butyltin
Figure 10B.18 Trends in contaminant concentrations measured in NOAA’s mussel water project since 1986. (From United States
Environmental Protection Agency, 2004, National Coastal Condition Report II, EPA-620/R-03/002, December 2004,
www.epa.gov.)
THE WATER ENCYCLOPEDIA: HYDROLOGIC DATA AND INTERNET RESOURCES10-18
q 2006 by Taylor & Francis Group, LLC
Leading pollutants/stressors
Nutrients
Metals
Siltation
Total dissolved solids
Oxygen-depleting substances
Excess algal growth
Pesticides
Percent of IMPAIRED lake acres
Percent of ASSESSED lake acres
0
0
510
10 20 30 40 50
15 20 25
3,840,383
3,220,650
1,585,383
1,497,828
1,123,432
957,088
632,217
Acres
Agriculture
Hydrologic modifications
Urban runoff/storm sewers
Nonpoint sources
Atmospheric deposition
Municipal point sources
Land disposal
Percent of IMPAIRED lake acres
Percent of ASSESSED lake acres
0
10 20 30 40 50
0 5 10 15 20
3,158,393
1,413,624
1,369,327
1,045,036
983,936
943,715
856,586
Leading sources Acres
Total lakes
40.6 million acres
45%
IMPAIRED
7.7 million acres
9.4 million
acres
57%
Not
Assessed
43%
ASSESSED
55%
Good
ASSESSED lakes
17.3 million acres
Leading POLLUTANTS in impaired lakes*
Eleven states did not include the effects of statewide fish consumption advisories when reporting
the pollutants and sources responsible for impairment. Therefore, certain pollutants and sources,
such as metals and atmospheric deposition, may be under represented.
*
Excluding unknown, natural, and "other" sources.
Includes acres assessed as not attainable.
Note
: Percentages do not add up to 100% because more than one pollutant or source may
impair a lake.
Figure 10B.19 Leading pollutants and sources in impaired lakes in the United States. (From United States Environmental Protection
Agency, 2002, National Water Quality Inventory 2000 Report, EPA-841-R-02-001, www.epa.gov.)
ENVIRONMENTAL PROBLEMS 10-19
q 2006 by Taylor & Francis Group, LLC
Leading sources Miles
024681012
519
152
75
71
62
61
61
0 2 4 6 8 10121416
Percent of IMPAIRED Great Lakes shoreline miles
Percent of ASSESSED Great Lakes shoreline miles
Contaminated sediments
Urban runoff/storm sewers
Agriculture
Atmospheric deposition
Habitat modification
Land disposal
Septic tanks
Note
: Percentages do not add up to 100% because more than one pollutant or source may impair a
se
g
ment of
g
reat lakes shoreline.
Leading pollutants/stressors Miles
Priority toxic organic chemicals
Percent of IMPAIRED Great Lakes shoreline miles
024681012
024681012
14 16
497
109
102
98
73
53
43
Percent of ASSESSED Great Lakes shoreline miles
Nutrients
Pathogens (bacteria)
Sedimentation/siltation
Oxygen-depleting substances
Taste and odor
PCBs
Total Great Lakes shoreline
5,521
mi
8%
Not
Assessed
92%
ASSESSED
78%
IMPAIRED
3,955 miles
22%
Good
1,095
mi
ASSESSED Great Lakes shoreline
5,066
mi
Figure 10B.20 Leading pollutants and sources in impaired Great Lakes shoreline waters in the United States. (From United States
Environmental Protection Agency, 2002, National Water Quality Inventory 2000 Report, EPA-841-R-02-001,
www.epa.gov.)
THE WATER ENCYCLOPEDIA: HYDROLOGIC DATA AND INTERNET RESOURCES10-20
q 2006 by Taylor & Francis Group, LLC
Proposed TP Guideline
(Phosphorus Management
Strategies Tast Force, 1980)
30
25
20
15
TP (μg/L)
10
5
0
30
25
20
15
TP (μg/L)
10
5
0
71 73 75 77 79 81 83 8587 8991 93 95 97
71 73 75777981838587 89 91 93 95 97
71 73 75777981838587 89 91 93 95 97
30
25
20
15
TP (μg/L)
TP (μg/L)
10
10
20
30
40
50
60
70
80
90
100
5
0
0
30
25
20
15
TP (μg/L)
10
5
0
30
25
20
15
TP (μg/L)
10
5
0
30
25
20
15
TP (μg/L)
10
5
0
71 73 75777981838587 89 91 93 95 97
71 73 757779 81 83 85 87 89 91 93 95 97
Ontario
Huron
Michigan
7173757779818385878991939597
Erie
Western Basin
71737577 79 81838587 89 919395 97
Superior
Eastern BasinCentral Basin
Erie
Figure 10B.21 Total phosphorous trends in the Great Lakes from 1971 to 1997 (spring, open lake surface). (From International Joint
Commission, 2004, 12th Biennial Report on Great Lakes Water Quality, September 2004, www.ijc.org.)
1,500
Great Lakes (GL)
Wet Dry
Chesapeake Bay (CB)
GL
Lead Cadmium Arsenic Total
PCBs
Phenanthrene Pyrene Benzo (a)
Pyrene
GL
CB
CB
GL
GL
GL
GL
CB
CB
CB
12
10
8
6
4
2
CB
1,000
500
Trace metal depositional flux (mg/m
2
-yr)
Organic contaminant depositional flux (mg/m
2
-yr)
Figure 10B.22 Comparison of Chesapeake Bay and Great Lakes atmospheric depositional fluxes. (From United States Environmental
Protection Agency,1997, Deposition ofAir Pollutants to theGreat Waters Second Report toCongress, EPA-453/R-97-011,
www.epa.gov.) Original Source: Baker et al., 1996 (Chesapeake Bay) and Eisenreich and Strachen 1992 (Great Lakes).
ENVIRONMENTAL PROBLEMS 10-21
q 2006 by Taylor & Francis Group, LLC
2000
1000
500
Vapor Phase
Total PCBs (pg/m
3
)
Tributary Total PCBs (ng/L)
0
10
20
30
40
50
60
70
80
90
0
42
84
126
168
210
Sediment
Total PCBs (ng/g)
AIR
WATER
SEDIMENT
Water Column
Diss. TotalPCBs
(ng/L)
0.637
0.530
0.423
0.317
0.210
0.104
Figure 10B.23 Concentrations of total PCBs in the atmosphere, tributaries, water column and sediments of Lake Michigan. (From
McCarty, H.B. et al., United States Environmental Protection Agency, 2004, Results of the Lake Michigan Mass Balance
Study: Polychlorinated Biphenyls and trans-Nonachlor Data Report, EPA 905 R-01-011, April 2004, www.epa.gov.)
THE WATER ENCYCLOPEDIA: HYDROLOGIC DATA AND INTERNET RESOURCES10-22
q 2006 by Taylor & Francis Group, LLC
Atmospheric deposition of (PCBs) and DDT
in the great lakes, 1992−1998
Polychlorinated biphenyls (PCBs)
trends in great lakes fish tissue,* 1972−2000
Total Atmospheric Inputs (Wet + Dry + Gaseous Absorption)
1800
L. Michigan
L. Ontario
L. Huron
L. Erie
L. Superior
*Lake Trout (Walleye in Lake Erie)
Total PCBs
DDT
DDT Trend Line
PCB Trend Line
R
2
= 0.7476
R
2
= 0.6947
1600
1400
1200
1000
800
Total atmospheric inputs (kg/yr)
600
400
200
0
1992 1993 1994 1995
Year
1996 1997 1998
25
20
15
10
PCBs (parts per million)
5
0
1972 1976 1980 1984 1988 1992 1996 2000
Note:
R
2
is the coefficient of determination. It gives a measure of the strength of the
correlation.
Lake Michigan polychlorinated biphenyls
(PCBs) sources, 1970 and 1995
values in kilograms per year
Tributaries
1970
12000
4500
1610
1150
2500
350
Note:
This graphic was created for this report by the EPA Great Lakes National
Program Office and the EPA, Office of Research and Developments Large Lakes
Research Station using MICHTOX a mass balance and bio accumulation model
and air, water, and sediment data drawn from the Great Lakes Environmental
Monitoring Database (GLENDA). The 1970 model run was based on available data
and extrapolations. The 1995 model run was based on data collected during the
Lake Michigan Mass Balance Study that collected over 25,000 samples at 200
locations in 1994−1995.
1995
Atmosphere Sediment
Figure 10B.24 Bioaccumulation of PCBs and DDT in the Great Lakes. (From United States Environmental Protection Agency, 2003,
EPA’s Draft Report on the Environment, 2003, EPA 600-R-03-050, www.epa.gov.)
ENVIRONMENTAL PROBLEMS 10-23
q 2006 by Taylor & Francis Group, LLC
250
200
150
100
50
0
Superior Michigan
1988 1992 1994 1996
Huron Erie Ontario
Figure 10B.25 Loading estimates of benzo(a)pyrene to the Great Lakes (kg/yr). (From United States Environmental Protection Agency,
2000, Deposition of Air Pollutants to the Great Waters Third Report to Congress, EPA-453/R-00-005, www.epa.gov.)
1000
100
10
0.1
0.01
0.001
0.0001
Water
Sediment
Phytoplankton
Zooplankton
Adult Coho
Lake Trout
Mercury concentration (ppb dw)
1
Figure 10B.26 Mercury concentrations in various components of the Lake Michigan ecosystem. (From McCarty, H.B., Brent, R.N.,
Schofield, J., and Rossmann, R., 2004, Results of the Lake Michigan Mass Balance Study: Mercury Data Report, EPA
905 R-01-012, www.epa.gov.)
THE WATER ENCYCLOPEDIA: HYDROLOGIC DATA AND INTERNET RESOURCES10-24
q 2006 by Taylor & Francis Group, LLC
Naubinway
Manistique
Mackinaw City
Charlevoix
Lake Michigan Mass Balance
Project 1994−1996 Surficial
Sediment (0−1 cm) Mercury
Concentrations (ng/g)
Legend
220 ng/g
200 ng/g
180 ng/g
160 ng/g
140 ng/g
120 ng/g
100 ng/g
80 ng/g
60 ng/g
40 ng/g
20 ng/g
0 ng/g
−20 ng/g
Frankfort
Manistee
Pentwater
Muskegon
Grand Haven
Saugatuck
South Haven
Benton Harbor
Michigan City
Gary
Chicago
Waukegan
Racine
Milwaukee
Sheboygan
Manitowoc
Green Bay
Menominee
Escanaba
Scale
N
0 km
50 km
100 km
150 km
Door Peninsula
20
20
20
20
20
60
60
60
60
60
60
20
20
60
20
20
20
20
20
60
60
100
100
100
100
100
100
100
140
140
140
140
Figure 10B.27 Mercury concentrations (mg/kg) in Lake Michigan surficial sediments (1994–1996). (From McCarty, H.B. et al., 2004,
Results of the Lake Michigan Mass Balance Study: Mercury Data Report, EPA 905 R-01-012, www.epa.gov.)
ENVIRONMENTAL PROBLEMS 10-25
q 2006 by Taylor & Francis Group, LLC