Báo cáo y học: " Transient expression of bC1 protein differentially regulates host genes related to stress response, chloroplast and mitochondrial functions" pptx
Bạn đang xem bản rút gọn của tài liệu. Xem và tải ngay bản đầy đủ của tài liệu tại đây (786.96 KB, 12 trang )
RESEARCH Open Access
Transient expression of bC1 protein differentially
regulates host genes related to stress response,
chloroplast and mitochondrial functions
Saiqa Andleeb, Imran Amin, Aftab Bashir, Rob W Briddon, Shahid Mansoor
*
Abstract
Background: Geminiviruses are emerging plant pathogens that infect a wide variety of crops including cotton,
cassava, vegetables, ornamental plants and cereals. The geminivirus disease complex cons ists of monopartite
begomoviruses that require betasatellites for the expression of disease symptoms. These complexes are widespread
throughout the Old World and cause economically important diseases on several crops. A single protein encoded
by betasatellites, termed bC1, is a suppressor of gene silencing, in ducer of disease symptoms and is possibly
involved in virus movement. Studies of the interaction of bC1 with hosts can provide useful insight into virus-host
interactions and aid in the development of novel control strategies. We have used the differential display
technique to isolate host genes which are differentially regulated upon transient expression of the bC1 protein of
chili leaf curl betasatellite (ChLCB) in Nicotiana tabacum.
Results: Through differential display analysis, eight genes were isolated from Nicotiana tabacum, at two and four
days after infitration with bC1 of ChLCB, expressed under the control of the Caul iflower mosaic virus 35S promoter.
Cloning and sequence analysi s of differentially amplified products suggested that these genes were involved in
ATP synthesis, and acted as elec tron carriers for respiration and photosynthesis processes. These differe ntially
expressed genes (DEGs) play an important role in plant growth and development, cell protection, defence
processes, replication mechanisms and detoxification responses. Kegg orthology based annotation system analysis
of these DEGs demonstrated that one of the genes, coding for polynucleotide nucleotidyl transferase, is involved
in purine and pyrimidine metabolic pathways and is an RNA bindi ng protein which is involved in RNA
degradation.
Conclusion: bC1 differentially regulated genes are mostly involved in chloroplast and mitochondrial functions. bC1
also increases the expression of those genes which are involved in purine and pyrimidine metabolism. This
information gives a new insight into the interaction of bC1 with the host and can be used to understand host-
virus interactions in follow-up studies.
Background
Geminiviruses are economically important plant patho-
gens and are characterized by twinned isometric parti-
cles containing single-stranded (ss)DNA genomes of
2.5-3.0 kb [1] that replicate through double-stranded
(ds)DNA intermediates by a rolling-circle mechanism
[2]. The family Geminiviridae is divided into four gen-
era, (Begomovirus, Mastrevirus, Curtovirus and Topocu-
virus)thatencompassvirusesthatdifferingenome
organization as well as their insect vectors. Begomo-
viruses are transmitted by t he whitefly Bemisia tabaci
and have either monopartite or bipartite genomes.
Monopartite begomoviruses are often associated with
circular, ssDNA satellites that are collectively referred to
as betasatellites (formerly known as DNA b). Betasatel-
lites have recently been found to be associated with
some bipartite begomoviruses and are required by some
of their helper begomoviruses to induce bona fide dis-
ease symptoms in plants. Numerous economically
important diseases and even the earliest recorded plant
* Correspondence:
Agricultural Biotechnology Division, National Institute for Biotechnology and
Genetic Engineering, Faisalabad, Pakistan
Andleeb et al. Virology Journal 2010, 7:373
/>© 2010 Andleeb et al; licensee BioMed Central Ltd. This is an Open Access article distributed under the terms of the Creative
Commons Attribution License ( es/by/2.0), which permits unrestricted use, distribution, and
reproduction in any medium , provided the original work is properly cited.
viral disease are now known to be caused by b egomo-
virus/betasatellite complexes [3,4].
Betasatellites are widespread in the Old World, where
monopartite begomoviruses are known to occur.
Numerous distinct betasatellites, from various econom-
ically important hosts and diverse locations, have been
cloned and have been found in most cases to contribute
significantly to disease symptoms [5]. Analysis of betasa-
tellite sequences reveals a highly conserved organization
consisting of an adenine-rich region and a region of
sequence highly conserved between all betasatellites
(known as the satellite conserved region [SCR]). The
SCR contains a potential hairpin structure with the loop
sequence TAA/GTATTAC that has similarity to the ori-
gins of replication of geminiviruses and nanoviruses.
Betasatellites encode only a single gene, known as the
bC1, located on the complement ary-sense strand, is
conserved in position and size in all betasatellites [6,7].
Chilli leaf curl betasatellite (ChLCB) is associated
with chilli leaf curl disease (ChLCuD), a s ignificant
constrain to chilli production across the Indian sub-
continent[8,9].Saeedetal.[5]demonstratedthat
tobacco plants transformed with the bC1 of Cotton
leaf curl Multan betasatellite (CLCuMB) under the
control of the Cauliflower mosaic virus 35S promoter,
or with a dimer of CLCuMB, exhibited severe disease-
like phenotypes, while plants transformed with a
mutated version of the bC1 appeared normal. Qazi
et al. [10] showed that e xpression of CLCuMB bC1
from a Potato virus X vector induced sym ptoms typical
of cotton leaf curl disease (CLCuD) in the absence of
the helper begomovirus. These results demonstrated
that CLCuMB bC1 is the major determinant of symp-
toms of the CLCuD complex [10].
The interactions between plants and viruses are com-
plex and involve several types of responses that may or
may not cause disease in the host [11]. In compatible
interactions, the i nvading virus is able to infect and
replicate within a susceptible plant to cause disease.
Alternatively, the host may trigger innate immunity
mechanisms that restrict virus movement and prevent
disease onset. In both situations, viral pathogens severely
disturb plant growth and development, due to their
effect on cellular metabolism [11]. Viral infection pro-
duces a plethora of symptoms derived from biochemical
and metabolic changes in cells, tissues and even in the
whole plants which are susceptible and hypersensitive
resistant hosts. Huang et al. [12] and Sui et al. [13]
demonstrated that plant viruses cause severe impact on
host gene expression and protein activity due to the
activation of a set of genes and the inactivation of
others. The gene expression profile in the host plant
changes according to t he timing and l ocalization of the
infection, as the virus spreads from cell to cell away
from the site of inoculation [14,15].
The present studies are aimed at identifying host
genes and pathways th at are i nduced by ChLCB bC1.
This may be achieved using differential RNA display
technology. This technique is based on “ differential dis-
play reverse transcriptase po lymerase chain reaction”
(DDRT-PCR), first described by Liang and Pardee [16].
This method has the advantage of technical simplicity, a
lower bias against rare messages and a requirement of
only small quantities of starting mRN A. Several modifi-
cations of the original technique have been reported
with some solutions to the key problems identified by
some authors [17]. Stress responses have been studied
using DDRT-PCR in C. elegans and S. cerevisiae [18-20].
DDRT-PCR has been applied in many laboratories to
identify genes involved in signal cascades.
The identification of host genes affected by ChLCB
bC1 may provide useful insights into virus-host interac-
tions and provide targets for novel control strategies. By
differential display analysis we have identified N. taba-
cum genes differentially regulated in response to the
transient expression of ChL CB bC1 protein. Subse-
quently the effects of bC1 expression on each gene iden-
tified were verified by quantitative real time PCR
analysis.
Results and Discussion
We have made a further modification of the DDRT-PCR
techniquebyutilizingthemRNAfractioninsteadof
total RNA and by resolving the products of DDRT-PCR
on 1% agarose gels stained with ethidium bromide [16].
We have identified several genes which were differen-
tially expressed at 2 dpi and 4 dpi. Two different con-
centrations of cDNA (100 ng/μland10ng/μl; Figures
1A-F) were used, of which ninety seven differentially
expressed genes (DEGs) were amplified by different
anchored and arbitrary primer pairs (Table 1; Figures
1A-F). The anchored and arbitrary are random decamer
primers, and used as reverse and forw ard primer for
cDNA synthesis. Agroinfiltration was used for transient
expression of bC1 (ChLCB) under 35S promoter.
DDRT-PCR showed different bands of t ranscripts in
comparison to control plants. Some of the primer com-
binations did not yield an amplification product (Figures
1A-F). At 2 dpi no difference was observed in control
and infected plants as indicated in DD10 (B7, B18);
DD11 (B15, B16, B1 9); and DD12 (B 11, B19), respec-
tively (Figures 1A-C). On the other hand, at 4 dpi same
pattern was also observed in DD10 (B2, B3, B4, B8, B10,
B14, B17, B18, B20), DD11 ( B2, B6, B7, B9, B10, B11,
B12, B13, B16, B17, B18), and DD12 (B6, B7, B11, B14,
B15) respectively (Figures 1D-F).
Andleeb et al. Virology Journal 2010, 7:373
/>Page 2 of 12
Analysis of DEGs identified at two days post infiltration
Differentially expressed products were cloned and
sequenced. The identity of these differentially expressed
genes was analysed using NCBI nucleotide data blast
system. The ratio of differentially expressed genes (SA1,
SA2, SA3, SA4, SAA, SA B, SAC and S AD) expressed in
a sample versus a calibrator (healthy plant and plant
infiltrated with pGreen0029) in comparison to a refer-
ence gene (rubisco) is indicated in the Tables 2, 3 and
4. The results of Delta Delta (Ct), Livak and the Pfaffi
mathematical models indicated that SAA, SAB, SAD,
SA1, SA2, and SA3 mRNA expression were upregulated
in sample compared to the calibrator (plant ino culated
with pGreen0029 and healthy plant). Interestingly eleva-
tion of mRNA t rans cripts was also detected by RT-PCR
(Figure 2A and 2B). In contrast SAC and SA4 mRNA
expression was d own regulated in the sample compared
to the calibrator (Figure 2A and 2B). The calculated
expression levels by these models is indicated in the
Tables 2, 3 and 4.
The results indicated that SAA showed 76% nucleotide
sequence identity with Solanum lycopersicum WRKY
transcription factor IId-1 splice. The results show that
the SAA gene is upregulated (Figure 2) upon inoculat ion
with the ChLCuB bC1 gene, which is a pathogenicity
determinant [21-23], helps in viral movement, is involved
in symptom induction [9,24,25], is a suppressor of gene
silencing [26] and may be the target of a host response
that up-regulates WRKY transcription factors [27 ]. It has
been shown that the transcription of WRKY genes are
strongly and rapidly upregulated in response to wound-
ing, pathogen infection or a biotic stresses in numerous
plant species, as indicated in Figure 3[28]. Infection of
tobacco with Tobacco mosaic virus (TMV) or bacteria, or
treatment with fungal elicitors, salicylic acid (SA) or
H
2
O
2
, strongly induces several WRKY genes [29,30].
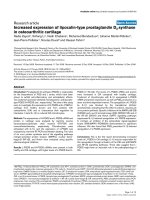
Figure 1 A. Identification of genes differentially expr essed in response to bC1 by diff erential display analysis at two and four days
after infiltration. In each combination of arbitrary and anchored primers, lane 1 represents 100 ng/μl of cDNA (pSAbC1pGreen0029), lane 2
shows 10 ng/μl of cDNA (pSAbC1pGreen0029) and lane 3 indicates 100 ng/μl pGreen0029 in Agrobacterium tumefaciens strain GV 3101.
Differential display analysis two days after inoculation with DD10 (B11-B20); B. DD analysis two days after inoculation with DD11 (B11-B20); C. DD
analysis after two days of inoculation with DD12 (B11-B20); D. DD analysis after four days of inoculation with DD10 (B1-B20); E. DD analysis four
days after inoculation with DD11 (B1-B20); F. DD analysis four days after inoculation with DD12 (B1-B20). The bands eluted for analysis are
indicated (®).
Andleeb et al. Virology Journal 2010, 7:373
/>Page 3 of 12
This suggests that the expression of bC1 gene results in a
stress response and the plant responds t o these stresses
by increasing the transcription of WRKY genes.
SAB showed 68% nucleotide sequence identity with A.
thaliana putative Rieske iron-sulfur protein (RISP) and
73% with P. sativum RISP. The expression of SAB was
upregulated in the response of ChLCB bC1 (Figure 2).
RISP was identified from expression of betaC1 gene [31]
and is absolutely required for mitochondrial respiration
(Figure 3) as reported earlier [ 32,33]. Mitochondrial
RISP is encoded by a nuclear gene, translated as a pre-
cursor protein in the cytoplasm and post-tran slation ally
imported into mitochondria. Huang [34] demonstrated
that the RISP gene family is differentially regulated;
higher RISP levels occur in flowers than in leave s, stems
androots.RISPisinvolvedinenergyproductioninthe
form of ATP, required for pollen development and must
be supplied mainly by mitochondria. Similarly, flower
mitochondria could meet the high demand for energy
either by increasing their metabolic activity to generate
more ATP per mitochondrion or by increasing their
number per cell so that more ATP is produced [35]. It
has been sh own that express ion of bC1 results in foliar
enations [10], which is an indication of enhanced cell
division. Cell division is an energy requiring process.
Therefore one possible pat hway to acquire energy is via
RISP pr oteins (Figure 3). However, this hypothesis will
require further experimental confirmation.
The SAC DNA sequence shows 93% nucleotide
sequence identity with both NADH dehydrogenase subu-
nit 1 (ndh1) and NADH dehydrogenase subunit 2 (ndh2)
of N. tabacum mitochondrial genes, also known as
NADH oxidoreductase. Similar to the SAB, it has b een
demonstrated that SAC is a N. ta bacum mitochondrial
protein an d al so involved in generation of cellular energy
in the form of ATP by building the electro chemical
potential in electron transpo rt chain as indi cated in (Fig-
ure 3) [35,36]. The SAD transcript showed 47% nucleo-
tide sequence identity with the M. truncatula quinon
protein alcohol dehydrogenase. The quinon prot ein alco-
hol dehydrogenases a re involved in plant devel opment
and senescence, reduc ing the concentration of toxic
amines during stress conditions, and providing hydrogen
peroxide for wall stiffening and lignification (Figure 3).
Table 1 Sequences of oligonucleotide primers used in the
study
Use Primer Sequence
Anchored Primer
DD10 5’-TTTTTTTTTTTG-3’
cDNA DD11 5’-TTTTTTTTTTTC-3’
DD12 5’-TTTTTTTTTTTA-3’
Arbitrary Primer
B-01 5’-GTTTCGCTCC-3’
B-02 5’-TGATCCCTGG-3’
B-03 5’-CATCCCCCTG-3’
B-04 5’-GGACTGGAGT-3’
B-05 5’-TGCGCCCTTC-3’
B-06 5’-TGCTCTGCCC-3’
B-07 5’-GGTGACGCAG-3’
B-08 5’-GTCCACACGG-3’
B-09 5’-TGGGGGACTC-3’
DDRT-PCR B-10 5’-CTGCTGGGAC-3’
B-11 5’-GTAGACCCGT-3’
B-12 5’-CCTTGACGCA-3’
B-13 5’-TTCCCCCGCT-3’
B-14 5’-TCCGCTCTGG-3’
B-15 5’-GGAGGGTGTT-3’
B-16 5’-TTTGCCCGGA-3’
B-17 5’-AGGGAACGAG-3’
B-18 5’-CCACAGCAGT-3’
B-19 5’-ACCCCCGAAG-3’
B-20 5’-GGACCCTTAC-3’
Table 2 Conclusion of relative quantification methods of differentially expressed genes at two and four days after
inoculation
DEG Length
bps
Identity Up/Down
regulation
SAA (287) S. lycopersicum WRKY transcription factor IId-1 splice Upregulated
SAB (231) Putative Rieske iron-sulfur protein [A. thaliana]Length = 539, Rieske iron-sulfur protein Tic55 [P. sativum]Length =
553
Upregulated
SAC (386) N. tabacum mitochondrial DNA, complete genome Length = 430597 NADH dehydrogenase subunit 1 NADH
dehydrogenase subunit 2, 846 bp at 5’ side:
Down regulated
SAD (262) Quinonprotein alcohol dehydrogenase like M. truncatula Upregulated
SA1 (442) Trigger factor (chaperone in protein export) Upregulated
SA2 (688) A. thaliana calmodulin-binding receptor-like kinase Upregulated
SA3 (772) Polyribonucleotide nucleotidyltransferase Upregulated
SA4 (283) Chromosomal replication initiator protein DnaA Down regulated
Andleeb et al. Virology Journal 2010, 7:373
/>Page 4 of 12
Analysis of DEGs identified at four days post infiltration
Several genes were also identified that were differentially
expressed at 4 dpi. DEG SA1 shows 99% nucleotide
sequence identity with trigger factor (chaperone in pro-
tein export) of P. acnes. It has been suggested that
molecular chaperones play a critical role in targeting
proteins to the mitochondria, are involved in Ca
+
dependent signaling pathway (Figure 3) and in the sub-
sequent fo lding of the imported protein [37-39]. It may
be very useful to analyze the interaction of bC1 with
chaperones through protein-protein interaction in
future. It has been shown that SA2 transcript belongs to
the primary calcium receptor called calmodulin (CaM;
Figure 3), which is a ubiquitous protein found in both
plants and animals [40]. It is located in cyt oplas mic and
nuclear compar tments and can be attached to the
plasma membrane in plant cells [41,42].
SA2 showed 72% nucleotide sequence identity with
A. thaliana calmodulin-binding receptor-like kinase 2
(CRCK2) and, interestingly, the expression of CRCK1 is
up-regulated by cold and salt stresses, as well as the
stress molecules ABA (abscisic acid) and hydrogen per-
oxide, suggesting that CRCK2 may be involved in osmo-
tic a nd oxidative stress signal transduction pathways in
plants [43]. It has been suggested that CRCK2 protein is
up regulated (Figure 2) during pathogen infection and
also regulates the activities of a wide range of CaM
binding proteins (CaMBPs), including metabolic
enzymes, transcription factors such as WRKY group II d
[44], ion channels, protein kinases/phosphatases and
structural proteins [45,46], as indicated in Figure 3.
Transcript SA3 showed 92% nucleotide sequence iden-
tity with the polynucleotide nucleotidyltransferase from
P. cryohalolentis K5 (PNPase; encoded by the pnp gene).
PNPase is an RNA binding protein, involved in post-
transcriptional gene silencing, participates in RNA
degradation [47] and plays a central role in adaptation
to growth at low temperature [48]. Previous studies
identified PNPase in eubacteria [49-51], Drosophila mel-
anogaster [52], plants [53,54], and even mice and
humans [55,56]. Here it has been identified in N. taba-
cum in the response of bC1 of ChLCB. SA4 shows 90%
nucleotide sequence identity with the chromosomal
replication initiator protein DnaA. bC1 induces cell pro-
liferation (enations) and a requirement for DnaA during
cell division is thus consistent with this finding.
Sequence analysis of the cloned DEGs showed 8 of
them to represent genes that have been previously char-
acterized (Table 5), while the remainder represent genes
of unknown function and hypothetical proteins pre-
dicted from sequence. All these genes are associated
with chloroplast and mitochondrial host compartments.
Table 3 Relative quantification methods of differentially expressed genes two days post inoculation
Genes Identity Relative
quantification
against Unit
mass
Relative quantification
Normalized to a reference
gene
Control Healthy Livak
method
ΔCT
Method
Pfaffi
Method
SAA S. lycopersicum WRKY transcription factor IId-1 splice 2.32 1.32 0.737C/
0.381H
0.942C/
0.838H
0.737C/
0.381H
SAB Putative Rieske iron-sulfur protein [A. thaliana]Length = 539, Rieske iron-sulfur protein
Tic55 [P. sativum]Length = 553
2.751 0.566 0.870C/
0.162H
0.972C/
0.728H
0.870C/
0.162H
SAC N. tabacum mitochondrial DNA, complete genome Length = 430597 NADH
dehydrogenase subunit 1 NADH dehydrogenase subunit 2, 846 bp at 5’ side
0.010 1.905 0.003C/
0.547H
-0.672C/
1.355H
0.003C/
0.547H
SAD Quinonprotein alcohol dehydrogenase like [M. truncatula] 5.205 0.829 1.647C/
0.238H
1.167C/
0.707H
1.647C/
0.238H
Table 4 Relative quantification methods of differentially expressed genes four days post inoculation
Gene Identity Relative quantification against
Unit mass
Relative quantification normalized to a reference
gene
Control Healthy Livak method ΔCT Method Pfaffi Method
SA1 Trigger factor (chaperone in protein export) 2.88 17.75 1.443C/7.727H 1.08C/1.74H 1.443C/7.727H
SA2 A. thaliana calmodulin-binding receptor-like kinase 3.759 3.759 8.564 - 8.564
SA3 Polyribonucleotide nucleotidyltransferase 1.32 1.70 0.664C/0.742H 0.790C/.837H 0.664C/0.742H
SA4 Chromosomal replication initiator protein DnaA 0.659 0.882 0.329C/0.253H 0.674C/0.706H 0.329C/0.253H
Andleeb et al. Virology Journal 2010, 7:373
/>Page 5 of 12
The results suggest that the DEGs identified i n
response to bC1 are involved in multiple pathways; oxi-
dative stress signaling, Ca+ dependent signaling, salicylic
acid signaling pathways (Figure 3). Interestingly, these
DEGs are related to specific cellul ar compartments,
mitochondria and chloroplasts (Figure 3), where they
act as electron carrier for respiration and photosynthesis
by ATP synthesis (Figure 3). Collectively these genes
perform their roles in plant growth and development,
detoxification responses, cell protection and defense
against invading viral proteins or pathogen (Figure 3).
Analysis of DEGs using KOBAS
The DEGs responsive to ChLCB bC1 were analyzed
using the KEGG orthology (KO) system, also called
KOBAS (KO Based Annotation System). This showed
that polyribonucleotide nucleotidyltransferase is involved
in the purine and pyrimidine metabolic pathways
(Table 6 and 7). These finding suggest that bC1 interact
with host genes in such a manner to increase the
amount of purines and pyrimidines in the cells and this
is required for cell division which is induced by bC1.
Conclusions
From all these related results it has been concluded that
the DEGs in the response of bC1 of ChLCB under 35S
cauliflower promoter are related to the chloroplast and
mitochondria and are involved in the ATP synthesis, act
as electron carriers for respiration and photosynthesis
processes. These DEGs play an important role in plant
growth and development, cell protection, de fence pro-
cesses, replication mechanisms and detoxification
responses as illustrated in Figure 3.
Methods
Cloning of bC1 of Chilli leaf curl betasatellite in pJIT163
The bC1 of ChLCB was cloned under the control of the
cauliflower mosaic virus 35S promoter in the pJIT163
plant expression vector. A set of primers (ChbC135S(F)
5’-GCAAGCTTATGCACCACGTATATGAATTATGTC
C-3’ /Ch bC135S(R) 5’- GCGAATTCTCACACACACA-
CATTCGTACATAC-3’ ;havingEcoRI and HindIII
restriction sites, respectively) were designed to the
reported sequence (accession no. AJ316032) to amplify
a 450 bp DNA fragment containing the ChLCB bC1
gene. The fragment was amplified with an initial 94°C
for 5 min followed by 30 cycles of 94°C for 1 min, 50°C
for 1 min, 72°C for 1 min. A final extensi on at 72°C for
10 min was included. The amplification product was
analyzed by 1% agarose gel electrophoresis. The ampli-
fied fragment and pJIT163 vector were restricted with
EcoRI and HindIII restriction enzymes at 37°C over-
night, precipitated with phenol-chloroform and ligated
at 16°C overnight. The ligated product was transformed
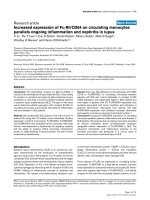
Figure 2 Quantitative real time RT-PCR analysis of DEGs identified in response to bC1 at two and four days after infiltration of N.
tabacum. SA1, SA2, SA3, SA4, SAA, SAB, SAC and SAD test samples with color indication represent the up and down regulation of differentially
expressed genes as compared to calibrator having only pGreen0029 vector (SA1C, SA3C, SA4C, SAAC, SABC, SACC, SADC) and another healthy
calibrator (A1H, A3H, A4H, HA, HB, HC and HD). In both (A) and (B) R stand for reference gene and T for test samples.
Andleeb et al. Virology Journal 2010, 7:373
/>Page 6 of 12
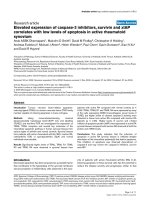
Figure 3 Schematic pathway showing the involvemen t of the diff erentially expressed genes (DE Gs) in signal transduction pathways.
DEGs isolated from N. tabacum at two and four days after infiltration in response of bC1 are involved in different pathways during host protein
interactions and also segregate in specific cellular compartments. Chaperons, CRCK2 and WRKY transcription factors involved in Ca
+
dependent
signalling, salicylic acid signalling, osmotic and oxidative stress signalling and pathogen defence signalling pathways. In contrast, NADH, Reisky
iron sulphur protein and quinone protein are related to mitochondrial and chloroplast sysstems and act as electro carriers for respiration,
photosynthesis by ATP synthesis. The collective role of these DEGs are in defence, cell protection, respiration, photosynthesis, detoxification, plant
growth and development.
Table 5 Differentially expressed genes (DEGs) and their identities
DEG Length of
amplified
fragment
Identity Accession
No.
Identity
Genes differentially expressed at two days after inoculation
SAA 287 S. lycopersicum WRKY transcription factor IId-1 splice AY157059 (76%)
SAB 231 Putative Rieske iron-sulfur protein [A. thaliana]Length = 539, Rieske iron-sulfur protein Tic55 [P.
sativum] Length = 553
NM128041
AJ000520
(68%)/
(73%)
SAC 386 N. tabacum mitochondrial DNA, complete genome Length = 430597: NADH dehydrogenase
subunit 1 and NADH dehydrogenase subunit 2, 846 bp at 5’ side
BA000042 (93%)
SAD 262 Quinonprotein alcohol dehydrogenase like [M. truncatula] ABE84009
ABE86610
(47%)
Genes differentially expressed at four days after inoculation
SA1 442 Trigger factor (Chaperone protein) AE017283 (99%)
SA2 688 A. thaliana calmodulin-binding receptor-like kinase 2 (CRCK2) NM116255 (72%)
SA3 772 Polyribonucleotide nucleotidyltransferase CP000323 (92%)
SA4 263 Chromosomal replication initiator protein DnaA CP000653 (90%)
Andleeb et al. Virology Journal 2010, 7:373
/>Page 7 of 12
into E. coli 10b. The transformation mixture was then
spread on 100 mg/ml LB ampicillin petri plates after
incubation for one h a t 37°C. Plates were incubated
overnight at 37°C and the next day colonies were cul-
tured in LB containing ampicillin and placed overnight
in a shaking water bath at 3 7°C. Plasmid isolation from
cultures was performed by miniprep method and
recombinant clone was confirmed by digestion with
EcoRI and Hi ndIII. The resultant recombinant clone
was named pSA bC135S.
Transfer of expression cassette to binary vector and
transformation of Agrobacterium tumefaciens
pSAbC135S and pGreen0029 were restricted with XhoI
and XbaI endonuclease, ethanol precipitated and
ligated at 16°C for 18 h. T his was used for transforma-
tion into E. coli and colonies were confirmed by
restriction analysis. Both pGreen0029 and pGreen0029
containing the expression cassette were transformed
into Agrobacterium tumefaciens strain (GV 3101) by
electroporation. The transformation mixture was then
spread on LB medium plates containing 50 μg/ml of
kanamyci n, 25 μg/ml of rifampicin and 100 μg/ml tet-
racycline antibiotics, after a one hour incubation at 28°
C. Plates were incubated at 28°C until colonies
appeared. After 48 hours, colonies were grown in LB
liquid medium containing 50 μg/ml of kanamycin, 25
μg/ml of rifampicin and 100 μg/ml tetracycline, and
placed at 28°C for 48 h. The transformants were con-
firmed by PCR analysis using the primers ChbC135S
(F)/ChbC135S(R).
Agroinfiltration of plants
Agrobacterium cultures were grown at 28°C for 48 h in
liquid LB medium containing 50 μg/ml of kanamycin
and 25 μg/ml of rifampicin. The bacterial cells were pel-
leted at 4000 rpm for 10 min at 20°C and resuspended
in 10 mM MgCl
2
and 150 μgofacetosyringoneperml.
After a three hour incubation cells were infiltrated into
young, fully expanded leaves of 4 week- old N. tabacum
plants using a 5 ml syringe.
Isolation of messenger RNA and cDNA synthesis
Infiltrated of N. tabacum leaves infiltrated with
pGreen0029 and pGreen0029 containing the bC1 expres-
sion cassette were collected two and four days after inocu-
lation in liquid nitrogen. Total RNA was extracted using
Trizol reagent (Inv itrogen, USA ) following the manufac-
turer’s instructions. The integrity and purity of total RNA
isolated from infected leaf samples was assessed by elec-
trophoresis on 1% agarose gels. The messenger RNA was
isolated from total RNA using oligo (dT) cellulose col-
umns (MRC, USA) according to the manufacturer’s
instructions. The loaded columns were washed with bind-
ing buffer and mRNA was eluted. The eluted mRN A was
precipitated and dissolved in DEPC treated water. Messen-
ger RNA resulting from two and four days post infiltration
samples were reverse transcribed to cDNA using Revert
Aid H- First Strand cDNA synthesis kit, (Fermentas,
USA). Three reverse transcription reactions were carried
out for each mRNA using three different anchored
(T11M) primers (where M may be G, C or A). The pro-
ducts of reverse transcriptions (cDNA) were stored at -20°
C for differential display PCR amplifications.
Differential display analysis
PCR amplification of each cDNA (synthesized from
mRNA isolated from two and four days post inoculat ion
samples) was carried out in combination with one of the
three anchored primers and one of the twenty arbitrary
Table 7 Summary of purine and pyrimidine metabolic pathways of Polynucleotide nucleotidyl transferase
Query gene Pathway Count and ratio p-value q-value Web site
SA3 Pyrimidine metabolism 1/100% 44/1.53% 0.0153417015342 0.023709902371 /> />
/>SA3 Purine metabolism 1/100% 68/2.37% 0.023709902371 0.023709902371
Table 4 described the first column shows the name of the pathway. The second column lists the number and percentage of input genes or proteins involved in
the pathway (top red in color) and the number and percentage of background genes or proteins involved in the pathway (bottom green in color). The third and
fourth columns list the p-value and q-value of the statistical significance, respectively. Purine and pyrimidine metabolic pathways of (SA3) polynucleotide
nucleotidyltransferase that is an RNA binding protein and involved in RNA degradation.
Table 6 Result analysis of DEGs through KOBAS; KO Based Annotation System for the pathway identification
Sequence identifier KO term KO definition Rank E-value Score Identity (%) Blast hit
SA3 K00962 Polyribonucleotide nucleotidyltransferase 1 1e-111 404.0 96.64 Pcr. Pcryo 0080
Each row corresponds to a query DNA or protein input by the user. The first column contains sequence identifier extracted from the input. The second column
contains the assigned KO terms hyperlinked to detailed description in KEGG. The third column contai ns KO term definition that this protein sequence belongs to
this available protein in this program. The fourth to seventh columns shows the rank, e-value, score and identity of the BLAST hit. The last column contains the
gene ID of the hit hyperlinked to the KEGG GENES dat aset database.
Andleeb et al. Virology Journal 2010, 7:373
/>Page 8 of 12
primers of the B-Series (as indicated in Table 1), provid-
ing 60 combinations in case of four days post inoculation
and 29 combinations in the case of two days post inocu-
lation. PCR was carried out in a final reaction volume of
50 μlcontaining2.5μl(100ng/μland10ng/μl) of first
strand cDNA, 5 μl of 10× PCR buffer, 4 μ lMgCl
2
(25 mM), 1 μl of dNTPs (10 mM each), 2 μlofanchord
primer (250 ng/μl), 8 μl of arbitrary primer (100 ng/μl),
0.5 μlofTaq DNA Polymerase (5 U/μl; Fermentas, USA),
27 μl double distilled H
2
O. The PCR amplification proto-
col included first cycle at 94°C for 4 min followed by
45 cy cles of 36°C for 2 min, 72°C for 1 min, 94°C for
1 min; and a final extension step at 72°C for 10 min. The
amplified PCR pr oducts were resol ved on 1% agarose gel
and stained with ethidium bromide.
Cloning and sequencing of differentially expressed genes
(DEGs)
The differentially expressed bands were excised from the
gel and extracted by QIAGEN gel extraction kit and
DNA extraction kit (MBI, Fermentas). The eluted bands
were ligated into pTZ57RT, and transformed into E. coli
TOP 10 by the heat shocked method. Plasmid DNA was
isolated using the miniprep method and clones were
confirmed by restriction analysis using EcoRI and PstI
restriction enzymes. Purified clones were sequenced
using M13 (-20) forward and M13 (-26) reverse primers
and BigDye terminator v 3.1 ABI Prism 310 Genetic
analyzer (Applied Biosystems, USA) as decribed by the
manufacturer. Sequence information was stored,
assembled and analysed using the Lasergene sequence
Table 8 After two days differentially expressed genes (DEGs) primer sequences for quantitative real time PCR
Name of genes Sequences of primers MERS
Primer sequences two days post inoculation of bC1 of ChLCB for Q-RTPCR analysis
SAA SAA F: GAGACCCGGGATGTCCTGGCAAGAAAGCAT (30 MERS)
SAAQPCR:AATTACAAAAGAGCCCCTAAATCCCTAAGC (30 MERS)
SAA F2: GGAGAGGGCAACCGATGA (18 MERS)
SAA QPCR2: CCCCTAAATCCCTAAGC (17 MERS)
SAA F3: GGGACGATCGCCGGCGCCGG (20 MERS)
SAA QPCR3: TCACTACCCACCGTATC (17 MERS)
SAB SAB F: AATCCCCGGGATGTATGCTCCGAATCCCGC (30 MERS)
SABQPCR:CATAGTGATGTCGAAAGCAAAAGTAGGGCC (30 MERS)
SAB F2: GTATGCTCCGAATCCCG (17 MERS)
SAB QPCR2: CAAAAGTAGGGCCTTCC (17 MERS)
SAB F3: CCAGCTAAGGGAGGAATC (18 MERS)
SAB QPCR3: GGCCTTCCACTGTCTTCCTG (20 MERS)
SAC SAC F: TCCCCCCGGGATGTTTCAGGTTCACATGAA (30 MERS)
SACQPCR:TAGGCTATAGGTGGGGGACAATGTAGACTG (30 MERS)
SAC F2: CACAACACGACTCCCTAC (18 MERS)
SAC QPCR2: GAAGTTGGGCCCACCTG (17 MERS)
SAC F3: CTCCACGAGTCTTCATCCCC (20 MERS)
SAC QPCR3: CCGAGATCGAGAGCTTTC (18 MERS)
SAD SA D F; GGTGCCCGGGATGGCAGATCAGTGGAGTTG (30 MERS)
SADQPCR: GATTAGGTTCCCGTAGATAGATGCATAACC (30 MERS)
SAD F2: AAGTTCTAATTCGGAGGG (18 MERS)
SAD QPCR2: TAGATAGATGCATAA (17 MERS)
SAD F3: GTTAGCTTACTTAAACAG (20 MERS)
SAD QPCR3: TAGATGCATAACC (17 MERS)
Andleeb et al. Virology Journal 2010, 7:373
/>Page 9 of 12
analysis package (DNAStar Inc., Madison, WI, USA)
running on an IBM compatible PC.
Analysis of DEGs using NCBI, KOBAS and RT-PCR
The nucleotide sequences were analyzed using BLAST;
for blastn a nd blastx algorithms in NCBI. Clusters of
orthologus group of proteins were identified at NCBI
http://w ww.ncbi.nlm.nih.gov/Blast.cgi and KEGG orthol-
ogy Real time quantitative PCR
was performed to analyse expression of DEGs in relation
to a reference gene and the calibrators at a constant
level of fluorescence. These were calculated with Delta
Delta (Ct), Livak and the Pfaffi mathematical models of
quantitativ e real time PCR method [57,58]. For RT-PCR
each sample was used in triplicate and the experiment
was repeated three times to confirm the reproducibility
of result. The sequences of RT-PCR primers are shown
in Table 8 and 9.
Acknowledgements
The work was supported by a Ministry of Science and Technology (MoST)
project. R.W.B. is supported by the Higher Education Commission (Pakistan)
under the “Foreign Faculty Hiring Program”.
Authors’ contributions
SA conducted all the experimental work and drafted the manuscript. AB and
IA helped in the RT-PCR and DD-PCR analysis. SM and RWB together
designed the experiments. IA and SM had proof-read and finalized the
manuscript. All authors read and approved the final manuscript.
Competing interests
The authors declare that they have no competing interests.
Received: 10 October 2010 Accepted: 30 December 2010
Published: 30 December 2010
Table 9 After four days differentially expressed genes (DEGs) primer sequences for quantitative real time PCR
Name of genes Sequences of primers MERS
Primer sequences four days post inoculation of bC1 of ChLCB for Q-RTPCR analysis
SA1 SA1 F: GTCACCCGGGATGTGACGCCGACGGTCAAT (30 MERS)
SA1 QPCR: GGGCCGCACCATGGTCCTGCTGACTTACCG (30 MERS)
SA1 F2: GACGGTCAATCCATGTAT (18 MERS)
SA1 QPCR2: GGTGTCAGGAGACCCCTTCCA (17 MERS)
SA1 F3: GGTAGAGCCCCAGTCTTCCA (20 MERS)
SA1 QPCR3: GCACCCGCCCAACTCCACGG (17 MERS)
SA2 SA2 F: AATACCCGGGATGATAAACATTTGGGGG (30 MERS)
SA2 QPCR: CCAATGTCTAGTCTTGATGCAAAATCAA (30 MERS)
SA2 F2: CTAGTAAAGTTTTATGGATTCTTGGA (17 MERS)
SA2 QPCR2: ATGGATAATAGGGTGATCAGT (17 MERS)
SA2 F3: CACTTGGACTGTGGTCCTG (18 MERS)
SA2 QPCR3: GTCAGCCACCTTAGCTCG (20 MERS)
SA3 SA3 F: CGCGCCCGGGATGCATCTAGATTGTCCACA (30 MERS)
SA3 QPCR: TCAATCAGACGCGAGGTTAAGGTTTCAGAC (30 MERS)
SA3 F2: GAAGGCTATGTAAACGAG (18 MERS)
SA3 QPCR2: GCTCTTCAAGGGTCGGGTTCAG (17 MERS)
SA3 F3: GACTTGGTCGTCGCTGGTA (20 MERS)
SA3 QPCR3: GCTTGATCGCGTACAGG (18 MERS)
SA4 SA4 F: GCGACCCGGGAtGCATCTAGATTTGGGGGA (30 MERS)
SA4 QPCR: AGAAACAGAAGATCTCTGGCTCAGTTTAGG (30 MERS)
SA4 F2: TTCATGATTGTTGGCGCAC (18 MERS)
SA4 QPCR2: CTGATCTTCCTGTGGA (17 MERS)
SA4 F3: CGGCATGACCCTGTGTAA (20 MERS)
SA4 QPCR: GGGGGACTCGCGCCAGG (17 MERS)
Andleeb et al. Virology Journal 2010, 7:373
/>Page 10 of 12
References
1. Hanley-Bowdoin L, Settlage SB, Orozco BM, Nagar S, Robertson D:
Geminviruses: models for plant DNA replication, transcription, and cell
cycle regulation. Crit Rev Plant Sci 1999, 18:71-106.
2. Laufs J, Traut W, Heyraud F, Matzeit V, Rogers SG, Schell J, Gronenborn B: In
vitro cleavage and joining at the viral origin of replication by the
replication initiator protein of tomato yellow leaf curl virus. Proc Natl
Acad Sci USA 1995, 92:3879-3883.
3. Mansoor S, Briddon RW, Zafar Y, Stanley J: Geminivirus disease complexes:
an emerging threat. Trends Plant Sci 2003, 8:128-134.
4. Saunders K, Bedford ID, Yahara T, Stanley J: The earliest recorded plant
virus disease. Nature 2003, 422:831.
5. Saeed M, Behjatnia SA, Mansoor S, Zafar Y, Hasnain S, Rezaian MA: A single
complementary-sense transcript of a geminiviral DNA β satellite is
determinant of pathogenicity. Mol Plant Microbe Interact 2005, 18:7-14.
6. Saunders K, Bedford ID, Briddon RW, Markham PG, Wong SM, Stanley J: A
unique virus complex causes Ageratum yellow vein disease. Proc Natl
Acad Sci USA 2000, 97:6890-6895.
7. Zhou X, Xie Y, Peng Y, Zhang Z: Malvastrum yellow vein virus, a new
Begomovirus species associated with satellite DNA molecule. Chi Sci Bull
2003, 48:2205-2209.
8. Hussain M, Mansoor S, Amin I, Iram S, Zafar Y, Malik KA, Briddon RW: First
report of cotton leaf curl disease affecting chili peppers. Plant Pathol
2003, 56:906.
9. Briddon RW, Bull SE, Amin I, Idris AM, Mansoor S, Bedford ID, Dhawan P,
Rishi N, Siwatch SS, Abdel-Salam AM, Brown JK, Zafar Y, Markham PG:
Diversity of DNA β, a satellite molecule associated with some
monopartite begomoviruses. Virology 2003, 312:106-121.
10. Qazi J, Amin I, Mansoor S, Iqbal MJ, Briddon RW: Contribution of the
satellite encoded gene βC1 to cotton leaf curl disease symptoms. Virus
Res 2007, 128:135-139.
11. Soosaar JL, Burch-Smith TM, Dinesh-Kumar SP: Mechanisms of plant
resistance to viruses. Nat Rev Microbiol 2005, 3:789-798.
12. Huang Z, Yeakley JM, Garcia EW, Holdridge JD, Fan JB, Whitham SA:
Salicylic acid-dependent expression of host genes in compatible
Arabidopsis-virus interactions. Plant Physiol 2005, 137:1147-1149.
13. Sui C, Fan Z, Wong SM, Li H: Cloning of cDNAs encoding the three
subunits of oxygen evolving complex in Nicotiana benthamiana
and
gene
expression changes in tobacco leaves infected with Tobacco
mosaic virus. Physiol Mol Plant Pathol 2006, 68:61-68.
14. Havelda Z, Maule AJ: Complex spatial responses to cucumber mosaic
virus infection in susceptible Cucurbita pepo cotyledons. Plant Cell 2000,
12:1975-1986.
15. Kang BC, Yeam I, Jahn MM: Genetics of plant virus resistance. Annu Rev
Phyto 2005, 43:581-621.
16. Liang P, Pardee AB: Differential display of eukaryotic messenger RNA by
means of the polymerase chain reaction. Science 1992, 257:967-971.
17. Yun-Jee KIM, Chae-ll KWAK, Young-Yun GU, In-Taek H, Chun Jong-
Yoon: Annealing control primer system for identif ication of
differentially expressed genes o n agarose gels. BioTechniques 2004,
36:424-434.
18. Crauwels M, Winderickx J, de Winde JH, Thevelein JM: Identification of
genes with nutrient-controlled expression by PCR-mapping in the yeast
Saccharomyces cerevisiae Yeast 1997, 13:973-984.
19. Gross C, Watson K: Application of mRNA differential display to
investigate gene expression in thermotolerant cells of Saccharomyces
cerevisiae Yeast 1998, 14:431-442.
20. Tawe WN, Eschbach ML, Walter RD, Henkle-Duhrsen K: Identification of
stress-responsive genes in Caenorhabditis elegans using RT-PCR
differential display. Nucleic Acids Res 1998, 26:1621-1627.
21. Cui X, Li G, Wang D, Hu D, Zhou X: A begomovirus DNA β encoded
protein binds DNA, functions as a suppressor of RNA silencing, and
targets the cell nucleus. J Virol 2005, 79:10764-10775.
22. Gopal P, Pravin Kumar P, Sinilal B, Jose J, Kasin Yadunandam A, Usha R:
Differential roles of C4 and βC1 in mediating suppression of post-
transcriptional gene silencing: evidence for transactivation by the C2 of
Bhendi yellow vein mosaic virus, a monopartite begomovirus. Virus Res
2007, 123:9-18.
23. Saunders K, Norman A, Gucciardo S, Stanley J: The DNA β satellite
component associated with ageratum yellow vein disease encodes an
essential pathogenicity protein (βC1). Virology 2004, 324:37-47.
24. Briddon RW, Mansoor S, Bedford ID, Pinner MS, Saunders K, Stanley J,
Zafar Y, Malik KA, Markham PG: Identification of DNA components
required for induction of cotton leaf curl disease. Virology 2001,
285:234-243.
25.
Jose J, Usha R: Bhendi yellow vein mosaic disease in India is caused by
association of a DNA β satellite with a begomovirus. Virology 2003,
305:310-317.
26. Sharma P, Matsuda N, Bajet NB, Ikegami M: Molecular analysis of new
isolates of Tomato leaf curl Philippines virus and an associated
betasatellite occurring in the Philippines. Arch Virol 2010, DOI: 10.1007/
s00705-010-0837-3.
27. Zhang Y, Fan W, Kinkema M, Li X, Dong X: Interaction of NPR1 with basic
leucine zipper protein transcription factors that bind sequences required
for salicylic acid induction of the PR-1 gene. Proc Natl Acad Sci USA 1999,
96:6523-6528.
28. Eulgem T, Rushton PJ, Robatzek S, Somssich IE: The WRKY superfamily of
plant transcription factors. Trends Plant Sci 2000, 5:199-206.
29. Chen C, Chen Z: Isolation and characterization of two pathogen- and
salicylic acid-induced genes encoding WRKY DNA-binding proteins from
tobacco. Plant Mol Biol 2000, 42:387-396.
30. Vandenabeele S, Van der Kelen K, Dat J, Gadjev I, Boonefaes T, Morsa S,
Rottiers P, Slooten L, Van Montagu M, Zabeau M, et al: A comprehensive
analysis of hydrogen peroxide-induced gene expression in tobacco. Proc
Natl Acad Sci USA 2003, 100:16113-16118.
31. Rieske JS, Zaugg WS, Hansen RE: Studies on the electron transfer system.
LIX. Distribution of iron and of the component giving an electron
paramagnetic resonance signal at g = 1.90 in subfractions of complex
111. J Biol Chem 1964, 239:3023-3030.
32. Beckmann JD, Ljungdahl PO, Trumpower BL: Mutational analysis of the
mitochondrial Rieske iron-sulfur protein of Sacchammyces cerevisiae.1.
Construction of a RlPl deletion strain and isolation of temperature-
sensitive mutants. J Biol Chem 1989, 264:3713-3722.
33. Trumpower BL, Edwards CA: Purification of a reconstitutively active
iron-sulfur protein (oxidation-factor) from succinate-cytochrome c
reductase complex of bovine heart mitochondria. JBiolChem1979,
254:8697-8706.
34. Huang J, Struck F, Matzinger DF, Levings CS: Functional analysis in yeast
of cDNA coding for the mitochondrial Rieske iron-sulfur protein of
higher plants. Proc Natl Acad Sci USA 1991, 88:10716-10720.
35. Burrows PA, Sazanov LA, Svab Z, Maliga P, Nixon PJ: Identification of a
functional respiratory complex in chloroplasts through analysis of
tobacco mutants containing disrupted plastid ndh genes. EMBO J 1998,
17:868-876.
36. Sazanov LA, Burrows PA, Nixon PJ: The plastid ndh gene code for an
NADH-specific dehyd rogenase: Isolation of a complex I analogue
from peathylak oid membranes.
Proc Natl Acad Sci USA 199
8,
95:1319-1324.
37. Horst M, Oppliger W, Rospert S, Schonfeld HJ, Schatz G, Azem A:
Sequential action of two Hsp70 complexes during protein import into
mitochondria. EMBO J 1997, 16:1842-1849.
38. Neupert W: Protein import into mitochondria. Annu Rev Biochem 1997,
66:863-917.
39. Ryan MT, Naylor DJ, Hoj PB, Clark MS, Hoogenraad NJ: The role of
molecular chaperones in mitochondrial protein import and folding. Int
Rev Cytol 1997, 174:127-193.
40. Zielinski RE: Calmodulin and calmodulin binding proteins in plants. Annu
Rev Plant Physiol Plant Mol Biol 1998, 46:697-725.
41. White PJ, Broadley MR: Calcium in plants. Ann Bot 2003, 92:487-511.
42. Trewavas A: Signal perception and transduction. In BB Buchanan, W
Gruissem, RL Jones, eds, Biochemistry and molecular biology of plants.
American Society of Plant Biologists Rockville 2000, 1:962-973.
43. Yang T, Chaudhuri S, Yang L, Chen Y, Poovaiah BW: Calcium/calmodulin
up-regulates a cytoplasmic receptor-like kinase in plants. J Biol Chem
2004, 279:42552-42559.
44. Chan YP, Lee JH, Yoo JH, Moo BC, Choi MS, Kang YH, Lee SM, Kim HS,
Kang KY, Chung WS, Lim CO, Cho MJ: WRKY group IId transcription
factors interact with calmodulin. FEBS Lett 2005, 579:1545-1550.
45. Snedden W, Fromm H: Calmodulin as a versatile calcium signal
transducer in plants. New Physiologist 2001, 151:35-66.
46. Hoeflich KP, Ikuru M: Calmodulin in action: diversity in target recognition
and activation mechanisms. Cell 2002, 108:739-742.
Andleeb et al. Virology Journal 2010, 7:373
/>Page 11 of 12
47. Bernstein JA, Lin PH, Cohen SN, Lin-Chao S: Global analysis of Escherichia
coli RNA degradosome function using DNA microarrays. Proc Natl Acad
Sci USA 2004, 101:2758-2763.
48. Yamanaka K, Inouye M: Selective mRNA degradation by polynucleotide
phosphorylase in cold shock adaptation in Escherichia coli. J Bacteriol
2001, 183:2808-2816.
49. Favaro R, Deho G: Polynucleotide phosphorylase-deficient mutants of
Pseudomonas putida. J Bacteriol 2003, 185:5279-5286.
50. Goverde RL, Huisin’t Veld JH, Kusters JG, Mooi FR: The psychrotrophic
bacterium Yersinia enterocolitica requires expression of pnp, the gene
for polynucleotide phosphorylase, for growth at low temperature (5°C).
Mol Microbiol 1998, 28:555-569.
51. Symmons MF, Jones GH, Luisi BF: A duplicated fold is the structural basis
for polynucleotide phosphorylase catalytic activity, processivity, and
regulation. Structure Fold Des 2000, 8:1215-1226.
52. Leszczyniecka M, DeSalle R, Kang DC, Fisher PB: The origin of
polynucleotide phosphorylase domains. Mol Phylogenet Evol 2004,
31:123-130.
53. Kudla J, Hayes R, Gruissem W: Polyadenylation accelerates degradation of
chloroplast mRNA. EMBO J 1996, 15:7137-7146.
54. Yehudai-Resheff S, Hirsh M, Schuster G: Polynucleotide phosphorylase
functions as both an exonuclease and a poly(A) polymerase in spinach
chloroplasts. Mol Cell Biol 2001, 21:5408-5416.
55. Leszczyniecka M, Kang DC, Sarkar D, Su ZZ, Holmes M, Valerie K, Fisher PB:
Identification and cloning of human polynucleotide phosphorylase,
hPNPase old-35, in the context of terminal differentiation and cellular
senescence. Proc Natl Acad Sci USA 2002, 99:16636-16641.
56. Sarkar D, Leszczyniecka M, Kang DC, Lebedeva IV, Valerie K, Dhar K,
Pandita S, Fisher PB: Down-regulation of Myc as a potential target for
growth arrest induced by human polynucleotide phosphorylase
(hPNPaseold-35) in human melanoma cells. J Biol Chem 2003,
278:24542-24551.
57. Pfaffi MW, Hageleit M: Validities of mRNA quantification using
recombinant RNA and recombinant DNA external calibration curves in
real time RT-PCR. Biotechnol Lett 2001, 23:275-282.
58. Michael WP: A new mathematical model for relative quantification in
real time RT-PCR. Nucleic Acids Res 2001, 29:2001-2007.
doi:10.1186/1743-422X-7-373
Cite this article as: Andleeb et al.: Transient expression of b C1 protein
differentially regulates host genes related to stress response,
chloroplast and mitochondrial functions. Virology Journal 2010 7:373.
Submit your next manuscript to BioMed Central
and take full advantage of:
• Convenient online submission
• Thorough peer review
• No space constraints or color figure charges
• Immediate publication on acceptance
• Inclusion in PubMed, CAS, Scopus and Google Scholar
• Research which is freely available for redistribution
Submit your manuscript at
www.biomedcentral.com/submit
Andleeb et al. Virology Journal 2010, 7:373
/>Page 12 of 12