Rubber Compounding - Chemistry and Applications Part 7 docx
Bạn đang xem bản rút gọn của tài liệu. Xem và tải ngay bản đầy đủ của tài liệu tại đây (1.31 MB, 46 trang )
6
Carbon Black
Wesley A. Wampler, Thomas F. Carlson,
and William R. Jones
Sid Richardson Carbon Company, Fort Worth, Texas, U.S.A.
I. INTRODUCTION
Carbon black is produced by the incomplete combustion of organic sub-
stances, probably first noted in ancient times by observing the deposits of a
black substance on objects close to a burning material. Its first applications
were no doubt as a black pigment, and the first reported use was a colorant in
inks by the Chinese and Hindus in the third century A.D. (1). It was not until
the early twentieth century when carbon black was first mixed into rubber that
its possible usefulness in this area was explored. The fact that carbon black
has the ability to significantly improve the physical properties of rubber (often
referred to as reinforcement) has provided its largest market today, i.e., the
tire industry. Currently about 5 million metric tons of carbon black is used
worldwide in tires annually (2). A typical tire contains 30–35% carbon black,
and there are normally several grades of carbon black in the tire, depending
on the reinforcement requirements of the particular component of the tire. Of
course, carbon black is also used in many non-tire rubber applications owing
to its ability to reinforce the rubber and to its use as a cost reduction diluent in
the compound. Non-tire rubber products currently require about 2 million
metric tons of carbon black annually on a worldwide basis (2).
This chapter brings the reader up to date on how carbon black is
manufactured, how its quality is controlled, how the carbon black character-
istics influence rubber properties, and how the different grades of carbon
black are classified and used, then finally presents a review of carbon black
surface chemistry and how the modification of these surfaces holds substan-
tial promise for future developments.
4871-9_Rodgers_Ch06_R2_052404
MD: RODGERS, JOB: 03286, PAGE: 239
Copyright © 2004 by Taylor & Francis
II. DEFINITIONS
Before beginning there is merit in reviewing some basic definitions in carbon
black technology. Although it is not attempted to present a comprehensive list
of definitions, several important ones will be given, and the reader is referred
to ASTM D 3053 for additional carbon black terminology (3).
Carbon black Material consisting essentially of elemental carbon in
the form of near-spherical particles coalesced into aggregates of col-
loidal size, obtained by incomplete combustion or thermal decom-
position of hydrocarbons.
Carbon black particle A small spheroidal nondiscrete component of a
carbon black aggregate. Particle diameters can range from less than
20 nm in some furnace grades to a few hundred nanometers in ther-
mal blacks.
Carbon black aggregate A discrete, rigid, colloidal entity of coalesced
particles; the smallest dispersible unit of carbon black. Aggregate
dimensions measured by the Feret diameter method can range from
as small as 100 nm to a few micrometers.
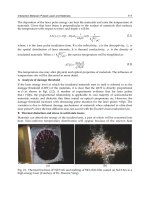
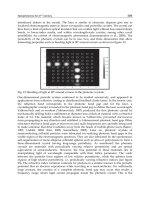
Figure 1 shows the distinction between a particle and an aggregate in carbon
black.
Carbon black agglomerate A cluster of physically bound and en-
tangled aggregates. Agglomerates can vary widely in size from less
than a micrometer to a few millimeters in the pellet.
Figure 1 (Left) Carbon black aggregate as viewed by transmission electron mi-
croscopy and (right) a schematic showing the distinction between carbon black par-
ticles and the aggregate. (Photograph by David Roberts.)
4871-9_Rodgers_Ch06_R2_052404
MD: RODGERS, JOB: 03286, PAGE: 240
Copyright © 2004 by Taylor & Francis
Carbon black pellet A relatively large agglomerate that has been den-
sified in spheroidal form to facilitate handling and processing.
Pellets range in diameter from tenths of a millimeter to 2–3 mm.
Carbon black structure The degree of irregularity and deviation from
sphericity of the shape of a carbon black aggregate. It is typically
evaluated by absorption measurements that determine the voids
between the aggregates and agglomerates and thus indirectly the
branching and complexity of shape of the carbon black aggregates
and agglomerates.
Carbon black specific surface area The available surface area in
square meters per unit mass of carbon black in grams. Typically the
adsorption of molecules such as iodine or nitrogen is measured and
then either the amount adsorbed per unit mass is reported or a
specific surface area is calculated based on current adsorption
theories.
III. THE CARBON BLACK MANUFACTURING PROCESS
The carbon black manufacturing process consists of several distinct segments.
Each segment is important for ensuring economical production and for
meeting customer expectations.
1. Reaction
2. Filtration/separation
3. Pelletizing
4. Drying
Each segment could be discussed in exhaustive detail, but the purpose
here is to furnish a short description that allows a working knowledge of how
carbon black is produced and how the manufacturing process can affect
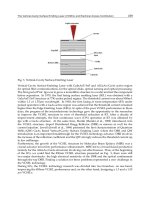
customer applications. Figure 2 shows the furnace process schematically.
A. Reaction
There are two main production processes for rubber grade carbon black: the
furnace process and the thermal process. However, the furnace process is by
far the more dominant process today.
1. Furnace Process
There are two broad categories within the furnace carbon blacks: tread and
carcass. The processes for manufacturing the two are very similar in most
4871-9_Rodgers_Ch06_R2_052404
MD: RODGERS, JOB: 03286, PAGE: 241
Copyright © 2004 by Taylor & Francis
respects, the main differences being that carcass carbon black (used mainly in
tire carcasses, sidewalls, and other semireinforcing applications) is made at
lower temperatures, lower reaction velocities, and with longer residence times
than tread carbon blacks. Tread blacks are used in tire treads and in areas
where higher levels of reinforcement are needed. Because of these differences
in reaction kinetics, carcass carbon blacks are lower in specific surface area
than tread blacks.
Carbon black is formed very quickly and at very high temperatures
typically generated from the combustion of natural gas with air but with
insufficient oxygen to reach the stoichiometric ratio and corresponding
temperature. The reaction occurs in refractory-lined vessels that are required
to sufficiently contain the high temperature reactor gas stream. The refractory
lining presents a problem because of constant erosion at high velocities. The
erosion contributes to contamination of the carbon product, which is not
good for any customer product application. The erosion of refractory can also
significantly change the cross-sectional area of the ‘‘ choke’’ in tread grade
furnace reactors, affecting several carbon black properties, most significantly
surface area, structure, and tint levels. The ‘‘choke’’ is a narrowing section of
the furnace reactor (on tread but not carcass reactors) that is necessary to
attain the velocities required to produce the high levels of surface area desired.
Figure 2 Schematic of the furnace carbon black process.
4871-9_Rodgers_Ch06_R2_052404
MD: RODGERS, JOB: 03286, PAGE: 242
Copyright © 2004 by Taylor & Francis
Velocities can approach supersonic levels at the choke and temperatures
approach 3400jF (1870jC).
In the first stage of the process, hydrocarbon fuels are used to generate
temperatures via combustion that create an exothermic reaction with temper-
atures ranging from 2400jF (1315jC) to 3400jF (1870jC). This high
temperature is necessary to supply the energy required to ‘‘crack’’ or ‘‘split’’
the carbon–hydrogen bond of the raw material feedstock. The specific surface
area of carbon black, which is probably the most important quality param-
eter, is directly proportional to the reaction temperature. This means that
because more fuel is used to attain higher reaction temperatures for the higher
surface area carbon blacks there is a resulting higher production cost.
An endothermic reaction (‘‘cracking’’) proceeds concurrently with the
exothermic reaction. A hydrocarbon (feedstock) is injected into the reactor
for the production of carbon black at elevated pressures and temperatures.
High feedstock injection pressures and temperatures are necessary to attain
good economics and minimize coke formation. Coke is formed from rapid
cooling of the oil droplets or from oil droplet impingement on the reactor
refractory walls. This coke is sometimes referred to in the industry as ‘‘grit’’ or
‘‘sieve residue’’ (because of the way it is tested), but these terms also include
the refractory in the product due to erosion (see above) and any other process
contaminants that are not beneficial to customer applications. The process
gas stream velocity is very high at the point of feedstock injection, so relatively
high pressures are needed to get the feedstock into the reaction stream and
away from the refractory walls.
The hydrocarbon feedstock is usually an aromatic oil, but it could also
be natural gas, ethylene cracker residual bottoms, or coal tar distillate. This
feedstock is injected into the reaction gas stream when temperatures of that
stream are greater than 2500jF (1370jC). However, excess oxygen is still
present in the stream. Thus a portion of the feedstock burns, with the
remaining excess oxygen raising temperatures even higher, while concurrently
the remainder of the feedstock is reacting endothermically (the HUC bond is
destroyed, resulting in free hydrogen and carbon). Reaction times range from
about 0.3 sec to 1 sec before the reaction is ‘‘quenched.’’ Quenching is
normally done by injecting a stream of water in sufficient quantity to drop
the process stream temperature to less than 1500jF (815jC) or lower (i.e.,
dropping below ‘‘cracking’’ temperatures). The process gas stream is further
cooled through the use of gas–gas or gas–liquid heat exchangers. These heat
exchangers return heat to the process by elevating the temperature for process
air, feedstock, or water (producing steam), thereby helping to improve the
overall energy efficiency of the plant. Carbon black manufacturing is a very
capital- and energy-intensive process, making it inherently important to
maximize energy recovery or reduce energy use in all segments of the process.
4871-9_Rodgers_Ch06_R2_052404
MD: RODGERS, JOB: 03286, PAGE: 243
Copyright © 2004 by Taylor & Francis
By far the majority of the feedstock used by North American producers
is the heavy residual oil extracted from the bottom of catalytic crackers in oil
refineries. European and Asian manufacturers use a combination of ethylene
cracker bottoms, coal tar distillates, and the same catalytic cracker bottoms
that are used by the North American producers.
2. Thermal Process
The thermal process is similar to the furnace process except for the following
main areas.
1. The thermal process is cyclical, whereas the furnace process is
continuous.
2. In the thermal process carbon black forms in the absence of
oxygen.
3. Carbon black formed in the thermal process is much lower in
surface area and structure than carbon black made in the furnace
process.
4. The process gas formed as the hydrocarbon splits in the thermal
process is almost pure hydrogen, which requires special handling
processes and procedures, whereas the process gas formed in the
furnace process is mostly N
2
and H
2
O, with smaller amounts of
CO, H
2
,CO
2
,C
2
H
2
,andCH
4
.
The feedstock for thermal black can be natural gas or catalytic cracker
bottoms. Thermal carbon blacks are not as reinforcing as furnace black, can
have lower levels of hydrocarbon residuals on the surface, and are lower in
tint or blackness. There are some areas where these properties are beneficial,
but by far the vast majority of carbon black (>90%) production in the world
is uses the furnace process.
As a side note, the thermal process was developed in the United
Kingdom in the early 1900s as a method to produce hydrogen gas for use
in cities to augment or replace coal burning. Carbon black was a secondary
product in this H
2
-producing process.
3. Reactor Conditions Versus Properties
Carbon black has two primary properties (surface area and structure) that are
important to the majority of end users and are controlled predominantly in
the reaction area. Specific surface area is manipulated by controlling reaction
temperature, reaction time, and reaction velocity. Structure (or branching) is
manipulated by increasing or decreasing the amount of turbulence at the
point of feedstock injection in the reaction forming zone or by the addition of
4871-9_Rodgers_Ch06_R2_052404
MD: RODGERS, JOB: 03286, PAGE: 244
Copyright © 2004 by Taylor & Francis
metallic salts (potassium salts being by far the most prevalent) to prevent the
formation of carbon black particulate structure.
B. Filtration/Separation
Carbon black is formed in a reactor with less oxygen present than would be
required for complete combustion, resulting in many species of gas compo-
nents in the process gas stream. Gas species present include H
2
O, N
2
, CO, H
2
,
CO
2
,CH
4
,C
2
H
2
, and trace amounts of other compounds such as SO
2
and
H
2
S. The carbon black formed in the reaction section must be separated from
these gaseous components. This is accomplished through the use of various
types of commercially available cloth filter bags. At this stage of the process
the carbon black is in a ‘‘loose’’ or ‘‘fluffy’’ state at about 500jF (260jC). The
surface area of the carbon black being very high (25–150 m
2
/g), the loose
product is unmanageable for most customers. Carbon black in this state is
extremely light, and a few grams can easily obscure most of the light in a 4000
ft
3
room. The gas, often referred to as tail gas, does contain combustible
components (H
2
, CO, CH
4
), but the heat content is very low because of the
high quantities of nitrogen and water present, 45–75 Btu/ft
3
(1676–2794 kJ/
m
3
). Natural gas, by comparison, averages around 950–1000 Btu/ft
3
. Even
though the heat content is quite low, most carbon black manufacturers have
developed technology that allows combustion of this process gas to supply
heat to the process or to generate steam and/or electricity. This energy
recovery is essential to maintain energy efficiency and meet environmental
compliance requirements.
After separation the carbon black is conveyed (pneumatically or
mechanically) to the next segment of the process, where it is pelleted and
dried for ease of shipment and handling by the customers.
C. Pelletizing
Most customers need carbon black delivered in bulk quantities in a form that
is easy to convey and also easy to disperse into their compound (rubber,
plastic, ink, paint, etc). To get the loose carbon black into a pelleted form that
meets these needs, the carbon black producers are obliged to use mechanical
pin mixers, chemical pelleting aids (such as molasses or lignosulfonate),
water, and equipment of high capital and continuous operating costs. Because
carbon black is formed from a hydrocarbon raw material (which does not mix
naturally with water) and has high surface area and structure, large amounts
of water are needed to form the pellets, normally with a pelleting aid added to
facilitate ‘‘wetting.’’ Water content of the product leaving the pelleting area
4871-9_Rodgers_Ch06_R2_052404
MD: RODGERS, JOB: 03286, PAGE: 245
Copyright © 2004 by Taylor & Francis
ranges from 35% to 65% by weight. Water is used extensively in the carbon
black process—about five times more water than feedstock.
Customers expect to receive uniform pellets capable of withstanding the
rigors of being shipped hundreds to thousands of miles but not so hard as to
impede incorporation with a minimum of mixing energy and time. It is also
highly desirable to minimize the unpelleted carbon black (or minimize pellet
breakdown) so as to mitigate customer concerns about fugitive carbon black
in their plants.
D. Drying
The wet pellets, having a high concentration of water, are not a desirable final
product form. Therefore, carbon black producers are obliged to use large
amounts of energy (with significant capital investment) to drive the water
from the wet pellet. It is necessary to lower the moisture content from
approximately 50% by weight as it leaves the pelletizer to less than 1% for
shipment to customers. Most producers use the process gas, sometimes called
tail gas, separated from the carbon black in the filtration section of the process
to supply the fuel needed to dry the wet pellets. Although this is an inexpensive
fuel, the capital involved to collect, direct, and support combustion of this low
Btu gas is relatively high.
After drying, the pellets are conveyed to bulk storage tanks for
packaging into bags (ranging from 50 to 2000 lb), bulk trucks (45,000 lb),
or railcars (100,000 lb).
A small number of customers prefer the final product in different forms
for one reason or another. But the wet pelleted furnace type products
dominate the industry in terms of volume.
Other forms of final product are
1. Dry pellets. Using a rotating drum and recycling some carbon
black pellets, the loose carbon black is rolled into pellets via me-
chanical tumbling action. Dry pellets are softer than the wet pellets
and are used in applications where the product must disperse in a
vehicle with lower energy than wet pellets.
2. Powder carbon black. The carbon black can be directly packaged
before going through he pelleting and drying stage. Typically the
customers for this kind of product are looking for carbon black
that is very easy to disperse uniformly with minimum energy.
Freight costs and packaging costs are naturally higher than for
wet pelleted carbon black because of the lower density.
A process that has virtually disappeared because of environmental
concerns is the channel black process in which natural gas is burned and
4871-9_Rodgers_Ch06_R2_052404
MD: RODGERS, JOB: 03286, PAGE: 246
Copyright © 2004 by Taylor & Francis
the resulting carbon black is collected on channel irons that are continuously
scraped to obtain the product. It is a highly inefficient process that releases
much of the carbon black to the environment. Due to the highly oxidative
environment in which the carbon black is produced it has a high oxygen
content (3–5%), which results in slow curing characteristics in rubber.
IV. CONTROLLING THE QUALITY OF CARBON BLACK
To control the quality of carbon black during production it must be tested for
the characteristic properties that can be related to its performance in rubber.
Before discussing carbon black characterization and the various quality
control tests, it is worthwhile to point out that the carbon black industry
has done numerous things to standardize and improve the product received
by customers. Examples of this would be the establishment of industry-wide
target properties for each grade of carbon black (4), standard practices for
calculation of process indices from process control data (5), standard methods
for sampling packaged and bulk shipments (6,7), standard practices for
reducing and blending samples (8), standardized test methods for every
quality parameter and establishment of standard reference blacks with
accepted values to ensure uniformity of test data from any lab (9), and a
laboratory proficiency program that cross-checks data between over 60 labs
worldwide on a semiannual basis.
It is only appropriate that a more detailed discussion of the character-
ization properties used for quality control purposes is now undertaken in
some detail. Table 1 briefly summarizes the quality control tests, what they
measure, and how they should be used.
A. Specific Surface Area
The specific surface area is by definition the available surface area in square
meters per unit mass of carbon black in grams. This parameter is evaluated
through the use of adsorption measurements. In the absence of significant
microporosity, which includes almost all rubber grade carbon blacks, the
measure of specific surface area exhibits an inverse correlation with the size of
the carbon black particles (10). In theory the calculation of the amount of
surface in square meters is
Sðm
2
Þ¼W
m
NA=M ð1Þ
where S is the surface area, W
m
is the weight of the adsorbate monolayer (g), N
is Avogadro’s number (6.023
Â
10
23
mol
ÀI
), A is the cross-sectional area of
4871-9_Rodgers_Ch06_R2_052404
MD: RODGERS, JOB: 03286, PAGE: 247
Copyright © 2004 by Taylor & Francis
adsorbate (m
2
), and M is the molecular weight of the adsorbate (g/mol). Thus
the specific surface area, in square meters per gram, can be determined by
dividing S by the mass of the unknown sample. However, because of the
energetically heterogeneous surface of carbon black (11), no molecules adsorb
in a monolayer, and even theories that account for multilayer adsorption
assume an energetically homogeneous surface (12). Nonetheless, adsorption
tests still provide the best available technique for quality control of carbon
black specific surface area, and the most widely used is the adsorption of
iodine from aqueous solution. Other methods are also used to assess this
property, and each will subsequently be reviewed. Regardless of the tech-
nique, it is clear that this is a property that greatly influences the final
properties of compounds that contain the carbon black. Increasing only the
specific surface area of the carbon black used in a rubber compound will
typically increase such attributes as the compound’s blackness, stiffness,
hysteresis, and wear resistance.
The iodine number test is a well-defined procedure (13) in which a
sample of carbon black is added to a 0.0473 N solution of iodine, whereupon
Table 1 A Brief Summary of the Quality Control Tests for Carbon Black, What
They Measure, and How They Should Be Employed
Test Measures Use
a
Oil or DBP absorption No. Structure A
Compressed DBP or Oil No. Structure after compression B
Compressed volume index Relative structure level B
Iodine adsorption No. Surface area A
Nitrogen surface area Total surface area B
STSA External surface area B
CTAB surface area External surface area B
Tinting strength Fineness/color B
Pellet hardness Strength of pellets A
Fines content Dustiness level A
Pour density Bulk density B
Mass strength Resistance to packing C
Pellet size distribution Pellet sizes C
Toluene discoloration Extractables C
Ash content Inorganics from water B
Heating loss Moisture A
Sieve residue Contaminants A
Natural rubber mix 300% modulus, tensile strength B
a
A = typical specification property; B = specified only if application is critical to this
measurement; C = needs to be used only for process control.
4871-9_Rodgers_Ch06_R2_052404
MD: RODGERS, JOB: 03286, PAGE: 248
Copyright © 2004 by Taylor & Francis
it is shaken, then centrifuged to separate the solid. The resulting solution is
titrated with 0.0394 N sodium thiosulfate to an endpoint. From this titration,
the amount of iodine that adsorbed to the carbon black surface can be
calculated, and the result is reported as the grams of iodine adsorbed per
kilogram of carbon black (g/kg). Note that these units are not in terms of
surface area per unit mass despite the fact that this is what it attempts to assess
and monitor. The measurement does have some drawbacks because it can be
affected by any entities on the surface that may react chemically with iodine,
due to such things as excessive residual oil or oxidation of the carbon black
surface. However, under normal conditions (i.e., with no process changes
occurring to produce such surface entities) the method provides a reliable,
precise, and simple technique for assessing and monitoring specific surface
area.
Nitrogen adsorption measurements are made on carbon black by ex-
posing the carbon black to various partial pressures of nitrogen with the
sample at liquid nitrogen temperatures and then applying the ideal gas laws
to determine the number of nitrogen molecules that adsorbed. The mea-
surements are made using a multipoint static-volumetric automated gas
adsorption apparatus according to standard procedures (14). From earlier
experiments it was determined that the nitrogen molecule had a cross-
sectional area of 16.2 A
˚
2
, and by using this value and the Brunauer–
Emmet–Teller (BET) method (12) or the deBoer method modified by MaGee
known as STSA (for statistical thickness surface area) (15), a total specific
surface area or an external specific surface area in square meters per gram
respectively, is calculated. Although, like the iodine number method, these
give good relative determinations to changes in process conditions that are
believed to change this parameter, there is some question as to whether the
adsorption process gives us a true measure of specific surface area or is
significantly affected by the nature of the surface, because in both methods
there is an assumption that the surface is energetically homogeneous and it
has been demonstrated that this is not the case with carbon black (11). A
simple reporting of the amount of nitrogen adsorbed per gram of carbon
black would avoid this conflict in interpretation.
It is also to be noted that the STSA method is carried out at higher
partial pressures of nitrogen than the BET method and uses the deBoer model
to try to remove influences of adsorption into micropores in order to calculate
an external surface area. This calculation was derived empirically from
experiments in which an N762 carbon black was tested and assumed to have
no micropores. The STSA test indicates that there is microporosity in
relatively low specific surface area tread blacks that by other methods have
not shown microporosity, and this apparent discrepancy has not been
resolved. Nonetheless the STSA method has been a better alternative to
4871-9_Rodgers_Ch06_R2_052404
MD: RODGERS, JOB: 03286, PAGE: 249
Copyright © 2004 by Taylor & Francis
evaluating external surface area than cetyltrimethylammonium bromide
(CTAB) surface area measurements, which will be discussed next, and also
STSA was demonstrated to be more insensitive to heat and oxidative treat-
ments than any other specific surface area measurement (15).
The other test method employed for surface area measurement is the
liquid adsorption of the relatively large CTAB molecule (16). In this test the
CTAB, a cationic surfactant, is mixed with carbon black in aqueous medium,
the carbon black is pressure filtered to obtain the resulting solution, and this
solution is then titrated to a turbidimetric endpoint with an anionic surfac-
tant, Aerosol OT. Because of the large size of this C18 molecule it is assumed
that it does not enter into micropores and thus gives a measure of the external
specific surface area. The specific surface area is calculated by comparing the
amount the sample adsorbs to the adsorption of various masses (and thus
surface areas) of a reference N330 carbon black that is assumed to have a
value of 80 m
2
/g. The problem with referencing to the N330 carbon black is
that it has been shown that this causes a bias that can be predicted
mathematically to actually give slightly to significantly lower measurements
to blacks that are higher in specific surface area than the reference, and
slightly higher values for samples with specific surface area lower than the
reference (17). Thus this fallacy with the method can lead to misinterpretation
of the presence or absence of micropores. In addition this method has
problems with test reproducibility between laboratories, which is another
factor that led to such a decline in its use throughout the industry that in the
1990s it was removed from the list of typical properties of the various carbon
blacks in ASTM D 1765 (replaced by STSA).
B. Structure
‘‘Structure’’ is a term that has been used for many years in the carbon black
industry to describe the other main quality parameter of carbon black. It is
basically a measure of the complexity in shape of the carbon black aggregates
within a sample. Carbon black aggregates vary quite widely in morphology
(size and shape factors), from the large individual spheres found in some
thermal blacks to small highly complicated, branched aggregates in high
structure, high surface area carbon blacks. The concept of structure is used in
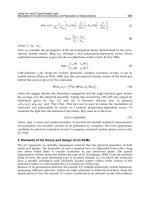
an attempt to assess this aggregate shape parameter. Figure 3 shows the
difference between a high structure and a low structure carbon black as
observed under a transmission electron microscope. The complex and varied
shapes of the carbon black aggregates lead to the creation of voids between
the aggregates in any samples of carbon black that are greater than the voids
that would be created if the aggregates were simple spheres of equivalent size.
It is this fact that has led to the commonly used techniques of measuring
4871-9_Rodgers_Ch06_R2_052404
MD: RODGERS, JOB: 03286, PAGE: 250
Copyright © 2004 by Taylor & Francis
internal void volumes as a means of indirectly assessing the shape, or
‘‘structure,’’ of aggregates within a carbon black sample. In general, the
greater the measured internal void volume, the more complex, open, and
branched the aggregates within a sample are and the greater the structure. The
measurements are made using either volumetric measurements under specific
pressures or, more commonly for quality control, oil absorption measure-
ments. In either case it is clear that this is a parameter of carbon black that has
a significant influence on the compound in which the carbon black is
dispersed. Increasing only the structure of the carbon black used in a rubber
compound will typically increase the compound’s hardness, viscosity, stress at
high strain, and wear resistance.
Oil absorption is the method of choice for quality control purposes for
assessing the structure of carbon black by applying the techniques in ASTM
D2414 (18). The test is simply a vehicle demand test where the oil, either
dibutyl phthalate (DBP) or paraffinic oil, is added dropwise through an auto-
mated buret to a sample of carbon black that is being rotated by blades in a
chamber much like an internal mixer, and when enough oil is added to fill all
the voids between the aggregates there is a change in the mixture from a free-
flowing powder to a semiplastic agglomeration, which raises the torque on the
rotating blades to a preset torque endpoint, or alternatively the entire torque
curve is recorded and the endpoint is a certain percent (typically 70%) of the
maximum torque. Most commonly it is reported as the oil absorption number
(OAN) in units of milliliters of oil per 100 g of carbon black. Paraffinic oil was
just recently approved by ASTM as a means for companies to move away
from the more environmentally unfriendly DBP. It was observed many years
ago that this measurement was greatly influenced by the amount of work that
needed to be exerted on the carbon black sample for it to be easily manip-
Figure 3 N326 (low structure) and N358 (high structure) carbon blacks as viewed
by transmission electron microscopy. (Photograph by David Roberts.)
4871-9_Rodgers_Ch06_R2_052404
MD: RODGERS, JOB: 03286, PAGE: 251
Copyright © 2004 by Taylor & Francis
ulated and that it was not always in alignment with the amount of ‘‘structure’’
that was influencing compound properties. Thus an alternative method was
developed and adopted for oil absorption wherein the sample is compressed
at 24,000 psi four times (24M4) before the oil absorption is measured (19).
Thus this alternative test, referred to as compressed oil absorption number
(COAN), seeks to approximate the level of structure present in a carbon
black after it is mechanically mixed into rubber. The difference between a
typical oil absorption value and a compressed oil absorption value can vary
anywhere from 3 to almost 50 units depending on the grade. Although the
COAN has proved itself to be a useful tool, one is cautioned to consider that
the breakdown of structure may vary considerably according to the param-
eters of the polymer into which the carbon black is mixed.
It was proposed years ago that volumetric measurements of the carbon
black be made under specified pressures. This ‘‘void volume’’ test was revived
in the 1990s when improved technology made it much more accurate and
precise. In this test a sample of carbon black is weighed and then compressed
in a cylinder of known dimensions to a pressure of about 7000 psi (48.3 MPa).
The difference between the measured volume and the ‘‘true’’ volume of the
carbon black (calculated from the sample mass and density) gives the void
volume at that pressure. ASTM adopted this test (20) but indexed each
measurement to an industry reference N330 carbon black, and the test is thus
now referred to as the compressed volume index (CVI). To date the test has
not gained popularity for quality control purposes but may do so in the future
because it is much faster than oil absorption and appears to be just as accurate
and precise.
C. Tint Strength
For the tint strength test a sample of carbon black is mixed into a paste with a
white powder (zinc oxide) and plasticizer, the paste is thinly spread on a
smooth surface, and the reflectance of the paste is measured (21). Each time
the test is performed a reference N330 carbon black is likewise tested, and the
tint strength is the ratio of the reflectance of the standard to that of the sample.
In this way a carbon black sample that causes the paste to be blacker in color
than the standard and thus have less reflectance than the standard will have a
higher tint strength (>100) than the standard.
The tint strength test has obvious applications to customer applications
where color is critical. However, for other applications there is some debate
about its usefulness because it is highly correlated to other carbon black
properties. The tint strength results are correlated directly with the carbon
black specific surface area (the smaller the carbon black entities, the more
4871-9_Rodgers_Ch06_R2_052404
MD: RODGERS, JOB: 03286, PAGE: 252
Copyright © 2004 by Taylor & Francis
dispersed these black bodies are in the paste, leading to higher tint strength)
and are inversely correlated with the carbon black structure (the more highly
branched the aggregates, the more voids and the less coverage of the whiteness
of the zinc oxide, meaning lower tint strength). Tint strength ultimately
measures the degree of dispersion of the carbon entities in the zinc oxide
containing paste. Higher tints indicate more highly dispersible carbon.
D. Pellet Properties
As discussed in Section III, carbon black must typically be densified in the
form of pellets to facilitate transport and handling. These pellets must be hard
enough to withstand the transportation, unloading, and handling needed for
the customer, yet must be soft enough to not have difficulty in breaking down
and subsequently dispersing in the polymer into which they are mixed. Thus
several tests have been developed to assess the quality of the pellets produced.
Without doubt the two most important tests developed for evaluating the
quality of the pellets and predicting whether the customer will encounter
difficulties in handling or mixing are the determination of fines content and
pellet hardness. Other pellet quality tests for carbon black include pellet size
distribution, bulk density, and mass strength.
The ‘‘ fines’’ content of carbon black pellets is determined by placing a 25
g sample onto a 125 Am screen and shaking for 5 min, with the material
passing through the screen being considered the fines (22). The instrument
used for the shaking, called a Ro-Tap, performs a rotary shaking motion and
has a hammer that taps the top screen. Depending on the type of unloading
and transportation system at the receiving location of the carbon black, the
maximum amount of the 5 min fine: that can be tolerated is a typical
specification property. Excessive fines can lead to problems with unloading,
dustiness, and/or flowability. The test can also be done using a 20 min shake,
and the difference between the 20 min and 5 min fines tests is known as the
attrition (22). The attrition is a good indication of the amount of pellet
breakdown that might occur as the pellets are handled through conveying
systems. It is also a property that is typically monitored in the process, because
high attrition values give production personnel an indication that there are
problems with the pelletizer. In either test the sample should be riffle split
(blended) before testing to ensure uniformity of the fines in the sample.
Pellet hardness testing is typically done on pellets that are between 1.4
and 1.7 mm in diameter, which are obtained by sieving the samples through a
U.S. No. 14 screen and collecting the pellets retained by that screen on a U.S.
No. 12 screen in a 1 min shake. There are two ASTM test methods, one using a
manual tester (23) and the other using an automated tester employing a piston
4871-9_Rodgers_Ch06_R2_052404
MD: RODGERS, JOB: 03286, PAGE: 253
Copyright © 2004 by Taylor & Francis
that brings one pellet at a time against a load cell until it breaks (24). Normally
only 20–50 pellets are tested on a sample for reasonable testing time consid-
erations, but the container may actually contain millions of pellets of many
different sizes, and thus it is not surprising that the statistical reliability of the
test is notoriously poor. In spite of this fact, the test has still proved to be an
invaluable tool for assessing the quality in regard to whether the pellets will be
too hard to disperse or too soft to maintain integrity.
Pellet size distribution is tested by production personnel to monitor
their pelletization processes. Sieve analysis is done to determine the relative
amounts of pellets in six size intervals:<0.125, 0.125–0.25, 0.25–0.50, 0.50–
1.0, 1.0–2.0, and >2.0 mm (25). Bulk density, or pour density, is a simple test
wherein a sample is poured into a container of known volume and the mass is
measured in order to calculate a density (26). Bulk density varies appreciably
between grades and is needed for converting between mass and volume in
shipping, handling, and compounding on the commercial scale. Not surpris-
ingly, the bulk density can be correlated inversely with the oil absorption
values, because higher oil absorption leads to aggregates and agglomerates
that will not pack as closely in the pellet and thus have a lower observed pellet
density. The mass strength test (27), once called the pack point test, measures
the minimum force required to compact a relatively large sample of pellets
into a coherent mass. An excessively low value indicates that the sample may
tend to dust or pack during unloading or conveying. The test is relatively
simple and fast and is used by process personnel as a quick measure of pellet
quality.
E. Impurities
Carbon black is basically elemental carbon. Because of the feedstock and
manufacturing process, it does, however, contain a small but significant
amount of non-carbon constituents. The main heteroatoms incorporated
into the carbon structure are hydrogen, oxygen, and sulfur. Thermal blacks
typically contain less than 1% of these heteroatoms, and furnace grades less
than 2–3%. None of these heteroatoms have been determined to affect the
quality of the rubber product in which the carbon black is mixed, and thus
their measures have not been developed into quality control tests. Many
people have questioned whether the sulfur in the carbon black affects the
vulcanization in sulfur-based curing systems, but it appears that the sulfur is
tightly bound in the carbon black structure and is thus unavailable as free
sulfur (28). Oxygen in high amounts such as are found in channel blacks and
some treated carbon blacks can cause the cure rate to slow in an amine-based
sulfur vulcanization system because there can be enough acidic oxygen
surface complexes (such as carboxylic groups) to appreciably react with the
4871-9_Rodgers_Ch06_R2_052404
MD: RODGERS, JOB: 03286, PAGE: 254
Copyright © 2004 by Taylor & Francis
amine-based accelerator and make it unavailable for curing reactions (29,30).
Other non-carbon constituents, which are most frequently process contam-
inants, can adversely affect quality; these include moisture, ash, extractables,
and the various impurities sometimes found from water wash sieve residue
analysis. Moisture is a parameter typically found on customer specifications
and is determined by measuring the mass loss at 125jC. Ash content of carbon
black arises primarily from the salts and minerals in process water and is
measured to ensure satisfactory purity of the carbon black in applications
where purity is critical. Ash is determined by measuring the residue remaining
after the combustion of the carbon black in an air atmosphere, normally at a
temperature of 550jC (31).
Extractables are the oily residues remaining on the sample during
carbon black formation and result from the reaction being quenched in the
furnace before the decomposition of the oil has reached completion. The test
for extractables, typically important only for process control, is done semi-
quantitatively by determining the amount of discoloration (by measuring the
percent transmittance at 425 nm wavelength) of the toluene used to extract the
carbon black sample (32). Note that the lower the value of percent transmit-
tance, the greater the amount of oily residue remaining on the carbon black.
Other impurities are found by determining the amount of material (often
called sieve residue or grit) that resists passage through screens of a specified
size after washing with water and the application of gentle mechanical
rubbing (33). The material found can be from many origins such as refractory
failure, coke formation, and metal degradation of process equipment. Typical
screen size openings are 45 Am (U.S. No. 325) and 0.5 mm (U.S. No. 35).
Other screen sizes may be used, because the purpose is to ensure that these
impurities are limited to small amounts and do not cause problems such as
surface blemishes or degradation of any performance properties in the
products in which the carbon black is used.
Manufacturers of mechanical rubber goods (MRG) whose applications
are very sensitive to defects due to impurities worked with the carbon black
industry to develop grades of carbon black that are extremely clean (very low
ash and sieve residue) to minimize the defects in their products. Carbon black
manufacturers took several actions to accomplish this objective of new,
cleaner grades of carbon black, including special units dedicated to producing
this less contaminated carbon black. Other actions included developing
reactors that minimized coke formation, using filtered or reverse osmosis
water for the process, filtration of the feedstock oil, and replacement of
carbon steel in the process with stainless steel. Despite the fact that these
carbon blacks cost more to produce, they were viewed favorably by the
specialized MRG customers because the reduction in scrap cost would often
easily offset the increase in carbon black cost.
4871-9_Rodgers_Ch06_R2_052404
MD: RODGERS, JOB: 03286, PAGE: 255
Copyright © 2004 by Taylor & Francis
F. In-Rubber Tests
ASTM has developed two rubber recipes specifically for evaluating carbon
black in rubber. One formula is for natural rubber (34) and the other for
styrene butadiene rubber (35). The formulations are shown in Table 2.
Normally when any test is to be done in these recipes, one also mixes and
tests the current Industry Reference Black (IRB) and reports the data as
differences from the IRB in order to minimize fluctuations in data due to
mixing differences. The values for the current IRB are found in ASTM D 1765
(4). Years ago customers commonly specified requirements on stress–strain
properties in the natural rubber recipe, but their use has been declining
because most customers did not observe much usefulness from these data (as
opposed to the usefulness of physicochemical properties of carbon black
discussed above) and it has been gradually removed from customer specifi-
cations.
V. THE EFFECT OF CARBON BLACK ON RUBBER
PROPERTIES
The physical properties imparted to a given rubber compound by carbon
black are dominated by three factors: 1) the loading of the carbon black, 2) the
specific surface area of the carbon black, and 3) the structure of the carbon
black. Table 3 shows a generalization of how these factors influence the
rubber properties, but the reader is cautioned that there are many exceptions
to these relationships and that the type of polymer, presence or absence of oil,
Table 2 ASTM Formulations D 3192 (Natural Rubber) and D 3191 (Styrene
Butadiene Rubber)
Ingredient D3192 (NR), phr D3191 (SBR), phr
SBR-1500 100.00
Natural rubber, SMRL 100.00
Carbon black 50.00 50.00
Zinc oxide 5.00 3.00
Stearic acid 3.00 1.00
Sulfur 2.50 1.75
TBBS (accelerator) 1.00
MBTS (accelerator) 0.60
Total 161.75 156.75
4871-9_Rodgers_Ch06_R2_052404
MD: RODGERS, JOB: 03286, PAGE: 256
Copyright © 2004 by Taylor & Francis
type of cure system, and many other factors may also alter those relationships.
The more detailed discussion that follows is divided into three categories: 1)
the mixing and dispersion processes that occur initially, 2) the processing
properties of the uncured compound, and 3) the physical properties of the
cured compound.
A. Mixing and Dispersion
Carbon black is incorporated into rubber through shear forces generated by
adding the carbon black to rubber in an internal mixer or open mill. The
addition of the carbon black causes the torque developed in an internal mixer
to rise to a maximum before slowly dropping while the temperature of the
mixed stock continuously rises. The temperatures generated during mixing
generally increase as the loading of carbon black, the specific surface area of
the carbon black used, or the structure of the carbon black used is increased.
The initial rise to a maximum torque is generally referred to as the incorpo-
ration stage because the polymer is filling the voids between the carbon black
aggregates and agglomerates, generally to a point at which the mixture
becomes a coherent rubbery composite. Subsequently this process continues
Table 3 Effect of Carbon Black on Rubber Properties
Effect of increase in carbon black properties
Rubber property Surface area Structure Loading
Uncured properties
Mixing temperature Increases Increases Increases
Die swell Decreases Decreases Decreases
Mooney viscosity Increases Increases Increases
Dispersion Decreases Increases Decreases
Loading capacity Decreases Decreases —
Cured properties
300% Modulus Insignificant Increases Increases
Tensile strength Increases Insignificant Increases
a
Elongation Insignificant Decreases Decreases
Hardness Increases Increases Increases
Tear resistance Increases Decreases Increases
a
Hysteresis Increases Insignificant Increases
Abrasion resistance Increases Insignificant Increases
a
Low strain dynamic modulus Increases Insignificant Increases
High strain dynamic modulus Insignificant Increases Increases
a
Increases to an optimum, then decreases.
4871-9_Rodgers_Ch06_R2_052404
MD: RODGERS, JOB: 03286, PAGE: 257
Copyright © 2004 by Taylor & Francis
as the torque decreases and processes such as deagglomeration (reduction of
agglomerate sizes through breakdown of the agglomerates into aggregates)
and distribution (movement of the aggregates or agglomerates throughout
the matrix and sometimes more preferentially into one polymer if it is a
polymer blend) take place. Depending on the mixing conditions, carbon black
type, polymer type(s), etc., there is a final dispersion of the carbon black
aggregates throughout the polymeric medium. This dispersion of the carbon
black in the polymer is critical, and, in general, the better the dispersion the
better the performance properties of the carbon black–filled rubber com-
pound. It has been recognized to be of such importance that it has been the
subject of many research studies (36–39). One aspect worth noting is that it
has been observed that carbon blacks with higher structure generally give
shorter incorporation times, and this can be postulated to be due to the fact
that the voids between the aggregates are greater owing to the higher degree of
branching in the aggregates (they cannot pack as closely), which would leave
larger voids that could be more easily filled with rubber during mixing.
Another aspect of mixing is the loading capacity (limit to the amount of
carbon black that can be incorporated into the rubber while still maintaining
a rubbery composite), which normally decreases as the surface area and/or
structure of the carbon black increases.
It is clear that the assessment of the level of dispersion in a carbon black–
filled rubber compound is a key parameter for predicting performance. The
ASTM standard test method (40) for evaluating dispersion of carbon black in
rubber uses three techniques.
Method A is a fast qualitative visual comparison of a torn or cut spec-
imen versus reference photographs at 10–20
Â
magnification to give
the sample a rating from 1 (worst) to 5 (best).
Method B is a time-consuming and laborious quantitative test done by
measuring with a light microscope the percentage of area covered by
black agglomerates in microtomed sections of the compound.
Method C is a relatively fast quantitative test wherein the cut surface
of a rubber specimen is traced with a stylus that measures the
amount of roughness caused by the carbon black agglomerates but
requires a laborious calibration for each system studied.
Additional techniques for assessing dispersion besides the ASTM methods are
quite numerous. Some are just extensions of the ASTM methods such as the
Dispergrader, which essentially duplicates method A but with more reference
photographs, software for additional analysis, and the ability to test uncured
rubber (41). Another example is surface roughness measurements with a
stylus as in method C, but by scanning in an X-Y plane (rather than using a
single line scan) reconstruction of a three-dimensional surface is possible (42).
4871-9_Rodgers_Ch06_R2_052404
MD: RODGERS, JOB: 03286, PAGE: 258
Copyright © 2004 by Taylor & Francis
One problem with all the above method is that they address only the
macrodispersion of the carbon black as opposed to the microdispersion. In
general, microdispersion is at scales of nanometers to fractions of a microm-
eter, whereas macrodispersion is at scales of several micrometers to milli-
meters. Problems with macrodispersion refer to poorly dispersed carbon
black that may present itself as lumps of filler that for some reason was not
fully deagglomerated. Poor macrodispersion can often be related to problems
with failure properties and appearance.
Microdispersion refers to the degree to which the aggregates and
agglomerates have been dispersed at the submicrometer level, which influ-
ences such factors as the amount of interfacial area between the carbon black
and polymer (important for the degree of interaction that will take place) and
the extent to which the filler–filler network, held together by van der Waals
forces, has formed. The filler–filler network plays a dominant role in the low
strain dynamic properties of the compound, which will be discussed in more
detail later. The level of microdispersion can be observed qualitatively in a
two dimensional mode using a microtomed section of rubber under a
transmission electron microscope but does not lend itself well to reasonable
quantification. Electrical resistivity measures microdispersion in the bulk
sample but it is important to note that measurements must be evaluated as
relative comparisons to samples of identical composition in order to restrict
the influence on resisitivity to dispersion differences.
B. Uncured Rubber Properties
Once carbon black is mixed into rubber, the resulting filled rubber compound
is subjected to processes such as calendering, extrusion, and molding before it
is cured to make the finished rubber good. As would be expected, the addition
of carbon black changes the properties of the uncured rubber significantly.
The addition of carbon black increases the viscosity of the compound, and
these increases in viscosity can be correlated with increasing loading of the
carbon black, with increasing structure of the carbon black used, and, to a
lesser extent, with increasing surface area of the carbon black. These increases
in viscosity with carbon black additions obviously change the flow character-
istics of the filled compound. It is noted that the typical polymer by itself,
when made to flow at low shear rates, will exhibit a shear stress proportional
to the shear rate (Newtonian flow), whereas the carbon black–filled polymer
results in highly non-Newtonian flow. In most processes there is an extrusion
step, and carbon black is well known to influence the amount of swelling the
rubber compound experiences when passing through a die. This die swell is
the ratio of the cross-sectional area of the extrudate to that of the die and is
greater than 1 with rubber compounds. The incorporation of carbon black
4871-9_Rodgers_Ch06_R2_052404
MD: RODGERS, JOB: 03286, PAGE: 259
Copyright © 2004 by Taylor & Francis
into the compound reduces the amount of swelling that will occur from
passing through a die, and this improvement (or reduction in swelling) can be
increased by increasing the loading of carbon black, increasing the structure
of the carbon black used, and/or increasing the surface area of the carbon
black used.
C. Cured Properties
Once the carbon black–filled rubber compound has been molded, it is cured
into a finished product. In general for the tire industry, accelerated sulfur
vulcanization systems are used to cure the rubber at high temperature, and the
simple presence of any grade of carbon black, even in low amounts, causes a
significant reduction of the time before curing starts (induction time). This
observation has led to the hypothesis that carbon black may play a catalytic
role in the vulcanization process (43). The physical properties of the final
cured rubber product are highly influenced by the type and amount of carbon
black. Higher specific surface area carbon blacks tend to give better wear
resistance to the rubber as well as greater heat loss (hysteresis) in a tire tread
application than their lower specific surface area counterparts. As the filled
compound is subjected to higher strains (>10%) the physical properties
become less influenced by the specific surface area of the carbon black and
increasingly influenced by the structure of the carbon black. Carbon black
structure appears to play only a small role in performance at low strains. Thus
higher structure carbon blacks tend to give greater reinforcement as observed
by higher modulus at high strains in cured rubber. Increasing the loading of
carbon black, whatever grade, tends to also increase the strength of the
rubber, but some properties, such as tensile strength and abrasion resistance,
tend to decrease after a certain loading. Figures 4–6 demonstrate some of the
relationships just described.
It is worthwhile to discuss the current theories on how and why carbon
black reinforces rubber. Rubber is a material that has found utilization
because it can be deformed and then recover from the deformation. These
deformations can be characterized by three parameters: strain amplitude,
frequency of deformation, and temperature. Regarding the reinforcing role
of carbon black it has been demonstrated that the strain dependence is the
most important of the three parameters (44,45), so further discussion will
concentrate in this area. Considerable research has been done on the dynamic
mechanical properties of filled compounds (46–48), which forms the basis for
the following discussion. It has been shown that the behavior of the polymer/
carbon black composite is different in two domains: low strain (<10%) and
high strain (>10%). Figure 7 shows the response of the elastic or storage
modulus (GV) and the viscous or loss modulus (GW) from very low strains
4871-9_Rodgers_Ch06_R2_052404
MD: RODGERS, JOB: 03286, PAGE: 260
Copyright © 2004 by Taylor & Francis
Figure 4 Relationship of carbon black nitrogen surface area to selected rubber
properties.
Figure 5 Relationship of carbon black structure to selected rubber properties.
4871-9_Rodgers_Ch06_R2_052404
MD: RODGERS, JOB: 03286, PAGE: 261
Copyright © 2004 by Taylor & Francis
Figure 6 Generalized relationships between carbon black loading and selected
rubber properties.
Figure 7 Relationship of G V and G VV with strain for N234-filled SBR (D3191) and
unfilled D3191.
4871-9_Rodgers_Ch06_R2_052404
MD: RODGERS, JOB: 03286, PAGE: 262
Copyright © 2004 by Taylor & Francis
(0.1%) to 10% strain for a typical carbon black compound and for the
corresponding unfilled polymer. It is clear that the response is quite different
for the carbon black–filled compound and that the filler is the main
contributor to the reinforcement. It is theorized (47) that the carbon black
aggregates and agglomerates dispersed throughout the polymer matrix form
a network that is held together by van der Waals type forces. Because of the
nature of the forces holding the network together, this network is very
sensitive to even small changes in strain and continues to separate as the
strain increases, which decreases the stiffness of the composite, leading to
the observed decrease in GV (the elastic component of the modulus). As the
network breaks, energy is dissipated as heat, which leads to the observed rise
in GW (the viscous or loss component of the modulus) until it reaches a
maximum before decreasing. This maximum in viscous modulus at low strain
(GU
max
) is correlated with hysteresis (energy loss) characteristics of the finished
rubber good, most notably the rolling resistance behavior of tires. Because
these low strain properties are highly dependent on the strength of the carbon
black network, which is held by weak van der Waals forces, it is not
surprising that the specific surface area (which is inversely proportional to
the size of the particles and aggregates) plays a dominant role. It is known
that the smaller the object, the greater the attractive forces due to either more
or stronger van der Waals bonds, because comparisons are made at the same
mass of carbon black. It is, of course, observed that the high surface area
blacks give higher GV
max
and GU
max
however, structure appears to play little or
no role at low strain. As a side note, many in the industry have also used the
maximum in tan y (the ratio of GW to GV)at60jC for the correlation to energy
loss in the compound instead of GU
max
, but the problem with this is one of the
mathematics of the relationship that demonstrates that the energy dissipated
per strain cycle is directly related to the GW value at constant strain amplitude
and thus in order to make comparisons of tan y to evaluate energy loss, the GV
values must be equivalent, which is typically not the case. An excellent
approach for making comparisons and understanding behavior regarding
carbon black reinforcement in low strain dynamic properties is the <G-
plot> representation, where GV is plotted versus GW as shown in Figure 8. In
this plot, first considered by Payne and Whitaker (48) and popularized by
Gerspacher (47), the lowest strain is on the right and strain increases as the
curve moves to the left.
The other domain of carbon black reinforcement is that of high strain
properties. It is in this region that the surface area of the carbon black begins
to play only a small role yet the structure of the carbon black has a very
significant influence. As noted earlier, compound properties such as 300%
modulus (stress at 300% strain) and dynamic properties above 10% strain are
highly correlated to the structure of the carbon black. Once again, structure is
4871-9_Rodgers_Ch06_R2_052404
MD: RODGERS, JOB: 03286, PAGE: 263
Copyright © 2004 by Taylor & Francis