báo cáo khoa học:"Not all developmental assets are related to positive health outcomes in college students" pps
Bạn đang xem bản rút gọn của tài liệu. Xem và tải ngay bản đầy đủ của tài liệu tại đây (403.53 KB, 10 trang )
RESEARC H Open Access
Not all developmental assets are related to
positive health outcomes in college students
Keith J Zullig
1*
, Daniel A Teoli
1
and Rose Marie Ward
2
Abstract
Background: The purpose of this investigation was to model the relationships between developmental assets, life
satisfaction, and health-related quality of life (HRQOL) among a stratified, random sample (n = 765, 56% response
rate) of college students.
Methods: Structural equation modeling techniques were employed to test the relationships using Mplus v4.21;
Model evaluations were based on 1) theoretical salience, 2) global fit indices (chi-square goodness of fit,
comparative fit index: CFI and Tucker-Lewis Index: TLI), 3) microfit indices (parameter estimates, root mean squared
error of approximation: RMSEA and residuals) and 4) parsimony.
Results: The model fit the data well: c
2
(n = 581, 515) = 1252.23, CFI = .94, TLI = .93 and RMSEA = .05. First,
participants who reported increased Family Communication also reported higher levels of life satisfaction. Second,
as participants reported having more Non-Parental Role Models, life satisfact ion decreased and poor mental HRQOL
days increased. Finally increased Future Aspirations was related to increased poor mental HRQOL days. Results were
variant across gender.
Conclusions: Preliminary results suggest not all developmental assets are related to positive health outcomes
among college students, particularly mental health outcomes. While the findings for Family Communication were
expected, the findings for Non-Parental Role Models suggest interactions with potential role models in college
settings may be naturally less supportive. Future Aspirations findings suggest college students may harbor a
greater temporal urgency for the rigors of an increasingly competitive work world. In both cases, these assets
appear associated with increased poor mental HRQOL days.
Background
Positive youth development (PYD) first originated as a
conceptual approach of developing assets within youth
as opposed to removing risk factors via “deficit-focused
strategies” [1]. Evidence suggests a relationship exists
between the number of assets possessed and the number
of thriv ing indicators within an individual (such as pos-
session of leadership qualities, display of resiliency, and
achieved success in school) [2]. Building upon this sup-
port, PYD considers the strengths of youth and values
the contributions they can make toward healthy devel-
opment by maximizing these individual strengths
through meaningful societal roles and community-based
activities [3].
PYD is often assessed through the Search Institute’s
Developmental Asset Framework [4]. This framework
suggests that 40 primary assets may affec t healthy youth
development. These assets are grouped into either inter-
nal or external assets. Internal assets are skills, values,
and commitments that stem from within an individual
including (but not limited to) humility, appropriate deci-
sion-making, and a sense for his or her own purpose in
life. Internal assets categories include co mmitment to
learning, positive values, social competencies, or positive
identity. In contrast, external assets develop outside of
an individual. External assets are positive experiences
and interactions gained from one’s family, non-parental
role models, school, community, and service groups.
External asset categories include support, empowerment,
boundaries and expectations, or constructive use of time
[5]. When the internal and external assets are in a
balanced positive state of existence, PYD can occur [6].
* Correspondence:
1
Department of Community Medicine, West Virginia University, Morgantown,
WV, USA
Full list of author information is available at the end of the article
Zullig et al. Health and Quality of Life Outcomes 2011, 9:52
/>© 2011 Zullig et al; licensee BioMed Central Ltd. This is an Open Access article distributed under the terms of the Creative Commons
Attribution License ( which permits unrestricted use, distribution, and reproduction in
any medium, provided the original work is properly cited.
Increased asset development may serve as an impor-
tant protective factor for individuals [7]. For example,
those who possess increased developmental assets are
less likely to report violent and aggressive behavior [8];
tobacco use [9]; risky sexual behavi or [10,11]; and alco-
hol and drug use [12]. These findings may be especially
pertinent to college students, who constitute a popula-
tion often exposed to unusual stressors such as living in
a new location, pressure for high academic achievement,
immediate availability of illegal substances, and
increased risk of dangerous sexual behaviors. These
stressors can effectively serve as barriers to a smooth
transition for stud ents from their homes to an indepen-
dent college environment [13,14]. Moreover, research
also suggests that the total number of assets poss essed
by a student is approximately two times more effective
in anticipating fut ure achievement than are other pre-
dictive measures (e.g., race/ethnicity, family composition
and socioeconomic status) [3]. For instance, the correla-
tions between academic achievement (GPA) and the
total number of assets in an individual was .45 for males
and .35 for females in a recent study [15].
While developmental assets appear to be protective
against engagement in risky behavi ors, little is known
about the relationship between developmental assets
and one’s quality of life (QOL). According to Diener
[16], improving QOL is important for enriching an indi-
vidual’s overall well -being. QOL consists of two dimen-
sions: subjective and objective. Objective QOL examines
issues external to an individual such as annual income
level, neighborhood crime rates, and personal housing
quality. Alternatively, subjective QOL consists of judg-
ments of one ’s overall life in different domains includ-
ing, but not limited to, self, family life, and romantic
relationships. Subjective QOL can be further separated
into life satisfaction and health-related quality of life
(HRQOL) [17]. Specifically, life satisfaction is a cognitive
conclusion regarding the quality of one’ s own life in
comparison with a self-impo sed standard [18]. The out-
come of comparing actual circumstances vis-à-vis perso-
nal standards will render individual global life
satisfaction judgments as positive or negative in nature
[19]. The United States (US) Centers for Disease Con-
trol and Prevention (CDC) define HRQOL as “an indivi-
dual’sorgroup’s perceived physical and mental health
over time” [20]. On the micro scale, HRQOL observes
physical and mental health levels of an individual. On
the macro scale, an entire population (or student body)
can b e analyzed for the impact that policies, resources,
and conditions (i.e., developmental assets) have upon
that respective population’s health.
Similar to a lack of developmental assets [8,9,11,12],
lower levels of life satisfaction are related to increased
violent and aggressive behavior [21], substance use [22],
and risky sexual behavior [23]. Reduced life satisfaction
is also related to unhealthy dieting and weight percep-
tions [24-26], suicide ideation [27] and a sedentary life-
style [28]. In light of these established relationships with
life satisfaction, subjective quality of life is an important
facet of health research that is often overlooked [29].
Unfortunately, the literature contains little research
exploring the relationship between life satisfaction and
developmental assets in the context of PYD. While one
study by Valois et al. [30] indicates a signi ficant positive
relationship between increased developmental assets and
life satisfaction, the findings are limited to one study of
public middle school students. No studies examine a
college student population. Therefore, one aim of this
studyistoexploretherelationshipbetweendevelop-
mental assets and college student life satisfaction.
A second aim of this study is to explore the relation-
ship between developmental assets and HRQOL. Accord-
ing to the US CDC [31], “fair or poor” self-rated health
was reported by 9.7% of 18-24 year olds in 2007 - an
increase from 6.5% in 1993. Similarly, the “mean physi-
cally unhealthy days” (out of the prior 30) was an average
of 4.3 days in 2006 and the mean “mentally unhealthy
days” (out of the prior 30) was approxi mately 6.0 days in
2006 [31], both of which have increased since 1996.
However, no adult o r adolescent literature explores the
relationship between developmental assets and HRQOL.
Therefore, the purpose of this study is to explore the
concurrent relationships between the developmental
assets, life satisfaction, and HRQOL among college stu-
dents.Theneedforamorethoroughunderstandingof
these relationships is further bolstered by two important
findings: the current generation of teenagers exhibit
overall worse mental health [32] and higher levels of
anxiety [33] in comparison to previous generations. The
current study extends the extant literature by 1) explor-
ing any relationships between the developmental assets,
life satisfaction, and HRQOL outcomes and by 2) sug-
gesting which developmental asset s are mo st strongly
related to both life satisfaction and HRQOL. This
research may be subse quently used t o direct PYD
approaches in college settings.
Methods
Sampling Method
During February 2007, 1,300 students 18 years of age or
older were randomly selected from a Midwestern uni-
versity’ s email database to participate in an internet-
based health survey. Equal numbers of students from
each academic class were selected at random (i.e. a stra-
tified random sample) via the uniform distribution num-
ber generator funct ion in SAS [34]. The methodology
provided each student an equal probability of being
selected as a participant in the investigation’s sample to
Zullig et al. Health and Quality of Life Outcomes 2011, 9:52
/>Page 2 of 10
produce a representative sample o f the university’sstu-
dents. The sample database included student names, up-
to-date mailing addresses, and current email addresses.
Using internet survey methods [35] approved by the
referent university’s institutional review board, selected
students (n = 1,300) were sent an invitation to partici-
pate. Selected students were notified that if they partici-
pated in the investigation, they would receive a coupon
to an off-campus café (redeemable for a single specialty
drink of choice). Seven days after the initial solicitation,
a second email containing a clickable hyperlink to the
questionnaire was sent to the potential participants.
Those who clicked the hyperlink were first directed to
an informed consent statement that explained the perti-
nent research procedures and specific active measures
being taken to protect participants’ privacy. At the con-
clusion of the survey, all potentially identifying informa-
tion details were separated from the responses and
stored in a separate data storage location (thus making
responses anonymous). A total of 723 surveys were
completed for a 56% response rate.
Participants
Sample demographics are provided in Table 1. The
referent institution is a four-year, public university of
midsize in the Midwestern United States. Approximately
14,265 students of the 16,262 total student population
are Caucasian (86%) and only 2% of students are above
the age of 24. The composition of the University’ s
undergraduate body i s 46% male and 54% fem ale. The
percentages of freshman, sophomore, junior and senior
students comprising the student body are 27%, 27%,
21% and 24%, respectively. While females are slightly
overrepresented and males are underrepresented in this
sample, the racial and academic year demographics are
quite representative of the campus as a whole.
Measures
Developmental Assets
Based on the work of Oman et al. [36], the developmen-
tal asset measure used in this study was developed and
validated for college students [37]. The survey contains
28 items and measures eight developmental assets. The
firstassetis“Family Communication” with t hree items
(response options 1 = almost ne ver; 2 = some of the
time; 3 = usually; 4 = almost always). A sample Family
Communication item is “ How often does your mother,
father, or another adult at your home try to understand
your point of view?“ The second asset is “ Peer Role
Models” also with three items (response options 1 =
almost never; 2 = some of the time; 3 = usually; 4 =
almost always); a sample item is “ Are most of your
friends responsible?“ The third asset is “Future Aspira-
tions” with two i tems (response options 1 = not impor-
tant at all; 2 = somewh at important; 3 = very important;
4 = extremely important); a sample item is “As you look
into the future, how important is it that you do well in
school?“ The fourth asset is “Responsible Choices” with
three items (response options 1 = not at all like you; 2 =
a little like you; 3 = mostly like you; 4 = very much like
you); a sample item is “You can say ‘no’ to activities you
think are wrong.” The f ifth asset is “Non-Parental Adult
Role Models” with four items (response options 1 =
strongly disagree; 2 = disagree; 3 = agree; 4 = strongly
agree); a sample item is “You know at least one adult on
campus you could talk with about personal problems.”
The sixth asset is “Spirituality” and contains six items
(response options 1 = strongly agree; 2 = ag ree; 3 = dis-
agree; 4 = strongly disagree); a sample is “Spirituality is
very important to me.” The seventh asset is “Community
Involvement” contains four items (response options 1 =
not at all like you; 2 = a little like you; 3 = mostly like
you; 4 = very much like you); a sample item is “ You
work to make your community a better place.” The final
asset is “ Cultural Respect/Life” contains three items
(response options 1 = not at all like you; 2 = a little like
you; 3 = mostly like you; 4 = very much like you); a
sample item is “You respect the beliefs of people even if
they are of a different race.”
In this study, the Cron-
bach’ s alphas for the eight asset subscales are .76
(Family Communication), .80 (Peer Role Models), .55
(Future Aspirations), .71 (Responsible Choices), .74
(Non-Parental Role Models), .90 (Spirituality), .88 (Com-
munity Involvement), and .76 (Cultural Respect/Life).
Brief Multidimensional Students’ Life Satisfaction Scale
(BMSLSS-C)
The BMSLSS-C consists of one item for each of 7 life
satisfaction domains (i.e., family, friends, school, self,
Table 1 Sample Demographics
Characteristic Number of Respondents
(N = 723)
Age group (years)
18 yrs 93 (12.9%)
19 yrs 172 (23.8%)
20 yrs 177 (24.5%)
21 yrs + 281 (38.9%)
Year
First year 193 (27.7%)
Sophomore 155 (21.4%)
Junior 203 (28.1%)
Senior 172 (23.8%)
Gender
Male 232 (32.1%)
Female 491 (67.9%)
Race
White 654 (90.5%)
Nonwhite 69 (9.5%)
Zullig et al. Health and Quality of Life Outcomes 2011, 9:52
/>Page 3 of 10
living environment, romantic relationships, physical
appearance) determined to be valid and reliable in col-
lege students [38]. The item assessing satisfaction in
one’s family life is “I would describ e my satisfaction with
my family life as,” whereas “ I would describe my satis-
faction with my physical appearance as” assesses physi-
cal appearance satisfaction and so forth. Response
options are from the widely used Delighted-Terrible
Scale [39] and include 1 = terrib le, 2 = unhappy, 3 =
mostly dissatisfied, 4 = mixed (about equally satisfied
and dissatisfied ), 5 = mostly satisfied, 6 = pleased, and 7
= delighted. Although a global life satisfaction item can
also be used as a part of the BMSLSS-C, it was not
included in the study due to redundancy. The Cron-
bach’s alpha for BMSLSS-C in this study is .80.
The Centers for Disease Control and Prevention’s HRQOL-14
The HRQOL-14 is based on research with adults age 18
or older. The original survey consisted of four core
questions on the Behavioral Risk Factor Surveillance
System (BRFSS) [40,41]. Item 1 focuses on self-perceived
health with response options of “excellent,”“very good,”
“good,”“fair,” and “ poor.” Items 2 and 3 relate to recent
physical and mental health symptoms and are consid-
ered mutually exclusive and were worded as such: “Now
thinking about your physical (or mental) health, for how
many days during the past 30 days was your physical
(or mental) health not good?“ Item 4 is conceptualized
as a global measure of disability that explicitly incorpo-
rates both physical and mental health: “During the past
30 days, on how many days did poor physical or mental
health keep you from doing your usual activities ?“ In
1995, an optional 10-item set of health perception and
activity limitation items was added to the BRFSS. These
items cover areas such as sleep, anxiousness/worrying,
pain, and feeling full of energy (all during the pa st 30
days). All response options to the scale “days” items
were identical and assessed the number of days that
symptoms were experienced: 0 days, 1-2 days, 3 to 5
days, 6 to 9 days, 10 to 19 days, 20 to 29 days, and all
30 days.
Hennessey et al. [41] o riginally established the con-
struct validity of the four core questions. Additional
validation research has revealed that the HRQOL-14
demonstrated good construct, criterion, and known-
groups validity and that it could be considered for both
surveillance and research applications when compared
to the Rand Corporation’s Short Form-36 (SF-36) [42].
The SF-36[43] is generally considered the “gold stan-
dard” for quality of life (QOL) research. Other validity
research found the HRQOL-14 identified known or sus-
pected population groups with unmet health-related
needs, including those who reported chronic health con-
ditions, disabilities, a nd low socioeconomic status (SES)
[44-46]. T he HRQOL scale also exhibits validity among
college students [47]. Reliability studies reveal consider-
able test-retest reliability [48,49].
Data Analysis
Analysis Plan
Multiple structural equation models (SEM) examined
the proposed relationships among the developmental
assets, life satisfaction, and HRQOL. The relationships
between the constructs were assessed using Mplus ver-
sion 4.21 [50] using maximum likelihood estimation.
SEM procedures were selected for this investiga tion
because they offer several advantages over traditional
multivariate methods (e. g.,ANOVA,MANOVA,etc.).
First, because most outcomes (HRQOL and life satisfac-
tion) have multiple predictors (developmental assets)
that interact, SEM examines dependent and independent
variables at once. Second, SEM procedures allow for the
inspection of relationships among latent variables
(underlying, but not directly measured) and multiple
observed measures.
Models were proposed based upon theoretical predic-
tions and examined using the following criteria: (1) t he-
oretical salience, (2) glob al fit indi ces (chi-square
goodness of fit, Comparative Fit Index: CFI & Tucker-
Lewis Index: TLI), (3) microfit indices (parameter esti-
mates, Root Mean Squared Error of Approximation:
RMSEA, and residuals), and (4 ) parsimony. The oretical
fit was examined with respect to documented theory
and previous research. For the global fit indices, a non-
significant chi-square indicates that the data does not
significantly differ from the hypotheses represented by
the model; for CFI and TLI, fit indices of above 0.90
(preferably above 0.95) are the criteria utilized to indi-
cate a well-fitting model ( CFI: [51]; TLI: [51]). For
RMSEA, a fit of less than 0.05 indicates a well-fitting
model [52]. Finally, requiring parsimony leads to the
retention of a model with the fewest parameters that
still meet the other criteria.
Results
Descriptive Statistics
HRQOL
A majority of the participants reported “excellent” or
“very good” self-rated health (70.28%). Days in the past
month where the participants’ mental health was not
good were: 0 d ays - 21.71%; 1-2 days - 32.03%; 3-5 days
- 21.31%; 6+ days 22.95%. Days in the past month
where the participants’ physical health was not good
were: 0 days - 24.21%; 1-2 days - 36.32%; 3-5 days -
22.46%; 6+ days - 17.02%. Days in the past month
where participants’ mental and physical health was
keeping them from their normal activities were: 0 days -
47.07%; 1-2 days - 31.97%; 3-5 days - 12.43%; 6+ days -
8.53%. Days in the past month where the participants’
Zullig et al. Health and Quality of Life Outcomes 2011, 9:52
/>Page 4 of 10
felt worried, tense, or anxious were: 0 days - 8.02%; 1-2
days - 26.56%; 3-5 days - 23.53%; 6+ days - 41.89%.
Days in the past month where the participants’ did not
get enough sleep were: 0 days - 2.85%; 1-2 days -
10.52%; 3-5 days - 20.68%; 6+ days - 65.95%. Finally,
days in the past month where the participants’ felt very
healthy and full of energy were: 0 days - 1.96%; 1-2 days
- 7.86%; 3-5 days - 13.39%; 6+ days - 79.78%.
Life Satisfaction
Means and standard deviations were calculated for the
BMSLSS-C domains (Table 2). There was little variation
among the mean scores for the Friendships, School, Self,
Living Environment, and Physical Appearance domains
with most falling within “mostly satisfied.” The excep-
tion was the Family domain, which participants reported
being “ pleased.” Some greater variation was also
observed in the Romantic Relationships domain.
Developmental Assets
Similar to previous research [36,37], a cut-off system
was derived to separate the students into those who had
specific developmental assets and those who did not.
For Family Communication, Peer Role Models, Future
Aspirations, Responsible Choices, a nd Community
Involvement, individuals with a score higher than 2
(thereby selecting 2: usually/very important/mostly like
you or 3: almost always/extremely important/very much
like you) were interpreted as having the asset. With
respect to Non-parental Adult Role Models and Cultural
Respect/Life, individuals with a score 1 or lower (indi-
cating a selection of 0: strongly agree or 1: agree) would
have the asset. In terms of Spirituality, a score of 2 or
lower (2: agree and 1: strongly agree) would represent
the presence of the asset. Table 3 presents the percent
of students with each developmenta l asset. Over 7% o f
the students reported posses sing none of the develop-
mental assets while 3.9% reported possessing all eight
assets.
Structural Equation Models
The final models resulting from the SEM procedures
eliminated some items from the developmental asset
measure and the HRQOL-14 due to model global fit
indices, microfit indices, or parsimony. Items removed
from the developmental asset measure were from the
constructs of Spirituality ("I am very spiritual” and “Iam
very religious” ) and Cultural Respect ("I respect the
beliefs of people even if they are of a different race”).
Items eliminated from the HRQOL-14 were questions
about physical health status and included self-rated
health, days of poor physical health, and days full of
energy. No items from the BMSLSS-C were eliminated
from the final models.
Variations of the final model as predicted by theory
were examined (contact the primary author for a table
of results of all models tested). The primary goal of
the proposed mod els was to use the Developmental
Assets to simultaneously predict HRQOL and Life
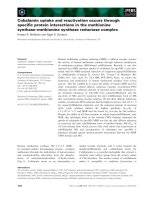
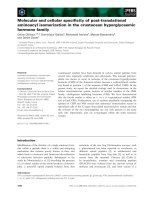
Satisfaction. Figure 1 presents the final model and
parameter estimates. The final m odel fit the data well,
c
2
(n = 581, 515) = 1252.23, CFI = .94, TLI = .93,
RMSEA = .05.
Three significant pathways are demons trated in Figure
1. First, respondents who reported higher levels of
Family Communication also reported higher life satisfac-
tion. Second, individuals who reported higher levels of
Future Aspirations also indicated poorer mental
HRQOL days. F inally, the third significant pathway in
the model suggests that in the sample, the developmen-
tal asset of Non -Parental Role Models is indirectly
related to decreased life satisfaction and directly related
to poor mental HRQOL days.
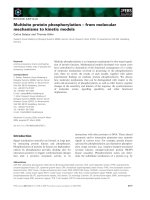
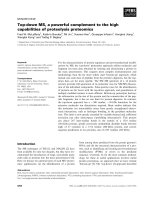
Invariance Tests of the Model across Gender
Initial tests examined the dependent variables across
gender (see Figure 2). In Figure 2, estimates for males
and females are provided for each variable, with
female estimates in parentheses. Male participants
were more likely to report zero poor mental health
days than female participants, c
2
( n = 562, 6) = 20.28,
p = .002. Men and women did not differ significantly
on their health keeping them from their daily activ-
ities, c
2
(n = 563, 6) = 11.86, p =.07.Womenreported
more days that they felt tense or anxious in compari-
son to the men, c
2
(n = 561, 6) = 38.07, p <.001.
There were no gender differences on the number of
Table 2 Mean BMSLSS-C scores
M SD
Family 6.08 1.04
Friendships 5.87 1.05
School 5.29 1.22
Self 5.49 1.19
Environment 5.23 1.32
Romantic Relationships 4.95 1.66
Physical Appearance 4.95 1.24
Table 3 Distribution of Developmental Assets
Asset Mean SD % with Asset
1. Family Communication 2.20 .71 73.7
2. Peer Role Models 2.38 .54 86.1
3. Future Aspirations 2.39 .61 84.3
4. Responsible Choices 2.59 .41 95.5
5. Non-parental Adult Role Models 1.23 .67 50.5
6. Spirituality 1.69 1.13 35.9
7. Community Involvement 1.46 .79 30.7
8. Cultural Respect/Life 1.22 .59 51.0
Zullig et al. Health and Quality of Life Outcomes 2011, 9:52
/>Page 5 of 10
days not getting enough sleep, c
2
(n = 561, 6) = 2.72, p
= .84 or on any of the BMSLSS-C items, (Males: n =
160, M = 38.39, SD = 6.42; Females: n =400,M
=37.68,SD =5.67),t(558) = 1.29, p =.20,Cohen’s
d = .12.
Tests of factorial invariance were performed on the
final model, and the overall chi-square was significant,
c
2
(1055) = 2591.68, p < .001, CFI = .96, TLI = .95,
RMSEA = .06. For both models, the male and female
participants’ Family Communication predicted Life
Satisfaction, and both Future Aspirations and Non-Par-
ental Role Models predicted poor Mental HRQOL. In
the male participant model only, Future Aspirations pre-
dicted Life Satisfaction. In the female participant model
only, Responsible Choices predicted Life Satisfaction.
The model examining invariance across male and female
participants is presented in Figure 2.
Discussion
Previous research has explored the relat ionships
between developmental assets and a variety of risk beha-
viors [7,9-12,36,37,53,54]. This body of research collec-
tively suggests that the greater number of assets an
adolescent possesses, the more they are protected
against maladaptive behavior. Life satisfaction r esearch
[21-23,25,28] also suggests a similar relationship, which
is why life satisfaction has been suggested to be an
important health outcome [29]. HRQOL is an important
protective health construct against behaviors such as
unsafe alcohol use in college students [47]. However, no
prior research has attempted to examine the concurrent
relationships between developmental assets and both life
sati sfaction and HRQOL . Therefore, understanding how
each of these important areas relates to one another has
important implications for health promotion practice.
.52***
.65***
.71***
.86***
.55***
.49***
.69***
.74***
.55*** .84*** .61***
.39***
14 ns
05 ns
.18 ns
19**
.21 **
07 ns
.11 ns
10 ns
.07 ns
.01 ns
.45***
15 ns
.01 ns
08 ns
.11 ns
34***
S a tis f acti o n w ith
Family Life
S a tis f acti o n w ith
F r ien d s h ip s
S a tis f acti o n w ith
my School
Exp erien ce
S a tis f acti o n w ith
My s elf
S a tis f acti o n w ith
W her e I Liv e
S a tis f acti o n w ith
my Romantic
R ela tio n s h ip s
S a tis f acti o n w ith
my P hy sical
A p pear an ce
Life
S atisf action
Days Mental
Health was not
Good
Days Mental/Physical
H ealth k eep y o u f r om
A ctiv ities
Days Worried/
tense/ anxious
Days not
enough sleep
H e alth Related
Quality of Life
Family
Communication
P eer Role
Mo d els
Future
Aspirations
Respo nsible
Ch o ices
Non-
parental
Role Mo del
S p ir itu ality
Commu nity
In vo lv emen t
Cultu ral
Respect
X
2
(n=581, 58 4)=1749.15
CFI= .9 2
TLI=.91
RMSEA =.06
*p=.05, **p=.01, ***p=.001,
ns = non-significant
Figure 1 Final Model of the Developmental Assets’ Relationship with Life Satisfaction and HRQOL.
Zullig et al. Health and Quality of Life Outcomes 2011, 9:52
/>Page 6 of 10
Thepresentstudyextendsthepreviousliteratureto
college students and offers additional support for the
connection between positive family communication and
increased life satisfaction. Specifically, positive family
support, parental a cceptance, and communication are
among the most influential factors determining life satis-
faction among adolescents [55,56]. In addition, parental
support and positive reinforcement help to smooth the
transition into college and reduce student levels of lone-
liness, increase psychological adjustmen t, and i ncrease
academic achievement. Not surprisingly, there is also
positive relationship between increased levels of life
satisfaction and positive psychosocial functioning [55].
Conversely, the findings pertaining to Non-Parental
Role Models and Future Aspirat ions were somewhat
unexpected. The results from this investigation indicate
that Non-Parental Role Models had a significant
relationship with decreased l ife satisfaction, as well as a
significant positive relationship with poor mental
HRQOL days (e.g., days worried or tense). Prior
research has indicated that the presence of developmen-
tal assets such as Non-Parental Role Models and adult
support play an important role in overall adolescent
development [57]. Constructive-natured relationships
with adults have also been related to positive outcomes
in younger samples of adolescents [58,59] and positive
outcomes in teenagers.
However, Beam et al . [58] found that high school stu-
dents who utilized non-parental role models (or “very
important people”) did not seek these relationships as a
means to deal with personal challenges (such as poor
mental HRQOL). Rather, it was determined that stu-
dents formed the associations out of normal daily cir-
cumstances. In other words, Beam et al. [58] found that
Figure 2 Model Invariance across Gender.
Zullig et al. Health and Quality of Life Outcomes 2011, 9:52
/>Page 7 of 10
utilization of non-parental adult relationships had very
littletodowiththestudent’s own personal problems.
Although somewhat speculative, the high school envir-
onment , where students find themselves in the presence
of non-parental adults for the majority of the day, may
be different from the college environment where stu-
dents lead more independent schedules and are older in
age. Thus, it is not surprising that school climate
research has identified student-adult relationships as
one of the most important domains for high school and
middle school students [60,61] because students have
interactions with non-parental adults as an intrinsic
characteristic of their surroundings.
In contrast, students in c ollege settings without spe-
cialized arrangements such as faculty-in-residence pro-
grams [62] may not have the opportunity to take
advantage of such relationships with potential non-par-
ental role models. Programs such as faculty-in-residence
programs may offer students a mode of existence that is
reminiscent of the naturally occurring environment
within high schoo ls. A supplementary point of interest
lies in the limitations of student benefits for those rely-
ing solely on a formal classroom setting as a medium
for interactions. For example, the degree of formali ty in
a c ollegiate classroom has shown to be less effective [in
regards to st udent outcomes] in comparison to informal
interplay between professors and students [63]. How-
ever, even with the benefits of ca sual professor-student
relationships documented, methods for novel ways to
efficiently encourage these interactions remain a chal-
lenge [62]. In sum, interactions with potential non-par-
ental role models in co llege settings may be naturally
less supportive, which may increase poor mental
HRQOL days as a result.
The finding in relation to Future As pirations predict-
ing poor mental HRQOL was also unexpected. Previous
research indicates that the development of future aspira-
tions within an individual is correlated with a healthier
level of development and lower likelihood of engaging
in risk-taking b ehavior in high school students [10,11].
Quaglia and Cobb [64] define future aspirations as “a
student’s ability to identify and set goals for the future,
while being inspired in the present to work toward
those goals.” During an adolescent’s high sc hool years,
serious consideration in regards to future education and
occupation often commences [65]. Numerous f actors
such as media influence (i.e. implied career prestige),
family attitudes, acad emic engagement and achievement,
and peer-related gender stereotypes (such as the schema
that women become nurses and men become physi-
cians) play a role in the formation of occupational future
aspirations [65,66]. Althou gh tentative, college students
may harbor a greater temporal urgency for the rigors of
the work world and may be more cognizant of the
barriers of entry into an increasingly competitive work-
force. The educational mission of college may further
intensify these concerns in relation to those of high
school, which may in turn cause greater worry, anxiety,
and loss of sleep, which then reduces mental HRQOL.
Study Limitations
Limitations to the present study include a Caucasian
sample of universit y students representing one Midwes-
tern university. Additional investigations should be con-
ducted in more diverse university populatio ns in
different geographic regions in both urban and rural set-
tings, as findings reported here may yield different
results in different populati ons of university studen ts. In
addition, several developmental asset measures con-
tained only two items either to begin with (e.g., Future
Aspirations) or because of our model parameters led to
item exclusion within a construct (e.g., Cultural
Respect/Life). Considering that one of the significant
pathways in the final model was Future Aspirations,
results here should be interpreted cautiously. Finally, a
56% response rate was achieved in this study, which
may limit the generalizability of the findings.
Conclusions
Guthman et al. [67] found during a 12-year comparative
study that college students are experiencing higher levels
of mental distress than what was witnessed a decade
ago. However, the determination of exactly what cata-
lyzed t he increase in rates of severe depression, anxiety
and emotional turmoil in college students requires
further investigation. The analysis of these findings by
colleges and universities may prove useful for the amel i-
oration of current standar ds which may have encour-
aged deficiencies in these important facets wellbeing (e.
g., school programs which indirectly lead to limited
family communication). In addition, developing a deeper
understanding of the source of the aforementioned find-
ings is useful in assisting universities with the aim of
lowering attrition rates. Decreasing attrition among the
student body is a commonly found when student con-
cerns bear a direct influence on the adaptation of cam-
pus policies - such as determining standards regarding
the quality of dormitory living facilities [68]. It should
also be noted here that life satisfaction levels among col-
lege students were able to significantly predict academic
retention by themselves, but also in combination with
overall grade point averages (GPA) 1-3 years in advance
[69]. Hence, future studies might seek to extend the
models in this study by including longitudinal constructs
and retention rates.
Likewise, the results of this study may be util ized for
examining the type of support non-parental role models
are providing students in colleges. While students may
Zullig et al. Health and Quality of Life Outcomes 2011, 9:52
/>Page 8 of 10
have frequent contact with academic advisors and
instructional faculty who provide them informational
support, students may also need other forms of social
support such as emotional (e.g., trust, caring, etc.),
instrumental support (aid th at directly assists a perso n
in need), and appraisal support (constructive feedback,
affirmation, etc.) that have been shown to improve
health outcomes [70,71]. Establishing a framework for
meetings where mult iple forms of support are displaye d
by non-parental role models at set in tervals may not
only reestablish the nature of the relationships of those
observed in high school students (e.g., [58]), but also
may prove useful over potentially waiting for personal
problems to develop. Furthermore, the results of this
research may help guide effective additional activities,
such as community and family support programs [72]
which have been established as a fruitful endeavor
towards the main goal of improving the overall QOL of
the campus student body [73].
Abbreviations
BMSLSS-C: Brief Multidimensional Students’ Life Satisfaction Scale; BRFSS:
Behavioral Risk Factor Surveillance System; HRQOL: health-related quality of
life; PYD: Positive youth development; QOL: quality of life; SEM: structural
equation models; SF-36: Rand Corporation’s Short Form-36; US CDC: Uni ted
States Centers for Disease Control and Prevention
Author details
1
Department of Community Medicine, West Virginia University, Morgantown,
WV, USA.
2
Department of Kinesiology and Health, Miami University of Ohio,
Oxford, OH, USA.
Authors’ contributions
KJZ conceived and designed the study, collected the data, participated in
the analysis and interpretation of the data, and coordinated all aspects of
the manuscript. DAT participated in drafting the manuscript. RMW
participated in the analysis and interpretation of the data and in drafting the
manuscript. All parties have received the manuscript and have reviewed it.
Competing interests
The authors declare that they have no competing interests.
Received: 11 April 2011 Accepted: 13 July 2011 Published: 13 July 2011
References
1. Roth J, Brooks-Gunn J, Murray L, Foster W: Promoting health adolescents:
Synthesis of youth development program evaluation. J Adolesc Res 1998,
8:423-459.
2. Benson PL, Scales PC, Hamilton SF, Sesma A Jr, Hong KL, Roehlkepartain EC:
Positive youth development so far: Core hypotheses and their
implications for policy and practice. Search Institute Insights & Evidence
2006, 3(1):1-13.
3. Roehlkepartain EC, Hong KL, Scales PC: Boosting student achievement by
building developmental assets: new research strengthens the case.
Minnesota School Boards Association Journal 2005, 58:16-18.
4. Scales PC, Leffert N: Developmental assets: A synthesis of the scientific
research on adolescent development. Minneapolis, MN: Search Institute;
1999.
5. Sesma A Jr, Roehlkepartain EC: Unique strengths, shared strengths:
Developmental assets among youth of color. Search Institute Insights &
Evidence 2003, 1(2):1-13.
6. Lerner RM: Theories of human development: Contemporary perspectives.
In Handbook of child psychology: Theoretical models of human development.
Volume 2 5 edition. Edited by: Damon W, Lerner RM. New York: Wiley;
1998:1-24.
7. Benson PL, Scales PC, Hawkins JD, Oesterle S, Hill KG: Executive Summary:
Successful Young Adult Development. 2004, 1-23.
8. Aspy CB, Oman RF, Vesley SK, McLeroy K, Rodine S, Marshall L: Adolescent
violence: The protective effects of youth assets. J Couns Dev 2004,
82:269-277.
9. Atkins L, Oman RF, Vesley S, Aspy CB, McLeroy K: Adolescent tobacco use:
The protective effects of developmental assets. Am J Health Promot 2002,
16:198-205.
10. Oman RF, Vesley SK, Aspy CB, McLeroy K, Luby C: The association between
multiple youth assets and sexual behavior. Am J Health Promot 2004,
19(1):12-18.
11. Vesly SK, Wyatt VH, Oman RF, Aspy CB, Kegler MC, Rodine S, Marshall L,
McLeroy KR: The potential protective effects of youth assets from
adolescent sexual risk behaviors. J Adolesc Health 2004, 34:356-365.
12. Oman RF, Vesely S, Aspy CB, McLeroy KR, Rodine S, Marhsall L: The
protective effect of youth assets on adolescent alcohol and drug use.
Am J Public Health 2004, 94:1425-1430.
13. Pancer SM, Hunsberger B, Pratt MW, Alistat S: Cognitive complexity of
expectations and adjustment to university in the first year. J Adolesc Res
2000, 15:38-57.
14. Wintre MG, Yaffe Y: First-year students’ adjustment to university life as a
function of relationships with parents. J Adolesc Res 2000, 15:9-37.
15. Roehlkepartain EC, Benson PL, Sesma A: Signs of Progress in Putting
Children First: Developmental Assets among Youth in St. Louis Park,
1997-2001. 2003, 1-61.
16. Diener E:
Subjective well-being: The science of happiness and a proposal
for a national index. Am Psychol 2000, 55:34-43.
17. Zullig KJ, Valois RF, Huebner ES, Drane JW: Associations among family
structure, demographics and adolescent perceived life satisfaction. J
Child Fam Stud 2005, 14:195-206.
18. Diener E, Suh E, Oishi S, Lucas R, Smith HL: Subjective well-being: Three
decades of progress. Psychol Bull 1999, 125:276-302.
19. Pavot W, Diener E: Review of the satisfaction with life scale. Psychol
Assessment 1993, 5(2):164-172.
20. Centers for Disease Control and Prevention: Measuring Healthy Days.
Atlanta; 2000, 8.
21. Valois RF, Zullig KJ, Huebner ES, Drane JW: Relationship between life
satisfaction and violent behaviors among adolescents. Am J Health Behav
2001, 25(4):353-366.
22. Zullig KJ, Valois RF, Huebner ES, et al: Relationship between perceived life
satisfaction and adolescents’ substance abuse. J Adolesc Health 2001,
29:279-288.
23. Valois RF, Zullig KJ, Huebner ES, Kammermann SK, Drane JW: Relationship
between of life satisfaction and sexual risk-taking behaviors among
public high school adolescents. J Child Fam Stud 2002, 11(4):427-440.
24. Esch LM, Zullig KJ: Middle school students’ weight perceptions, dieting
behaviors, and life satisfaction. American Journal of Health Education 2008,
39:345-352.
25. Valois RF, Zullig KJ, Huebner ES, Drane JW: Relationship between
perceived life satisfaction and dieting behavior among public high
school adolescents. Eating Disorders: The Journal of Treatment and
Prevention 2003, 11:271-288.
26. Zullig KJ, Pun SM, Huebner ES: Life satisfaction, dieting behavior, and
weight perceptions among college students. Applied Research in Quality
of Life 2007, 2:17-31.
27. Valois RF, Zullig KJ, Huebner ES, Drane JW: Life satisfaction and suicide
among high school adolescents. Soc Indic Res 2002, 64(3):1-25.
28. Valois RF, Zullig KJ, Huebner ES, Drane JW: Physical activity behaviors and
perceived life satisfaction among public high school adolescents. J Sch
Health 2004, 74(2):59-65.
29. Huebner ES, Valois RF, Suldo SM, Smith LC, McKnight CG, Seligson JJ, et al:
Perceived quality of life: a neglected component of adolescent health
assessment and intervention.
J Adolesc Health 2004, 34(1):1-9.
30. Valois RF, Zullig KJ, Huebner ES, Drane JW: Youth developmental assets
and perceived life satisfaction: Is there a relationship? Applied Research
Quality Life 2009, 4:315-331.
31. Centers for Disease Control and Prevention: Behavioral Risk Factor
Surveillance System (BRFSS).[ />Zullig et al. Health and Quality of Life Outcomes 2011, 9:52
/>Page 9 of 10
32. Collishaw S, Maughan B, Goodman R, Pickles A: Time trends in adolescent
mental health. J Child Psychol Psychiatry 2004, 45(8):1350-1362.
33. Twenge JM: Generation Me: Why Today’s Young Americans Are More
Confident, Assertive, Entitled - and More Miserable than Ever Before.
New York: Free Press;, First 2007.
34. SAS Institute Inc: SAS® 9.1.3 User’s Guide. Cary, NC: SAS Institute Inc; 2006.
35. Pealer LN, Weiler RM, Pigg RM, Dorman S: The feasibility of a web-based
surveillance system to collect risk behavior data from college students.
Health Educ Behav 2001, 28(5):547-559.
36. Oman RF, Vesley SK, McLeroy KR, Harris-Wyatt V, Aspy CB, Rodine S,
Marshall L: Reliability and validity of the youth asset survey (YAS). J
Adolesc Health 2002, 3(1):247-255.
37. Zullig KJ, Ward RM, King KA, Patton JM, Murray KM: Testing the Feasibility
of Developmental Asset Measures on College Students to Guide Health
Promotion Efforts. Assessment 2009, 16(1):31-41.
38. Zullig KJ, Huebner ES, Patton JM, Murray KA: The Brief Multidimensional
Student’s Life Satisfaction Scale–College version. Am J Health Behav 2009,
33(5):483-493.
39. Andrews FM, Withey SB: Social Indicators of Well-Being: Americans’
Perceptions of Life Quality. New York: Plenum; 1976.
40. Centers for Disease Control and Prevention: Quality of Life as a New
Public Health Measure-Behavior Risk Factor Surveillance System. MMWR
Morb Mortal Wkly Rep 1994, 43(20):375-380.
41. Hennessy CA, Moriarty DG, Zack MM, et al: Measuring health-related
quality of life for public health surveillance. Pub Health Rep 1994,
109(5):665-672.
42. Issued by Centers for Disease Control and Prevention (US), Newschaffer CJ:
Validation of the BRFSS HRQOL measures in a statewide sample. Final
Report. Atlanta (GA): Department of Health and Human Services (US), Office
of Disease Prevention and Health Promotion; Prevention Centers Grant No.
U48/CCU710806-01; 1998.
43. Ware JE, Sherbourne DC: The MOS 36-item Short Form Health Survey (SF-
36): Conceptual framework and item selection. Med Care 1992,
30(6):473-483.
44. Andresen EM, Fouts BS, Romeis JC, et al: Performance of health-related
quality-of-life instruments in a spinal cord injury population. Arch Phys
Med Rehabil 1999, 80:877-884.
45. Diwan S, Moriarty D: A conceptual framework for identifying unmet
health care needs of community dwelling elderly. J Appl Gerontol 1995,
14(1):47-63.
46. Nanda U, Andresen EM:
Performance measures of health-related quality
of life and function among disabled adults [abstract]. Qual Life Res 1998,
7:644.
47. Zullig KJ: Using the centers for disease control and prevention’s core
health-related quality of life scale on a college campus. Am J Health
Behav 2005, 29(6):569-578.
48. Andresen EM, Catlin TK, Wyrich KW, et al: Retest reliability of surveillance
questions on health related quality of life. J Epidemiol Community Health
2003, 57:339-343.
49. Kapp J, Jackson-Thompson J, Petroski G, et al: Reliability of health-related
quality-of-life indicators in cancer survivors from a population-based
sample, 2005, BRFSS. Public Health 2009, 123(4):321-325.
50. Muthén LK, Muthén BO: MPlus User’s Guide. Los Angeles, CA: Muthén &
Muthén; 2007.
51. Hu LT, Bentler PM: Cutoff criteria for fit indices in covariance structure
analyses: Conventional criteria versus new alternatives. Structural
Equation Modeling 1999, 6:1-55.
52. Browne MW, Cudeck R: Alternative ways of assessing model fit. In Testing
structural equation models. Edited by: Bollen KA, Long JS. Newbury Park, CA:
Sage; 1993:136-162.
53. Edwards O, Mumford V, Shillingford M, Serra-Roldan R: Developmental
Assets: A Prevention Framework for Students Considered at Risk.
Children & Schools 2007, 29(3):145-153.
54. Leffert N, Benson P, Scales P, Sharma A, Drake D, Blyth D: Developmental
Assets: Measurement and Prediction of Risk Behaviors Among
Adolescents. Applied Developmental Science 1998, 2(4):209.
55. Suldo SM, Huebner S: The role of life satisfaction in the relationship
between authoritative parenting dimensions and adolescent problem
behavior. Soc Indic Res 2004, 66(1-2):165-195.
56. Seibel FL, Johnson WB: Parental control trait anxiety and satisfaction with
life in college students. Psychol Rep 2001, 88:473-480.
57. Greenberger E, Chen C, Beam MR: The role of very important nonparental
adults in adolescent development. J Youth Adolesc 1997, 27(3):321-343.
58. Beam M, Chuansheng C, Greenberger E: The Nature of Adolescents’
Relationships With Their ‘Very Important’ Nonparental Adults. Am J
Community Psychol 2002,
30(2):305.
59. Chew W, Osseck J, Raygor D, Eldridge-Houser J, Cox C: Developmental
Assets: Profile of Youth in a Juvenile Justice Facility. J Sch Health 2010,
80(2):66-72.
60. Ito A, Smith DC: Predictors of school satisfaction among Japanese and
US youth. The Community Psychologist 2006, 38:19-21.
61. Zullig KJ, Koopman TM, Patton JM, Ubbes VA: School climate: historical
review instrument development & school assessment. J Psychoeduc
Assess 2010, 28(2):139-152.
62. Bradley EC, Elizabeth O: Faculty-Student Interaction Outside the
Classroom: A Typology from a Residential College. Review of Higher
Education 2007, 30(4):343-362.
63. Cotton SR, Wilson B: Student-faculty interactions: Dynamics and
determinants. Higher Education 2006, 51:487-519.
64. Quaglia RJ, Cobb CD: Toward a theory of student aspirations. Journal of
Research in Rural Education 1996, 12(3):127-132.
65. Mei T, Wei P, Newmeyer MD: Factors Influencing High School Students’
Career Aspirations. Professional School Counseling 2008, 11(5):285-295.
66. Creed PA, Conlon EG, Zimmer-Gembeck MJ: Career barriers and reading
ability as correlates of career aspirations and expectations of parents
and their children. Journal of Vocational Behavior 2007, 70:242-258.
67. Guthman JC, Iocin L, Konstas D: Proceedings of Increase in Severity of Mental
Illness Among Clinical College Students: A 12-Year Comparison San Diego;
2010.
68. Davidson WB, Beck HP, Milligan M: The College Persistence Questionnaire:
Development and Validation of an Instrument That Predicts Student
Attrition. J Coll Stud Dev 2009, 50(4):373-390.
69. Frisch MB, Clark MP, Rouse SV, Rudd MD, Paweleck JK, Greenston A,
Kopplin DA: Predictive and treatment validity of life satisfaction and the
quality of life inventory. Assessment 2005, 12:66-78.
70. Berkman LF, Glass T: Social Integration Social Networks Social Support
and Health. In Social Epidemiology. Edited by: Berkman LF, Kawachi I. New
York: Oxford University Press; 2000:.
71. Uchino B: Social support and health: A review of the physiological
processes potentially underlying links to disease outcomes. J Behav Med
2006, 29:377-387.
72. Scales PC: The Role of family support programs in building
developmental assets among young adolescents: a national survey of
services and staff training needs. Child Welfare
1997, 76(5):611-635.
73. Scales PC, Roehlkepartain EC: Boosting student achievement: New
research on the power of developmental assets. Search Institute Insights &
Evidence 2003, 1(1):1-10.
doi:10.1186/1477-7525-9-52
Cite this article as: Zullig et al.: Not all developmental assets are related
to positive health outcomes in college students. Health and Quality of
Life Outcomes 2011 9:52.
Submit your next manuscript to BioMed Central
and take full advantage of:
• Convenient online submission
• Thorough peer review
• No space constraints or color figure charges
• Immediate publication on acceptance
• Inclusion in PubMed, CAS, Scopus and Google Scholar
• Research which is freely available for redistribution
Submit your manuscript at
www.biomedcentral.com/submit
Zullig et al. Health and Quality of Life Outcomes 2011, 9:52
/>Page 10 of 10