Recycling of Plastic Materials Part 4 ppt
Bạn đang xem bản rút gọn của tài liệu. Xem và tải ngay bản đầy đủ của tài liệu tại đây (814.2 KB, 17 trang )
Thermal analysis
The melting and crystallization behaviors were studied in a Mettler TA 3000
DSC. The non-isothermal crystallization was performed as follows: heating at
20
o
C/min up to 200
o
C, 3 min. of dwelling time, cooling down at cooling rates vari-
able from 30 to 1
o
C/min.
RESULTS AND DISCUSSION
Rheology
The rheological behavior of polyolefin blends has been widely studied by many
authors. It was found that the shear viscosity exhibits maxima and minima
when plotted as a function of composition. In general, the viscosity vs. shear
stress trends for the binary blends, which present negative (PS/LDPE, PS/PP,
PS/HDPE)
16-21
and positive (PP/HDPE)
22
deviations, cannot be super-imposed
into a master curve by a simple horizontal shift. In other words, the shape of de-
pendence changes with composition.
E. Gattiglia et al. 43
Figure 1. Viscosity of homopolymers vs. shear rate at 190
o
C.
In our case, also considering the rather complicate composition of the mix-
tures, we do not intend to fully studythe rheological characteristics of thesema-
terials, but simply to check whether such blends may present melt properties
which can prevent processability with usual machinery. Figures 1 and 2 show
the viscosity,
η
, vs. shear rate,
&
γ
, of homopolymers and their blends, respectively.
The addition of PP and PS reduces the viscosity of the blends in the range of
44 Recycling of Plastics from Urban Solid Wastes
Figure 2. Viscosity of blends vs. shear rate at 190
o
C.
Table 3
Density and melt flow index measured at 190
o
C
and calculated by the additivity law
Mixture
MFI (g/10 min) Density
experimental calculated (g/cm
3
)
Mix 1 1.19 1.57 0.9234
Mix 2 1.31 2.04 0.9261
Mix 3 1.81 2.01 0.9261
LDPE CF/LDPE EF = 77.8/22.2 1.71 0.92 -
shear rates under investigation and then increases the value of the melt flow in-
dex. In Table 3 experimental MFI values are compared with calculated values
assuming the additivity law. The experimental values are lower than calculated
suggesting that weak interactions among components exist, due to a similar
chemical structure of blend ingredients. Therefore, it seems that the
processability of blends does not present particular problem.
Density
In Table 3 the density values of the Mix 1, 2, and 3 are presented. These values
are about 0.5% higher than those calculated according to the (additivity rule)
weighted average of contributions of several components, assuming that the de-
gree of crystallinity of crystallizable polymers is not affected by the blending. It
can be thus deduced that the blends have a compact structure, without holes or
voids.
Morphology
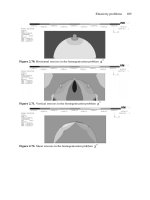
The morphologies of the fracture surfaces of the Mix 2, Mix 3, and Mix 4 are
shown in Figures 3, 4, and 5. The morphology of Mix 1, not reported here, looks
E. Gattiglia et al. 45
Figure 3. SEM micrograph of cold fractured surface of LDPE/HDPE/PP/PS = 81/9/8/2 blend.
46 Recycling of Plastics from Urban Solid Wastes
Figure 4. SEM micrograph of cold fractured surface of LDPE/HDPE/PP/PS = 63/7/24/6 blend.
Figure 5. SEM micrograph of cold fractured surface of LDPE/HDPE/PP/PS = 54/6/32/8 blend.
guishable in such composition. As it will be discussed later, HDPE certainly
gives rise to homodomains inside the LDPE matrix because it crystallizes before
LDPE. However, from the point of view of the morphology LDPE/HDPE 90/10
mixture will be considered homogeneous.
Mix 2 presents a ductile fractured PE matrix with inclusions of PP and PS not
easily recognizable. The same morphological characteristics were observed in
the case of Mix 5 from plastic wastes. The morphology of Mix 3 (Figure 4) pres-
ents clearly visible PS and PP domains. PS domains break with a typical rough,
globular surface while PPdomains,whosesize distribution is broad,on fracture,
expose a circular cross-section with smooth surface. On increasing the amount
of PP (Figure 5) to 32% (Mix 4) this component almost tends to form a co-contin-
uous matrix with PE’s; PS is still visible as separated spherical particles.
It is important to notice that in all blends PS and PP domains are well locked
into the matrix. The interfacial adhesionis good and no voids are observed at the
phase boundary. Of course the structures of the blends are not in thermody-
namic equilibrium, as can be seen by melting and molding the samples in differ-
ent processing conditions. However, no morphological modifications or
shrinkage phenomena were observed by annealing of the mixtures at about
100
o
C for more than two months.
E. Gattiglia et al. 47
Figure 6. Optical micrograph of LDPE/HDPE/PP/PS = 63/7/24/6 blend at 180
o
C. Parallel Nicols.
Magnification 200
×
.
like a single phase material, meaning that the two components are indistin-
Phase segregation is present also in the melt, as can be observed by the optical
microscope. Figure 6 clearly shows segregated PS droplets at 180
o
C, even at a
few percent of PS as in Mix 3. On the contrary, PP domains in the molten state
are visible only when its content is higher than 10 wt%. However, cooling down
slowly one can follow the crystallization of PP as shown in Figure 7 for Mix 3 at
140
o
C.
Crystallization behavior
Since the crystallization process is very important in controlling the morphol-
ogy and thus the mechanical properties, we will discuss in more detail the melt
behavior during cooling. In Figures 8 and 9 the effect of cooling rate on the crys-
tallization temperature, T
c
, of the LDPE, HDPE, and PP pure and in mixture, is
shown.
The point of interest here is the fact that for cooling rate higher than 1
o
C/min.
the T
c
of HDPE is higher than PP and both are, as known, well above that of the
LDPE. Only at verylow cooling rates, PP crystallizes before HDPEand probably
at very fast cooling rate (> 40
o
C/min), they crystallize at the same time. In
Figure 8, the crystallization peaks of PP and HDPE components of Mix 2 merge
48 Recycling of Plastics from Urban Solid Wastes
Figure 7. Optical micrograph of LDPE/HDPE/PP/PS = 63/7/24/6 blend at 140
o
C. Crossed Nicols.
Magnification 200
×
.
E. Gattiglia et al. 49
Figure 8. Crystallization temperatures of pure homopolymers and LDPE/HDPE/PP/PS = 81/9/8/2
blend as a function of cooling rate.
Figure 9. Crystallizationtemperaturesofpurehomopolymersand LDPE/HDPE/PP/PS =54/6/32/8
blend as a function of cooling rate.
multaneous crystallization of HDPE and PP is only due to particular conditions
of cooling and blend compositions. In fact, increasing the PP content (Mix 4) two
peaks occur, when the cooling rate is less than 10
o
C/min (Figure 9).
A comparison between the crystallization behaviors of the Mix 5, prepared
from the light fraction of plastic wastes, and Mix 2, from virgin polymers only
puts into evidence that LDPE of Mix 5 crystallizes earlier than LDPE of Mix 2.
This agrees well with the smaller crystalline grains observed in optical micro-
scope and may be attributed to some nucleating powerof the present impurities.
The T
c
‘s of PP and HDPE in the blends are lower than those of the pure
homopolymers. On the contrary the T
c
of LDPE in the blend is a few degrees
higher than that of the single component and the difference increases on in-
creasing the cooling rate. This behavior is understandable considering the fa-
vorable effect ofthe already crystallized HDPEand PP on the nucleationprocess
of the LDPE. Therefore, the LDPE matrix crystallizes always when HDPE and
PP are solid and PS is below its glass transition. During this crystallization a
volume reduction occurs and the matrix shrinks over the domains of the dis-
persed phases clinging them together very solidly. This is the main reason of a
good contact between the matrixand the different polymer domains, observed in
the electron microscope analysis.
Mechanical properties
Tensile behavior
Values of tensile modulus, E, yielding stress,
σ
y
, tensile strength,
σ
b
, and elon-
gation at break,
ε
b
, of the homopolymers and mixtures are presented in Table 4.
Modulus values of the homopolymers scatter by about
±
5% whereas for blends
by about
±
8%. The scatter of
σ
b
and
σ
y
data ranges from
±
12% for homopolymers
to about
±
18% in the case of blends values;
ε
b
results have wider scatter ranging
from
±
20 to
±
27%.
Reducing the amount of LDPE in a blend, the modulus and the yield stress in-
crease, whereas
σ
b
does not practically change and
ε
b
seems to reach a maximum
for the Mix 3 having 70% PE. The Mix 5, prepared with the light fraction of plas-
tic wastes, shows practically the same tensile modulus and strength as pure
homopolymers (Mix 2); however, samples break before reaching the high defor-
mation of Mix 2, probably due to defects created by impurities not completely re-
moved during the flotation process. The increase of the E modulus, reducing the
percentage of LDPE, is well below the additivity rule prediction, as shown in
50 Recycling of Plastics from Urban Solid Wastes
into one and only one T
c
is detected in the range of cooling rate examined.This si-
Figure 10, even if the morphology does not reveal any kind of holes or voids be-
tween the dispersed phase domains and the matrix.
If we consider the mixtures as a matrix-filler composite in which the matrix is
the LDPE/HDPE blend andthe fillers are PP and PStaken together, it should be
possible to compare our mechanical data with the model developed for poly-
mer-filler systems by Nielsen. We recognize that this approximation is quite
simplistic, because the difference between the moduli of LDPE and PP-PS com-
ponents is not as high as in the case of a polymer matrix and an inorganic filler.
Nevertheless, we think that this approach can be attempted making the follow-
ing assumptions:
• the matrix is a mixture of LDPE and HDPE in the constant weightratio 9/1
for all blends, and its modulus is that experimentally measured for theMix
1(
≈
151 MPa)
• the filler consists PP and PS ina constant ratio 4/1 and its modulus is taken
as the weighted average (
≈
739 MPa) of the moduli of two components.
E. Gattiglia et al. 51
Table 4
Tensile characteristics of injection molded specimens
Sample E (MPa)
σ
y
(MPa)
σ
b
(MPa)
ε
b
(%)
LDPE CF 119 - 12 613
LDPE EF 143 - 13.8 548
HDPE 640 - 30.4 960
PP 704 - 25.2 720
PS 850 - 15.1 60
Mix 1 151 10.6 13.4 353
Mix 2 196 11.5 13.5 377
Mix 3 264 16.1 14.4 440
Mix 4 330 17.9 13.9 147
Mix 5 190 - 12.0 80
Mix 6 1026 - 22.2 -
For a polymer-filler system, the Nielsen model
23,24
is described by the following
equation:
E=E(1+AB )/(1B )
b
m
ff
φ−φψ
[1]
where:
A=K f 1
E
−
[1a]
B= (E E 1) /(E E + A)
f
m
f
m
//−
[1b]
ψ =1+(1 )/( )
max max
2
f
−⋅φΦΦ
[1c]
52 Recycling of Plastics from Urban Solid Wastes
Figure 10. Comparison between experimental and calculated tensile moduli of the mixtures.
and: E
b
,E
m
,E
f
are the blend, matrix, and filler modulus, respectively; K
E
is the
Einstein’s constant, depending on the geometry andsize of the filler particles, as
observed from the SEM morphology; f is the correction factor related to the Pois-
son’s ratio,
ν
, of the matrix;
φ
f
is the volume fractionof the filler;
Φ
max
is the maxi-
mum packing fraction of the filler.
The SEM pictures offer evidence that the geometry of the dispersed phase is
complex, due to the presence of ellipsoid and sphere shaped domains. We have
applied the Eq[1] taking into accountspheres and ellipsoids withaspect ratio
r
=
4. According to Nielsen,
24
K
E
= 2.5 and
φ
max
= 0.60 for random loose packed
spheres and K
E
= 3.08,
φ
= 0.6 for random packed rods or ellipsoids were used.
Moreover, f = 0.9 was assumed on the base of the matrix
ν
= 0.4. Figure 10 shows
the experimental data of E
b
and the calculated values as a function of thevolume
fraction,
φ
f
, of the filler (PP + PS). The trends are similar and suggest that PP
and PS have a reinforcing effect on the PE matrix and the stress transfer at low
strain is good. However, the experimental values are higher than the calculated
values, and a difference between them increases with increasing
φ
f
. This must be
attributed to the geometrical shape of the dispersed PP domains, which tend to
become more and more elongated.
Flexural modulus
The flexural modulus and the impact strength are very important properties
in the field of applications of recovered plastics. Table 5 presents data on the me-
chanical properties for single components and blends. The increase of flexural
modulus by addition of more rigid polymers is evident, confirming that the
stress transfer between the phases is good also in the flexural mode.The flexural
modulus of Mix 5 is practically equal to that of Mix 2 if one considers the experi-
mental uncertainty.
Impact resistance
The impact strength, reported in Table 5, shows a very strong dependence on
phase heterogeneity and on the presence of rigid inclusions in LDPE. Although
the impact propertiesof the blends aregenerally decreased, when LDPE content
decreases, the effect is dramatic at low temperature which requires special at-
tention if such applicationis required. Neverthelessthe absolutevalues arestill
acceptable for most applications. Data of mixtures containing less than 50%
LDPE (Mix 3 and Mix 4) indicate very poor impact properties suggesting that
E. Gattiglia et al. 53
50% LDPE is the lower limit for acceptable properties balance. Once again, the
detrimental influence of the impurities is the cause of a low impact resistance at
30
o
C (220 J/m) of Mix 5 compared to Mix 2, which does not break. This suggests
that more precise separation and washing stages are needed before processing
the blend.
HDPE/heavy fraction blend
The HDPE/heavy fraction blend, 75/25 was examined to evaluate a possibility
of reusing of a heavy fraction as a filler of HDPE to obtain extrudates with ap-
propriate rigidity. As indicated before, the heavy fraction was first ground to
54 Recycling of Plastics from Urban Solid Wastes
Table 5
Flexural modulus and impact strength of injection molded specimens
Sample Flexural modulus IZOD (J/m)
(MPa) -23
o
C0
o
C30
o
C
LDPE CF 182 n.b. n.b. n.b.
LDPE EF 216 n.b. n.b. n.b.
HDPE 1035 196* 212* 268*
PP 1143 4 24 33
PS 1709 44 53 72
Mix 1 223 58 n.b. n.b.
Mix 2 273 31 78* n.b.
Mix 3 511 19 29* 136*
Mix 4 607 20 24 200
Mix 5 256 - - 220
Mix 6 3381 - - 56
n.b. = no break
*partially broken
particles of about 100
µ
m and then blended with HDPEpellets in a double-screw
extruder at 180
o
C. At this temperature, all the components (PVC, PET, nylons,
crosslinked polymers, etc.) are still solid inthe molten HDPE. Morphological ob-
servation by SEM shows that the particles distribution is not homogenous. This
is probably the main reason for poor performance of a blend at high deforma-
tions. In fact, both the tensile and the flexural moduli of HDPE improve signifi-
cantly, as shown in Tables 4 and 5, while the strength at break and the impact
resistance of the blend are much lower compared to pure HDPE. Perhaps, a
change of some parameters of the blending process and optimization of a filler
content or reduction of a percentage of the heavy fraction offer a possibility to
prepare HDPE-based materials, having technological properties suitable for
extrudates, like pipes used for general purposes.
CONCLUSIONS
Although LDPE, HDPE, PP, and PS are incompatible polymers and their
blends show phase separation, the mixtures containing more than 60% LDPE
maintain good mechanical properties.
In general, the introduction of HDPE, PP, PS in LDPE causes an increase in
stiffness, flexural modulus and strength at break and an obvious reduction in
the ultimate elongation and impact resistance. The latter seems to be the most
critical characteristic to be evaluated for applications. The reason for this be-
havior is explained by a very good adhesion between the LDPE matrix and the
dispersed phases, obtained during a melt solidification process of the matrix.
The presence of a LDPE matrixas a binding agent is indispensable for a transfer
of the mechanical stress. As a consequence, with LDPE content decreasing be-
low 50 %, the mechanical properties of the material become affected.
The materials can be grossly schematized as composites in which PE is the ma-
trix while PP and PS are the fillers, with a good adhesion at the phases inter-
face.Within this phase frame, the tensile modulus fits reasonably well to the
theoretical prediction.
Compared to blendsmade from virgin materials,the real waste recovered plas-
tics present obvious problems due to the presence of impurities but the overall
properties are still acceptable.
E. Gattiglia et al. 55
The properties can be modulated by varying the LDPE content in the mixture
which allows one to reprocess and reuse the light fraction from plastic wastes
from various sources whose original composition is outside the proposed opti-
mized range.
The possible alternative approach for a reuse of the heavy fraction, as filler of
the HDPE, can be considered. Approach is promising but needs further work to
optimize the processing steps, with special attention to the optimization of a
filler size and blending conditions.
ACKNOWLEDGMENTS
Special thanks to Dr. S. Astengo for a part of the experimental work and to
Mr. G. Dondero for precious assistance withthe Scanning Electron Microscope.
REFERENCES
1. R. E. Robertson and D. R. Paul, J. Appl. Polym. Sci., 17, 2579 (1973).
2. D. R. Paul, C. E. Vonson, and E. C. Locke, Polym. Eng. Sci., 12, 157 (1972).
3. O. Laguna, O. Castellanos, and E. P. Collar, Resources, Conservation and Recycling, 2,
37 (1988).
4. O. Laguna, E. P. Collar, and J. Taranco, J. Polymer Eng., 7, 169 (1987).
5. O. Laguna, E. P. Collar, and J. Taranco, J. Appl. Polym. Sci., 38, 667 (1989).
6. A. P. Plochocki, Polymer Blends, vol. 2, Eds., D. R. Paul and S. Newmann, Academic
Press, New York, (1978).
7. A. K. Gupta and S. N. Purwar, J. Polym. Sci., 30, 1799 (1985).
8. T. Kyn and P. Vadhar, J. Appl. Polym. Sci., 32, 5575 (1986).
9. K. Min, J. L. White, and J. F. Fellers, J. Appl. Polym. Sci., 29, 2117 (1984).
10. D. W. Clegg, A. A. Collyer, and K. Morton, Polymer Comm., 24, 10 (1983).
11. R. Wycisk, W. M. Trochimczuk, and J. Matlys, Eur. Polym. J., 26, 5 (1990).
12. L. Bohn, Rubber Chem. Technol., 41, 495 (1968).
13. S. Astengo, Thesis, University of Genoa, (1989).
14. A. Serra, Thesis, University of Genoa, (1991).
15. C. Perrone, Poliplasti (Milan), 5, 72 (1987).
16. Y. Shimomura, J. E. Spruiell, and J. L. White, Polym. Eng. Rev., 2, 417 (1983).
17. C. D. Han and J. E. Kim, Trans. Soc. Rheology, 19, 254 (1975).
18. L. A. Utracki and M. R. Kamal, Polym. Eng. Sci., 22 (2), 96 (1982).
19. C. D. Han and Y. W. Kim, J. Appl. Polym. Sci., 19, 2831 (1975).
20. B. L. Lee and J. L. White, Trans. Soc. Rheology, 19, 481 (1975).
21. N. Alle and J. Lyngaae - Jørgensen, Rheolog. Acta, 19, 94 (1980).
56 Recycling of Plastics from Urban Solid Wastes
Cambridge, Mass. (1977).
23. T. B. Lewis and L. E. Nielsen, J. Appl. Polym. Sci., 14, 1449 (1970).
24. L. E. Nielsen, Mechanical Properties of Polymers and Composites, Vol. 2,
Marcel Dekker, New York, (1974).
E. Gattiglia et al. 57
22. M. Kasajima, A. Suganuma, D. Kunii, and K. Ito, Proceed. Intl. Conf. Polym. Process.,
Management of Plastic Wastes: Technical
and Economic Approach
O. Laguna Castellanos, E. Pérez Collar,
and J. Taranco González
Instituto de Ciencia y Tecnología de Polímeros, U.E.I.,
Tecnología de Plásticos. Grupo de Ingeniería de Polímeros,
c/Juan de la Cierva, 3, 28006 Madrid, Spain
INTRODUCTION
It seems thata general agreement has beenreached on the real recyclingpossi-
bilities of plastic wastes, considering the place and the manner in which wastes
are generated and restriction to thermoplastic polymers. The basic principles of
recycling are included in studies conducted during the 1980s which considered
the technical validity of recycling of various plastic wastes. Most of these studies
have been carried out by corporate research and they are covered by patents or
sold in the form of utilities.
1-12
Plastic wastes or scraps are generated from two main sources: industrial
wastes and post-consumer wastes.The problemof theindustrial wasteswas ad-
dressed from the beginning by the companies which generated them in order to
improve the economics of the process. Present public interest in the environ-
mental impact has affected further strategies of big companies. Their knowl-
edge on the recyclability of their industrial wastes was applied to solve the early
steps of the recyclability of the products manufactured by these companies.
13-15
It is important to mention that economic aspects play a secondary role underthe
expectations of regulations and laws which control recycling of plastic wastes.
The second and the biggest source of plastic wastes generation, which creates
the real problem, is termed “post-consumer wastes”. Three kinds of wastes are
generated: municipal, agricultural, and uncontrolled plastic wastes. The last
group of plastic wastes must not be considered in the sense of a technical prob-
O. Laguna Castellanos et al. 59
lem because they can only be avoided due to common consent of users of public
facilities. The agricultural plastic wastes can be collected and well classified in
the place of their generation. After their proper characterization, their
recyclability can be determined. Municipal plastic wastes are the most visible. A
social cost is inherent in the disposal of all kinds of wastes and so it is generally
recognized to the extent that wastes can be reduced and treated for reuse or re-
cycling in specific ways considered attractive by consumers.
On the other hand, many advantages are derived from the application of poly-
mers in the packaging industry, even considering waste disposal:
• In economic terms, the costs of the packaging industries would be in-
creased by approximatelyfour hundred percent by theweight if non-plastic
materials were used.
• An increase by two hundred and fifty percent by volume of wastes would
become real if plastic packaging materials were not used.
• Approximately two hundred percent increase in energy consumption and
costs of materials is feasible for packaging without plastics. As a conse-
quence, plastics offer many advantages in packaging materials.
• The total amount of plastics present in municipal solid wastes is estimated
to be currently about 7% of total waste.
The present paper shows the scheme followed in the development of a strategy
of study anddetermination of recycling feasibilityof the plastic wastefraction.
Recycling of urban plastic wastes
The initial step, i.e., source identification, was previously discussed.
1
Once the
source is identified, the first question regards the composition of the source:
• if plastics are mixed with other materials (glass, paper, organic), a separa-
tion is needed
• if plastics are dirty(clays or similar contaminants), wastes must becleaned
• if the plastic waste consists of a polymer blend, the situation is much more
complex.
The problem was studied by comparison between the polymer blend of the
plastic waste fraction and polymer blend, having similar composition, but ob-
tained from virgin polymers. The technology was applied to the film plastic
waste fraction present in urban solid wastes from Madrid (Spain) and was de-
veloped during the 1983-1986 period.
60 Management of Plastic Wastes