Modeling phosphorus in the environment - Chapter 1 pptx
Bạn đang xem bản rút gọn của tài liệu. Xem và tải ngay bản đầy đủ của tài liệu tại đây (252.61 KB, 18 trang )
Section I
Basic Approaches
© 2007 by Taylor & Francis Group, LLC
3
1
Modeling Phosphorus
Movement from
Agriculture to Surface
Waters
Andrew N. Sharpley
U.S. Department of Agriculture-Agricultural Research
Service, University Park, PA
CONTENTS
1.1 Introduction 3
1.2 Types of Models 4
1.2.1 Process–Based Models 5
1.2.2 Export Coefficient Models 5
1.2.3 Statistical or Empirical Models 6
1.3 How Models Simulate P Transport 6
1.3.1 Dissolved P 6
1.3.2 Particulate P 8
1.4 Fertilizer and Manure Management 10
1.5 Spatial Data Requirements for Modeling 11
1.6 Defining Future Best Management Practices 12
1.7 How Models Simulate Fluvial Processes and Impact
of P in Surface Waters 12
1.7.1 Fluvial Processes 12
1.7.2 Surface Water Impacts 14
1.8 Summary 14
References 15
1.1 INTRODUCTION
Phosphorus (P), an essential nutrient for crop and animal production, can accelerate
freshwater eutrophication, which is the most ubiquitous water quality impairment
in the U.S., with agriculture a major contributor of P (Sharpley 2000; U.S. Geological
Survey 1999). Environmental concerns from harmful algal bloom outbreaks
© 2007 by Taylor & Francis Group, LLC
4 Modeling Phosphorus in the Environment
(Burkholder and Glasgow 1997) and regulatory pressure to reduce P loadings to
surface waters via implementation of Total Maximum Daily Loads (TMDLs) (U.S.
Environmental Protection Agency 2000) have increased the urgency for information
on the impacts of agricultural management, specifically conservation practices and
best management practices (BMPs) on P loss. Because of the time and expense
involved in assessing P loss, models are often a more efficient and feasible means
of evaluating management alternatives. In their most comprehensive form, models
can integrate information over a watershed scale to identify BMPs and critical source
areas where BMPs are most likely to affect watershed-scale P losses.
A common limitation to model application is the lack of detailed parameteriza-
tion data on soil physical, chemical, and biological properties as well as on crop
and tillage details. Thus, existing databases are increasingly being linked to nonpoint
source models, often via geographical information systems (GIS). Generally, key
input data for nutrient transport models involve land use, soil texture, topography,
and management practices. Once these data are in digital form, GIS techniques can
be used to combine them with experimental or model results to extrapolate other
properties needed for model application.
This introduction chapter previews the general principles of how models repre-
sent soil P release and transport, effects of mineral fertilizer and manure management
on P loss, spatial resolution, and channel processes that translate edge-of-field losses
to water body inputs. Future modeling efforts needed to address these issues are
presented.
1.2 TYPES OF MODELS
Models that simulate the runoff and water quality from watersheds can be categorized
in several ways, but for purposes of this brief review they are segregated into three
groups:
1.Process-based models: Models that explicitly simulate watershed pro-
cesses, albeit usually conceptually. These models typically involve the
numerical solution of a set of governing differential and algebraic equa-
tions that are a mathematical representation of processes such as rainfall
runoff; infiltration leaching; P application method, rate, and timing; land
management; and fate and chemical transformation of added P in soil.
2. Export coefficient models: Models that rely on land-use categorization —
sometimes through a linkage to a GIS evaluation — coupled with export
coefficients or event mean concentrations (EMCs), loosely categorized as
spreadsheet approaches, although highly sophisticated in many cases.
These models rarely, if ever, involve solution of a differential equation
and almost always rely on simple, empirical formulations, such as the use
of a runoff coefficient for generation of runoff from rainfall.
3. Statistical or empirical models: Models that involve regression or other
techniques, which relate water-quality measures to various characteristics
of the watershed. These models range from purely heuristic regression
equations (e.g., Driver and Tasker 1990) to relatively sophisticated
© 2007 by Taylor & Francis Group, LLC
Modeling Phosphorus Movement from Agriculture to Surface Waters 5
derived-distribution approaches for prediction of the frequency distribu-
tion of loadings and concentrations (e.g., DiToro and Small 1984; Driscoll
et al. 1989).
All of the model types have their drawbacks related to availability of required data,
scaling up from pedon input parameters, for example, to a watershed scale, and
quantifying system functionality. For more detailed information on the approaches
used in models described in the sections following and in other models, reviews are
given as separate chapters in this publication.
1.2.1 P
ROCESS
–B
ASED
M
ODELS
The Agricultural Nonpoint Source (AGNPS) Pollution model (Young et al. 1989,
1995) was originally developed to provide estimates of runoff water quality from
watersheds of up to 20,000 hectares and to quantify the effects of BMPs targeted
to specific areas. To make model output more meaningful to decision makers, such
as conservationists and farmers, AGNPS, which ran on a storm or flow event basis,
was recently superseded by an annualized version, Annualized AGNPS (AnnAG-
NPS) (Bingner et al. 2001; Croshley and Theurer 1998). The model operates on a
cell basis that makes it possible to analyze spatially discrete management units
(fields) within a watershed, thereby enabling identification of individual fields that
may serve as critical source areas of nutrient export. AnnAGNPS is described in
Chapter 9 of this book.
The Soil and Water Assessment Tool (SWAT) was developed to assess the impact
of land management on water quality in watersheds and large river basins (Arnold
et al. 1998). The model runs on a continuous time step and is currently being utilized
in a variety of large-scale studies to estimate the off-site impacts of climate and
management on water use and nonpoint source loadings. SWAT is described in
Chapter 7 of this book.
Other process-based nutrient transport models include, but are not limited to
Areal Nonpoint Source Watershed Environment Response Simulation 2000
(ANSWERS-2000) (Beasley et al. 1985; Bouraoui and Dillaha 1996), the Guelph
Model for Evaluating the Effects of Agricultural Management Systems on Erosion
and Sedimentation (GAMES) (Cook et al 1985), Hydrologic Simulation Program-
Fortran (HSPF) (Johanson et al. 1984), Agricultural Runoff Model (ARM) (Donigian
et al. 1977), Erosion Productivity Impact Calculator (EPIC) (Sharpley and Will-
iams 1990), Groundwater Loading Effects of Agricultural Management Systems
(GLEAMS) (Leonard et al. 1987), Watershed Ecosystem Nutrient Dynamics-
Phosphorus (WEND-P) (Cassell et al. 1998), and CENTURY (Parton et al. 1993).
HSPF, ANSWERS-2000, and WEND-P are described in Chapters 8, 10, and 11,
respectively.
1.2.2 E
XPORT
C
OEFFICIENT
M
ODELS
Export coefficient models have also been widely used to predict P loading of
receiving water bodies (Beaulac and Reckhow 1982; Hanrahan et al. 2001;
© 2007 by Taylor & Francis Group, LLC
6 Modeling Phosphorus in the Environment
Johnes et al. 1996). Export coefficients define P loss from a particular source or land
use in a watershed and are usually derived from actual field measured losses of P
or from EMC values, if runoff volumes are known (Johnes 1996; Johnes and Heathwaite
1997). Both export coefficients and EMCs fit easily into spreadsheet formats for
watershed loading estimates. An advantage of EMCs is that they may be coupled
with any hydrologic simulation model to produce loads.
Export coefficient models calculate watershed export of P as the sum of indi-
vidual loads from each source in the watershed. This approach accounts for the
complexity of land-use systems, spatial distribution of data from various sources
(point and nonpoint), and permits scaling up from plot to watersheds. As export
coefficients are empirical, these types of models are as accurate as input data, as are
process-based models (Hanrahan et al. 2001). Coefficients derived from short-term
monitoring of small drainage areas, however, can contribute to predictive variability
(Lathrop et al. 1998). The Generalized Watersheds Loading Functions (GWLF)
model (Haith and Shoemaker, 1987) is an example of an export coefficient model
and is described in Chapter 12.
1.2.3 S
TATISTICAL
OR
E
MPIRICAL
M
ODELS
Statistical models are empirical. Although they are derived from observations, the
relationship described must have a basis in our underlying understanding of pro-
cesses if we are to have faith in the predictive capabilities of the model (National
Research Council 2000). Furthermore, extrapolation from empirical data is known
to be fraught with danger. For example, scaling problems can occur when one
extrapolates the results of scaled experiments to full-sized natural systems. One
must, of course, always remain cognizant of the fact that system function may be
scale dependent. Thus, these models are most judiciously used in the range of
observational situations used to derive the model.
Statistical or empirical models are most useful when they are based on first
principles. The ability to describe system functions in terms of mathematical equa-
tions often gives the impression that the underlying principles are fully understood,
as might be the situation in basic physics. Unfortunately, empirical coefficients
introduced into these equations often hide the degree of uncertainty concerning these
principles. This publication does not include reviews of any statistical models per
se, but many P indices include statistical relationships and might be considered a
type of statistical model. P indices are described in Chapter 13.
1.3 HOW MODELS SIMULATE P TRANSPORT
1.3.1 D
ISSOLVED
P
Most nonpoint source models simulate dissolved P transport in overland flow as a
function of the extractability of P in the surface 5 cm of soil [e.g., Chemicals, Runoff
and Erosion from Agricultural Management Systems (CREAMS), AGNPS]. This
can be represented by
Dissolved P = Extraction Coefficient × Available soil P × Overland flow volume
(1.1)
© 2007 by Taylor & Francis Group, LLC
Modeling Phosphorus Movement from Agriculture to Surface Waters 7
where dissolved P is orthophosphate loss in overland flow (kg ha
−1
), available soil
P is the amount of P in a unit depth of surface soil — usually 5 cm — (Sharpley 1985b)
as estimated by recommended soil test P methods (STP) (kg ha
−1
5 cm
−1
), and
extraction coefficient is the fraction of STP that can be released to overland flow
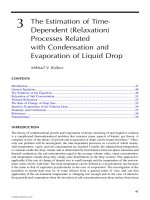
for a given flow event volume (cm). Extraction coefficients can be determined as
the slope of the linear regression of STP and overland flow dissolved P
(Figure 1.1a). A similar relationship holds for subsurface flow P and surface STP,
although the slope of the relationship (0.93) is almost half that for overland flow
(slope of 1.98) (Figure 1.1b). The dependence of dissolved P transport in subsurface
flow as well as overland flow suggests the importance of preferential flow pathways,
such as earthworm burrows and old root channels, in the downward movement of
P through the soil profile (Kleinman et al. 2003; McDowell and Sharpley 2001a;
Sims et al. 1998).
FIGURE 1.1 Relationship between the concentration of dissolved P in overland (a) and
subsurface flow (b) from 30-cm-deep lysimeters and the Mehlich-3 extractable soil P con-
centration of surface soil (0 to 5 cm) from a central Pennsylvania watershed. (Adapted from
R.W. McDowell and A.N. Sharpley, J. Environ. Qual. 30, 508–520, 2001; and A.N. Sharpley,
P.J.A. Kleinman, R.J. Wright, T.C. Daniel, B. Joern, R. Parry, and T. Sobecki, in International
Conference on Agricultural Effects in Ground and Surface Waters, J. Steenvooreden (Ed.),
Wageningen, The Netherlands, International Association of Hydrologic Sciences.)
Mehlich-3 extractable soil P (mg kg
-1
)
0 200 400 600 800
Dissolved P (µg L
-1
)
2000
1500
1000
500
0
1000
750
500
250
0
y
=
1.98x + 79
R2 = 0.78
y
=
0.93x + 60
R2 = 0.79
b. Subsurface flow
from lysimeters
a. Overland flow
© 2007 by Taylor & Francis Group, LLC
8 Modeling Phosphorus in the Environment
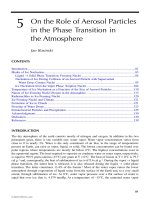
Most models use a constant extraction coefficient value, assuming that STP
extractability is similar among soils. A re-analysis of data published by McDowell
and Sharpley (2001a), Pote et al. (1999), and Sharpley and Smith (1994) relating
STP and overland flow dissolved P revealed a range of extraction coefficient values
(Figure 1.2). Extraction coefficients were much greater for cropped (8 to 17) than
grassed watersheds (1 to 4). Using erosion as a surrogate for land cover, extraction
coefficients increased with greater erosion or decreased soil cover (Figure 1.2).
Although erosion is influenced by other factors such as slope and soil structure, the
sites used in this example were similar in slope (~4%). A larger soil P extraction
coefficient represents a greater release of P as overland flow dissolved P per unit
STP increases. This can be attributed to a lower degree of interaction between surface
soil and overland flow with a protective grass cover than for a cropped situation,
where the soil is more exposed to overland flow. Other factors that influence P release
among soils are the dominant forms of P in soil, texture, aggregate diffusion, degree
of interaction between soil and water, organic matter content, vegetative soil cover,
and P sorption capacities.
1.3.2 P
ARTICULATE
P
As the sources of particulate P in overland flow and stream flow include eroding
surface soil, stream banks, and channel beds, processes determining erosion also
FIGURE 1.2 Extraction coefficient — the slope of the relationship between soil test P and
dissolved P in overland flow — as a function of erosion to represent soil vegetative cover for
sites in Arkansas, Oklahoma, New York, and Pennsylvania. (Data adapted from D.H. Pote,
T.C. Daniel, D.J. Nichols, A.N. Sharpley, P.A. Moore, Jr., D.M. Miller, and D.R. Edwards,
J. Environ. Qual. 28, 170–175, 1999; McDowell and A.N. Sharpley, J. Environ. Qual. 30,
508–520, 2001; and A.N. Sharpley and S.J. Smith, Soil Tillage Res. 30, 33–38, 1994.)
Decreasing soil cover
Erosion (tonnes ha
-1
yr
-1
)
1010.10.010.001
Native grass / pasture
No till
Reduced till
Conventional till
20
15
10
5
0
y
=
1.25x
0.30
R
2
= 0.90
Extraction coefficient
© 2007 by Taylor & Francis Group, LLC
Modeling Phosphorus Movement from Agriculture to Surface Waters 9
control particulate P transport. In general, eroded particulate material is enriched
with P compared to source surface soil, due to the preferential transport of finer
(i.e., clay size), more sorptive soil and organic particles of greater P content than
coarser inorganic particles (i.e., sand size). Sharpley (1985a) found that the plant
available P content of sediment in overland flow was on average three times
greater — or more enriched — than that of source soil and 1.5 times greater for
total, inorganic, and organic P. The degree of P enrichment is expressed as a P
enrichment ratio (PER), that is, the P concentration of sediment discharged
divided by that of source soil. In assembling enrichment ratio information for
the CREAMS model, Menzel (1980) concluded that for particulate P, a logarith-
mic relationship as in Equation 1.2 seemed to hold for a wide range of soil
vegetative conditions.
Ln (PER) = 2.00 – 0.16 Ln (Sediment discharge) (1.2)
where sediment discharge is in kg ha
−1
. Most nonpoint source models adopted this
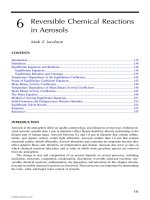
approach to predicting particulate P transport in overland flow. This relationship is
based on the well-documented increase in particulate P loss with increasing erosion
(Figure 1.3). Based on the total P concentrations of source soils for each of the
watersheds represented in Figure 1.3, PER decreases with an increase in erosion. As
erosion increases, there is less particle-size sorting by overland flow, relatively less
clay-size particles are transported, and P enrichment thus decreases.
FIGURE 1.3 Particulate P loss and enrichment ratio of eroded sediment as a function of
erosion in overland flow from watersheds in El Reno, Oklahoma. (Adapted from A.N. Sharpley,
S.J. Smith, J.R. Williams, O.R. Jones, and G.A. Coleman, J. Environ. Qual. 20, 239–244,
1991; and S.J. Smith, A.N. Sharpley, J.W. Naney, W.A. Berg, and O.R. Jones, J. Environ.
Qual. 20, 244–249, 1991.)
Erosion (tonnes ha
-1
)
10 10010.10.010.001
Particulate P (kg ha
-1
)
7.5
5.0
2.5
0
10
8
6
4
2
1
Particulate P
P enrichment ratio
P enrichment ratio
© 2007 by Taylor & Francis Group, LLC
10 Modeling Phosphorus in the Environment
Once an appropriate PER is obtained from sediment discharge, particulate P
loss can be calculated as
Particulate P = Total soil P × Sediment concentration
× PER × Overland flow volume (1.3)
where particulate P is the loss in overland flow (kg ha
−1
), total soil P is the amount
in a unit depth of surface soil (usually kg ha
−1
5 cm
−1
), sediment concentration is g
sediment L
−1
overland flow, and PER is calculated from Equation 1.2, for a given
flow event volume (cm).
1.4 FERTILIZER AND MANURE MANAGEMENT
Fertilizer and manure management, as it affects P availability to overland flow
over the near term, can profoundly affect prediction of P transport in overland
flow. Although soil P represents a source of P enrichment in overland flow, the
application of fertilizer and manure to soil — including type, method, timing,
and rate of P application — can temporarily overwhelm relationships derived
between STP and P in overland flow (Sharpley and Tunney 2000). As such,
accounting for fertilizer and manure management in P models is essential to
their accuracy under certain conditions. However, most models do not directly
address the effect of applied P, either as fertilizer or manure, on P transport in
overland flow. Rather, added P is incorporated into the soil P pool, and the
extraction coefficient is adjusted. Thus, P transport in overland flow as affected
by the amount, type, method, and time after applying P is, in general, poorly
represented and predicted.
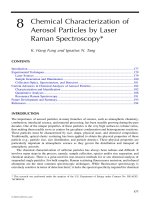
Mineral fertilizer and manure represent concentrated sources of soluble P that
can greatly increase dissolved P losses in overland flow. Consequently, the concen-
tration of soluble P in these sources may provide effective predictions depending
on the solubility of the P source, method of application, rate of application, and
timing of application relative to the overland flow event (Figure 1.4) (Kleinman et al.
2002). Surface application of manure and mineral fertilizer concentrates P at the
extreme soil surface where it is vulnerable to removal by overland flow (Eghball
and Gilley 1999; McDowell and Sharpley 2001b; Sharpley et al. 1984). Although
injection, knifing, and immediate incorporation of manure and fertilizer may
decrease P losses, cultivation may increase site vulnerability to particulate P loss
due to greater erosion potential (Andraski et al. 1985; Romkens et al. 1973).
Modifying the effect of P source and application method on P concentrations
in overland flow is the timing of application relative to when an overland flow event
occurs (Sharpley 1997; Westerman and Overcash 1980). Immediately following
application of a P source, the potential for P loss peaks and then declines over time,
as applied P increasingly interacts with the soil and is converted from soluble to
increasingly recalcitrant forms (Edwards and Daniel 1993). As a result, fertilizer
and manure management effects on overland flow P are predictable.
© 2007 by Taylor & Francis Group, LLC
Modeling Phosphorus Movement from Agriculture to Surface Waters 11
1.5 SPATIAL DATA REQUIREMENTS FOR MODELING
Models that assess nonpoint sources of P loss from agricultural lands rely on spatial
data as input. Land use, soil properties, and topographic data that include stream
locations and watershed boundaries are commonly required inputs. However, with an
expansion in the geographical scale at which watershed processes are to be modeled,
there is a great increase in the size of associated spatial databases. Data and parameter
requirements also increase rapidly as models become more mechanistic to better
represent physical and chemical processes and spatial interactions involved in P loss.
The complexity of managing these large databases in support of a watershed
model can limit the degree of spatial resolution of existing models. Spatial parameters
are frequently lumped so that units having similar soil, land use, and topographic
characteristics respond the same to driving variables, such as those used to simulate
runoff generation. However, spatially lumped parameters can pose a problem when
responses from lumped units cannot distinguish between relative spatial locations of
individual units, which can be critical in determining P export from a watershed to
a water body.
To overcome the spatial data limitations thus far identified, a nested modeling
approach is recommended. Field and farm scale models that incorporate the knowledge
of P source and transport processes involved in P loss can be supported with highly
detailed spatial databases that are already available in some areas or could be easily
developed in others. Results and generalizations from these models could be aggre-
gated to represent sub-basins in a simpler, less mechanistic model that requires lower
spatial resolution. Similarly, results from sub-basin models could be further aggregated
to represent whole watersheds of several hundreds of square kilometers in size. Beyond
that scale and with enough knowledge of processes operating in individual subwatersheds,
FIGURE 1.4 Relationship between water extractable manure P and the dissolved P in over-
land flow one week after manure or mineral fertilizer was broadcast (100 kg total P ha
−1
) on
a Hagerstown silt loam soil (7 cm hr
−1
rainfall for 30 min). (Adapted from P.J.A. Kleinman,
A.N. Sharpley, B.G. Moyer, and G.F. Elwinger, J. Environ. Qual. 31, 2026–2033, 2002.)
86420
Water extractable manure P (g kg
-1
)
Dissolved P in overland flow (µg L
-1
)
6000
4000
2000
0
Dairy
manure
Dairy compost
Poultry litter
Poultry compost
Swine slurry
Poultry manure
© 2007 by Taylor & Francis Group, LLC
12 Modeling Phosphorus in the Environment
the principles of mapping could be invoked to derive generalizations about large
watersheds that span multiple physiographic regions, such as the Chesapeake Bay
Watershed and Mississippi River Basin. Map units of the Major Land Resource Areas
(MLRAs) of the U.S. are defined on the basis of topography, soils, and land use and,
therefore, are ideally suited for extrapolating detailed studies of whole watersheds to
the broader area of the MLRA map unit.
1.6 DEFINING FUTURE BEST MANAGEMENT PRACTICES
The implementation of P control measures has often been carried out with insuf-
ficient knowledge as to the suitability of these practices for P control. A large
number of BMPs exist; their suitability likely varies depending on the particular
situation. Given that BMP impacts are largely site specific (Baker and Johnson
1983; Deere and Company 1995; U.S. Environmental Protection Agency 1993),
defining future BMPs for P control depends a great deal on being able to establish
the effectiveness of these BMPs under the variety of field conditions that are
constantly encountered.
Several factors complicate BMP assessment in a field situation: site variability,
lack of controlled replication, and length of study time needed. In turning to models,
we try to overcome some of these complications. Though models greatly simplify the
natural system, they also provide a means of carrying out complex BMP evaluations.
Nonetheless, the large amounts of data that have accumulated over the years can
be extremely useful in working on a modeling approach to BMP evaluation (see
Chapter 15 on BMPs in this book; Gitau et al. 2001). An initial step in modeling
BMP-induced reduction in P loss is the characterization of the BMPs of concern
with regard to their mechanisms of operation, such as source (i.e., soil P; type, rate,
and form of P applied) and transport (i.e., runoff, erosion) factors controlling P loss.
This characterization would enable identification of source and transport mecha-
nisms impacted by particular BMPs and, thus, the determination of model changes
that would be necessary to fully represent the BMPs (Gitau et al. 2001).
1.7 HOW MODELS SIMULATE FLUVIAL PROCESSES
AND IMPACT OF P IN SURFACE WATERS
In-channel processes modify the potential for agriculture to impact a downstream
freshwater body. As surface water impacts drive activities such as TMDL develop-
ment, understanding the role of in-channel or fluvial processes on P transport and
the impact of transported P on downstream water bodies is necessary to link upstream
changes in agricultural management with downstream water quality impacts.
1.7.1 F
LUVIAL
P
ROCESSES
If simulating the influence of landscape processes on P transport seems complex,
simulating fluvial processes that influence the form and amount of edge-of-field P
© 2007 by Taylor & Francis Group, LLC
Modeling Phosphorus Movement from Agriculture to Surface Waters 13
entering downstream water bodies is even more challenging. Basically, fluvial trans-
port involves a complex and dynamic interaction of hydrologic, physical, chemical,
and biological processes. As stream flow varies from base to storm flow, a greater
cross-sectional area of channel sediments interacts with water, the course of some
streams may even meander, and time of interaction between water and sediment or
biotic material decreases. Fluvial erosion of gullies, ditches, and stream banks
generally contributes subsoil material, which usually has a low P content and high
P sorption capacity, which can function as a sink for P within the fluvial system
(Baldwin et al. 2002; Sharpley et al. 1996). Fluvial P chemistry is dominated by the
uptake and release of P by sediment, the direct and extent of which is a function of
streamwater-dissolved P, sediment P (i.e., equilibrium P concentration), stream water
pH, P released from dead biota, hydrolysis of organic P species, and changes in
sediment crystallinity and oxidation and reduction. Biological uptake of P can
decrease dissolved P, whereas bacteria can mediate a sizeable proportion — 30 to
40% — of sedimentary P uptake and release (Khoshmanesh et al. 1999; McDowell
and Sharpley 2003). Biologically controlled P release during the decomposition of
organic matter in sediments can be an important source of dissolved P at times of
high temperature and low flow in areas with organic-rich sediments, such as streams
draining forested areas. The effects of all these processes on fluvial P transport varies
greatly, reflecting seasonal cycles, management of streamside land, sediment P
forms, size of flow event, and streambed geology.
Much information can be found on the influence of fluvial sediments on stream-
water P. For example, McDowell et al. (2002) examined the processes controlling
sediment P release to the Winooski River, Vermont, the largest tributary to Lake
Champlain. Iron-oxide strip P (algal-available P) of the river sediments adjacent to
agricultural land (3.6 mg kg
−1
) was significantly greater (p < .05) than that of
sediments adjacent to forested land (2.4 mg kg
−1
). Notably, impoundment (731 mg
kg
−1
) and reservoir sediments (803 mg kg
−1
) had greater total P concentrations than
did river sediments (462 mg kg
−1
). This was attributed to more fines (< 63 µm) in
impoundments and reservoirs (64%) than in river sediments (33%). Consequently,
impoundment and reservoir sediments had lower abilities to release P to solution in
the short term, thereby acting as P sinks.
The results of this research clearly demonstrate that fluvial hydraulics has a
strong influence on the properties of sediment within river systems. The input and
delivery of fine sediments enriched with P was influenced by adjacent land use.
The fluvial sediment, particularly at the outflow of the river into Lake Champlain
for example, represents a store of P, which has a long-term potential to release a
large amount of P to overlying waters. In the short term, however, river flow and
physical properties of the sediments will influence the amount of sediment P
leaving the watershed in the Winooski River, Vermont. Thus, modeling of in-
channel or fluvial processes must account for variability in flow, local sources of
P, and sediment properties, particularly near the point of impact. Because of these
complexities, fluvial processes and changes in P forms and loads are not currently
simulated or are simulated in a simple manner in most watershed models (Hanrahan
et al. 2001).
© 2007 by Taylor & Francis Group, LLC
14 Modeling Phosphorus in the Environment
1.7.2 SURFACE WATER IMPACTS
Intuitively, biological responses are different among water bodies, with variations in
geographic location, climate, water residence times, and surface area and depth of water
body. For example, the Cannonsville Reservoir — which is part of the New York City
water supply system — flushes in a matter of months, whereas Cayuga Lake — the
longest Fingerlake in New York State — has a mean water residence time of about
12 years. Also, the Chesapeake Bay has a completely different set of critical biological
indicators in comparison with the Gulf of Mexico (National Research Council 2000).
In fact, the ratio of watershed drainage area and Bay water volume (2410 km
2
km
−3
)
is nearly an order of magnitude greater than any other lake or bay in the world; next
is the Gulf of Finland (380 km
2
km
−3
). As a result, simulation as well as management
of the biological response within the Chesapeake Bay presents unique challenges
because of the relatively large area for nutrient source inputs that must be considered.
Although P loss in overland flow, the related effects of agricultural management,
and how nutrients cycle within a water body can be simulated, it is still difficult to relate
P loss as a function of watershed management to the biological response of a receiving
water body. Because of the scales involved, connectivity, and dominant processes in
terrestrial and aquatic systems, watershed and water-body response models have tended
to develop independently. Summer et al. (1990) attempted to link watershed (i.e.,
AGNPS) and lake process (i.e., FARM POND) models. However, a lack of adequate
water monitoring data, such as chemistry and flow rate, limits rigorous testing of their
ability to simulate a lake’s response to changes in agricultural management and climate.
1.8 SUMMARY
This brief introduction has presented background information on processes controlling
P transport in overland and subsurface flow from agricultural landscapes and how
nonpoint source models attempt to simulate P loss. New information on soil and site
dependency of extraction coefficients relating STP and overland flow dissolved P and
the use of enrichment ratios to estimate particulate P transport should be incorporated
into these models. Also, incorporation of new formulations describing the release and
transport of inorganic and organic P from manure in overland and subsurface flow
will improve model predictions of P loss following land application of manures.
However, much information on the fate and transport of P in agricultural landscapes
and on the effectiveness of various BMPs to minimize this loss through source or
transport controls is already available. Mechanisms are being developed to apply this
information through innovative database management and integration with existing
models to better use existing data rather than to reinvent the wheel.
Many complex models are available and are gaining greater acceptance with
managers and planners, as computers become more powerful and less expensive and
as people become more comfortable using them. However, because models yield clear
numerical results with which to gauge progress, they have a strong appeal to policy-
makers and managers — an appeal that can sometimes bring false confidence and
misconceptions (Boesch et al. 2001). Though all models are wrong, some are useful.
It is of critical importance that modelers clearly define what the model is useful
© 2007 by Taylor & Francis Group, LLC
Modeling Phosphorus Movement from Agriculture to Surface Waters 15
for and what it is not designed to do. Likewise, users must decide what they want to
accomplish with a model. For example, one must consider the scale (i.e., field, water-
shed, or basin), time (i.e., flow event, annual, or multiyear), and level of accuracy (i.e.,
0.1 or 10 kg ha
−1
year
−1
) that needs to be simulated, as well as the amount of param-
eterization data available. Thus, a key to useful simulation of P loss is selection of the
appropriate model and data to run it. If, for instance, one needs to identify areas in a
watershed at greater risk for P loss to target remedial BMPs, then site-vulnerability
tools such as the P index are available (Gburek et al. 2000; Lemunyon and Gilbert
1993). On the other hand, most P indices are not designed to quantify P loss as are
many nonpoint source models described earlier in this discussion.
Even so, it is clear that a great deal of uncertainty can exist in model computa-
tions. Uncertainty arises in connection with an imperfect representation of the
physics, chemistry, and biology of the real world, caused by numerical approxima-
tions, inaccurate parameter estimates and data input, and errors in measurements of
the state variables being computed. Whenever possible, this uncertainty should be
represented in the model output (e.g., as a mean plus standard deviation) or as
confidence limits on the output of a time series of concentrations or flows. The
tendency described earlier for decision makers to believe models because of their
presumed deterministic nature and exact form of output must be tempered by respon-
sible use of the models by engineers and scientists such that model computations
or predictions are not oversold or given more weight than they deserve. Above all,
model users should determine that the model computations are reasonable in the
sense of providing output that is physically realistic and based on input parameters
within accepted ranges. Model uncertainty is addressed in Chapter 6 of this book.
The role of modeling will be more and more important over the next decade in
making management and policy decisions related to conservation programs and
water-quality enhancement and enforcement. Also, the availability of water moni-
toring data is increasing in response to water quality concerns in the U.S. and other
parts of the world and is providing new opportunities to develop, to calibrate, and
to test watershed models. Monitoring data for models is discussed in Chapter 16 of
this book. As we move forward, however, an interdisciplinary approach is needed
that involves hydrologists, soil scientists, engineers, economists, animal scientists,
and, possibly, rural sociologists.
With the knowledge that many and varied working models exist, our efforts should
be directed to improving or adapting existing models rather than reinventing or devel-
oping new models, except where major limitations have been clearly defined. Finally,
and most importantly, it is essential that the most appropriate model be carefully
selected to meet a user’s needs in terms of level of predictive accuracy needed, input
data available, and scale of simulation being considered — both time and space.
REFERENCES
Andraski, B.J., D.H. Mueller, and T.C. Daniel. 1985. Phosphorus losses in runoff as affected
by tillage. Soil Sci. Soc. Am. J. 49:1523–1527.
Arnold, J.G., R. Srinivasa, R.S. Muttiah, and J.R. Williams. 1998. Large area hydrologic mod-
eling and assessment part 1: model development. J. Am. Water Resour. Assoc. 34:73–89.
© 2007 by Taylor & Francis Group, LLC
16 Modeling Phosphorus in the Environment
Baker, J.L. and H.P. Johnson. 1983. Evaluating the effectiveness of BMPs from field studies.
Pp. 281–304 in Agricultural Management and Water Quality, F.W. Schaller and
G.W. Bailey (Eds.). Ames: Iowa State University Press.
Baldwin, D.S., A.M. Mitchell, and J.M. Olley. 2002. Pollutant-sediment interactions:
sorption, reactivity and transport of phosphorus. Pp. 265–280 in Agriculture,
Hydrology and Water Quality, P.M. Haygarth and S.C. Jarvis (Eds.). Oxford: CABI
International.
Beasley, D.B., E.J. Monke, E.R. Miller, and L.F. Huggins. 1985. Using simulation to assess
the impacts of conservation tillage on movement of sediment and phosphorus into
Lake Erie. J. Soil Water Conserv. 40:233–237.
Beaulac, M.N. and K.H. Reckhow. 1982. An examination of land use — nutrient export
relationships. Water Res. Bull. 18:1013–1023.
Bingner, R.L., F.D. Theurer, R.G. Cronshey, and R.W. Darden. 2001. AGNPS 2001 Web Site.
Boesch, D.F., R.B. Brinsfield, and R.E. Magnien. 2001. Chesapeake Bay eutrophication:
scientific understanding, ecosystem restoration, and challenges for agriculture. J. Environ.
Qual. 30:303–320.
Bouraoui, F. and T.A. Dillaha. 1996. ANSWERS-2000: Runoff and sediment transport model.
J. Environ. Eng. 122(6):493–502.
Burkholder, J.A. and H.B. Glasgow, Jr. 1997. Pfiesteria piscicidia and other Pfiesteria-
dinoflagellates behaviors, impacts, and environmental controls. Limnol. Oceanogr.
42:1052–1075.
Cassell, E.A., J.M. Dorioz, R.L. Kort, J.P. Hoffmann, D.W. Meals, D. Kirschtel, and D.C.
Braun., 1998. Modeling phosphorus dynamics in ecosystems: mass balance and
dynamic simulation approaches. J. Environ. Qual. 27:293–298.
Cook, D.J., W.T. Dickinson, and R.P. Rudra. 1985. GAMES — the Guelph model for eval-
uating the effects of agricultural management systems in erosion and sedimentation:
User’s manual. Technical Report 126-71, School of Engineering, University of
Guelph, Ontario.
Croshley, R.G and F.G. Theurer. 1998. AnnAGNPS nonpoint pollutant loading model. Pro-
ceedings of the First Federal Interagency Hydrologic Modeling Conference, April
19–23, Las Vegas, NV.
Deere and Company. 1995. Managing nonpoint source pollution in agriculture. Technical
Report 272. 61265. Moline, IL: Deere and Company Technical Center.
DiToro, D.M. and M.J. Small. 1984. Probability model of stream quality due to runoff.
J. Environ. Eng. 110:607–628.
Donigian, A.S., Jr., D.C. Beyerlein, H.H. Davis, Jr., and N.H. Crawford. 1977. Agricultural
Runoff Management (ARM) Model Version II: Refinement and testing. U.S. Envi-
ronmental Protection Agency, EPA 600/3-77-098, Environmental Research Lab,
Athens, GA.
Driscoll, E.D., P.E. Shelley, and E.W. Strecker. 1989. Pollutant Loadings and Impacts from
Highway Stormwater Runoff: Design Procedure. Mclean, VA: Office of Engineering
and Highway Operations R&D, Federal Highway Administration.
Driver, N.E. and G.D. Tasker. 1990. Techniques for Estimation of Storm-Runoff Loads, Vol-
umes, and Selected Constituent Concentrations in Urban Watersheds in the United
States. Reston, VA: U.S. Geological Survey.
Edwards, D.R. and T.C. Daniel. 1993. Drying interval effects on runoff from fescue plots
receiving swine manure. Trans. Am. Soc. Agric. Eng. 36:1673–1678.
Eghball, B. and J.E. Gilley. 1999. Phosphorus and nitrogen in runoff following beef cattle
manure or compost application. J. Environ. Qual. 28:1201–1210.
© 2007 by Taylor & Francis Group, LLC
Modeling Phosphorus Movement from Agriculture to Surface Waters 17
Gburek, W.J., A.N. Sharpley, A.L. Heathwaite, and G.J. Folmar. 2000. Phosphorus manage-
ment at the watershed scale: a modification of the phosphorus index. J. Environ. Qual.
29:130–144.
Gitau, M.W., E. Schneiderman, W.J. Gburek, and A.R. Jarrett. 2001. An evaluation of best
management practices installed in the Cannonsville Reservoir Watershed, New York.
Proceedings of the 9th National Non-point Source Monitoring Workshop, August
27–30, Indianapolis, IN.
Haith, D.A. and L.L. Shoemaker. 1987. Generalized watershed loading functions for stream
flow nutrients. Water Res. Bull. 23(3):471–478.
Hanrahan, G., M. Gledhill, W.A. House, and P.J. Worsfold. 2001. Phosphorus loading in the
Frome catchment, UK: seasonal refinement on the coefficient modeling approach.
J. Environ. Qual. 30:1738–1746.
Johanson, R.C., J.C. Imhoff, J.L. Little, and A.S. Donigian. 1984. Hydrological Simulation
Program-Fortran (HSPF): user’s manual. U.S. Environmental Protection Agency,
EPA-600/3-84-066, Athens, GA.
Johnes, P.J. 1996. Evaluation and management of the impact of land use changes on the
nitrogen and phosphorus load delivered to surface waters: The export coefficient
modeling approach. J. Hydrol. 183:323–349.
Johnes, P.J. and A.L. Heathwaite. 1997. Modelling the impact of land use change on water
quality in agricultural catchments. Hydrol. Proc. 11:269–286.
Johnes, P.J., B. Moss, and G. Phillips. 1996. The determination of total nitrogen and total
phosphorus concentrations in freshwaters from land use, stock headage and popula-
tion data: testing of a model for use in conservation and water quality management.
Freshwater Biol. 36:451–473.
Khoshmanesh, A., B.T. Hart, A. Duncan, and R. Beckett. 1999. Biotic uptake and release of
phosphorus by a wetland sediment. Environ. Technol. 29:85–91.
Kleinman, P.J.A., B.A. Needelman, A.N. Sharpley, and R.W. McDowell. 2003. Using soil
phosphorus profile data to assess phosphorus leaching potential in manured soils.
Soil Sci. Soc. Am. J. 67:215–224.
Kleinman, P.J.A., A.N. Sharpley, B.G. Moyer, and G.F. Elwinger. 2002. Effect of mineral
and manure phosphorus sources on runoff phosphorus. J. Environ. Qual.
31:2026–2033.
Krogstad, T. and Ø. Løvstad. 1989. Erosion, phosphorus and phytoplankton response in rivers
of southeastern Norway. Hydrobiologia 183:33–41.
Lathrop, R.C., S.R. Carpenter, C.A. Stow, P.A. Soranno, and J.C. Panuska. 1998. Phosphorus
loading reductions needed to control blue-green algal blooms in Lake Mendota. Can.
J. Fish. Aquat. Sci. 55:1169–1178.
Lemunyon, J.L. and R.G. Gilbert. 1993. The concept and need for a phosphorus assessment
tool. J. Prod. Agric. 6:483–496.
Leonard, R.A., W.G. Knisel, and D.A. Still. 1987. GLEAMS: groundwater loading effects of
agricultural management systems. Trans. Am Soc. Agric. Eng. 30:1403–1418.
McDowell, R.W. and A.N. Sharpley. 2001a. Approximating phosphorus release from soils to
surface runoff and subsurface drainage. J. Environ. Qual. 30:508–520.
McDowell, R.W. and A.N. Sharpley. 2001b. Phosphorus losses in subsurface flow before
and after manure application to intensively farmed land. Sci. Tot. Environ.
278:113–125.
McDowell, R.W. and A.N. Sharpley. 2003. Phosphorus uptake and release from stream
sediments. J. Environ. Qual. 32: 937–948.
McDowell, R.W., A. Sharpley, and A.T. Chalmers. 2002. Chemical characterisation of fluvial
sediment: the Winooski River, Vermont. Ecol. Eng. 18:447–487.
© 2007 by Taylor & Francis Group, LLC
18 Modeling Phosphorus in the Environment
Menzel, R.G. 1980. Enrichment ratios for water quality modeling. Pp. 486–492 in CREAMS —
A Field Scale Model for Chemicals, Runoff and Erosion from Agricultural Management
Systems, vol. 3, W. Knisel (Ed.). Supporting Documentation, U.S. Department of Agri-
culture, Conservation Research Report 26, U.S. Government Printing Office,
Washington, D.C.
National Research Council. 2000. Clean Coastal Waters: Understanding and Reducing the
Effects of Nutrient Pollution. Washington, D.C.: National Academy Press.
Parton, W.J., J.M.O. Scurlack, D.S. Ojima, T.G. Gilmanov, R.J. Scoles, D.S. Schimal, T. Kirchner,
J.C. Menaut, T. Seastedt, E. Garcia Moya, A. Kamnalrut, and J.L. Kinyamario.
1993. Observations and modeling of biomass and soil organic matter dynamics for
the grasslands biome world-wide. Global Biochem. Cycles 7:785–809.
Pote, D.H., T.C. Daniel, D.J. Nichols, A.N. Sharpley, P.A. Moore, Jr., D.M. Miller, and D.R.
Edwards. 1999. Relationship between phosphorus levels in three Ultisols and phos-
phorus concentrations in runoff. J. Environ. Qual. 28:170–175.
Romkens, M.J.M., D.W. Nelson, and J.V. Mannering. 1973. Nitrogen and phosphorus com-
position of surface runoff as affected by tillage method. J. Environ. Qual. 2: 292–295.
Sharpley, A.N. 1985a. The selective erosion of plant nutrients in runoff. Soil Sci. Soc. Am. J.
49:1527–1534.
Sharpley, A.N. 1985b. Depth of surface soil-runoff interaction as affected by rainfall, soil
slope, and management. Soil Sci. Soc. Am. J. 49:1010–1015.
Sharpley, A.N. 1997. Rainfall frequency and nitrogen and phosphorus in runoff from soil
amended with poultry litter. J. Environ. Qual. 26:1127–1132.
Sharpley, A.N. (Ed.). 2000. Agriculture and Phosphorus Management: The Chesapeake Bay.
Boca Raton, FL: CRC Press.
Sharpley, A.N., P.J.A. Kleinman, R.J. Wright, T.C. Daniel, B. Joern, R. Parry, and T. Sobecki.
2000. The National Phosphorus Project: interfacing agricultural and environmental
phosphorus management in the U.S. Pp. 156–165 in International Conference on
Agricultural Effects in Ground and Surface Waters, J. Steenvooreden (Ed.). Wageningen,
The Netherlands: International Association of Hydrologic Sciences.
Sharpley, A.N. and S.J. Smith. 1994. Wheat tillage and water quality in the Southern Plains.
Soil Tillage Res. 30:33–38.
Sharpley, A.N., S.J. Smith, B.A. Stewart, and A.C. Mathers. 1984. Forms of phosphorus in
soil receiving cattle feedlot waste. J. Environ. Qual. 13:211–215.
Sharpley, A.N., S.J. Smith, J.R. Williams, O.R. Jones, and G.A. Coleman. 1991. Water quality
impacts associated with sorghum culture in the Southern Plains. J. Environ. Qual.
20:239–244.
Sharpley, A.N., S.J. Smith, J.A. Zollweg, and G.A. Coleman. 1996. Gully treatment and water
quality in the Southern Plains. J. Soil Water Conserv. 51:512–517.
Sharpley, A.N. and H. Tunney. 2000. Phosphorus research strategies to meet agricultural and
environmental challenges of the 21st century. J. Environ Qual. 29:176–181.
Sharpley, A.N. and J.R. Williams (Eds.). 1990. EPIC-Erosion/Productivity Impact Calculator:
I — model documentation. U.S. Department of Agriculture Tech. Bull. 1768.
Sims J.T., R.R. Simard, and B.C. Joern. 1998. Phosphorus losses on agricultural drainage:
Historical perspectives and current research. J. Environ. Qual. 27:277–293.
Smith, S. J., A.N. Sharpley, J.W. Naney, W.A. Berg, and O.R. Jones. 1991. Water quality
impacts associated with wheat culture in the Southern Plains. J. Environ. Qual.
20:244–249.
Summer, R.M., C.V. Alonso, and R.A. Young. 1990. Modeling linked watershed and lake
processes for water quality management decisions. J. Environ. Qual. 19:421–427.
© 2007 by Taylor & Francis Group, LLC
Modeling Phosphorus Movement from Agriculture to Surface Waters 19
U.S. Environmental Protection Agency. 1993. Guidance specifying management measures for
sources of non-point pollution in coastal waters. EPA-840-B93-100c, U.S. Govern-
ment Printing Office, Washington, D.C.
U.S. Environmental Protection Agency. 2000. The Total Maximum Daily Load (TMDL)
program. EPA 841-F-00-009, Office of Water (4503F), U.S. Government Printing
Office, Washington, D.C. Available at />U.S. Geological Survey. 1999. The quality of our nation’s waters: nutrients and pesticides.
U.S. Geological Survey Circular 1225, Information Services, Denver, CO. Available
at .
Westerman, P.W. and M.R. Overcash. 1980. Short-term attenuation of runoff pollution poten-
tial for land-applied swine and poultry manure. Pp. 289–292 in Livestock waste —
A renewable resource. Proceedings of the 4th International Symposium on Livestock
Wastes, April, Amarillo, TX.
Young, R.A., C.A. Onstad, and D.D. Bosch. 1995. AGNPS: An agricultural nonpoint source
model. Pp. 1001–1020 in Computer Models of Watershed Hydrology, V. P. Singh (Ed.).
Highlands Ranch, CO: Water Resources Publication.
Young, R.A., C.A. Onstad, D.D. Bosch, and W.P. Anderson. 1989. AGNPS: A nonpoint-source
pollution model for evaluating agricultural watersheds. J. Soil Water Conserv.
44:168–173.
© 2007 by Taylor & Francis Group, LLC