Modeling phosphorus in the environment - Chapter 14 ppt
Bạn đang xem bản rút gọn của tài liệu. Xem và tải ngay bản đầy đủ của tài liệu tại đây (200.88 KB, 17 trang )
333
14
Challenges to Using
and Implementing
Phosphorus Indices
in Nutrient Management
Planning: an MMP
Perspective
Philip Hess
Purdue University, West Lafayette, IN
Bradley Eisenhauer
Purdue University, West Lafayette, IN
Brad Joern
Purdue University, West Lafayette, IN
CONTENTS
14.1 Introduction 334
14.2 Design Flaws Present in Many First-Generation PIs 334
14.2.1 Overview 334
14.2.2 Inconsistencies between Prescreening Tools and PIs 335
14.2.3 Lack of Sliding Scales in PI Subcategories 336
14.2.4 Lack of Sliding Scales in Overall PI Interpretations 336
14.2.5 The Chicken–Egg Problem 337
14.2.6 The Bermuda Triangle 339
14.2.7 Temporal Discontinuities 340
14.3 Challenges Commonly Encountered by First-Generation PI Users 341
14.3.1 Overview 341
14.3.2 Some Input Data May Not Be Known during Planning 341
© 2007 by Taylor & Francis Group, LLC
334 Modeling Phosphorus in the Environment
14.3.3 What If a Field Is Not Uniformly Manured? 342
14.3.4 Gaming the System 342
14.4 Challenges and Opportunities for Implementing PIs in the Future 343
14.4.1 Potential Implementation Approaches 343
14.4.2 Implementation Challenges 345
14.4.2.1 Interpreting the Risk Assessment Procedure 345
14.4.2.2 Supplying Soil Loss Estimates 346
14.4.2.3 Errors or Gaps in Soils Data 346
14.4.2.4 Program Support and Maintenance 347
14.5 Conclusions 348
References 349
14.1 INTRODUCTION
Evaluating the potential risk of phosphorus (P) loss from crop fields to surface- and
groundwater resources is an important component of the nutrient management plan-
ning process. Nearly all states have developed a P index (PI) or other state-specific
P risk assessment tool for this purpose. Though most PIs were originally imple-
mented as paper worksheets or computer spreadsheets, in practice nearly all planners
will use PI tools implemented via computer software to speed up the planning
process.
In developing the Manure Management Planner (MMP) software, we have
programmed more than a dozen state-specific PI tools and have evaluated many
others as we prepare to program them (MMP, 2006). During this process we dis-
covered several significant challenges to both the use and implementation of PIs that
must be addressed before they can be used effectively for writing and implementing
nutrient management plans (NMPs). Our experience in programming and evaluating
various PIs, and our interactions with planners who use them, inform much of the
discussion presented in this chapter.
The general topics covered in this chapter include design flaws present in many
first-generation PIs, challenges commonly encountered by PI users, and challenges
and opportunities related to future PI development and implementation. The infor-
mation presented in this chapter should be useful to PI developers and programmers,
planners using first-generation PIs, and state and federal agency personnel respon-
sible for reviewing NMPs that include PI assessments.
14.2 DESIGN FLAWS PRESENT IN MANY
FIRST-GENERATION PIs
14.2.1 O
VERVIEW
The purpose, use, and interpretation of PIs vary widely from state to state. In some
states the PI interpretation is prescriptive and does limit the amount of P that can
be applied to fields that fall into certain categories of risk. In other states, the PI
© 2007 by Taylor & Francis Group, LLC
Challenges to Using and Implementing Phosphorus Indices 335
result is more advisory in nature and is used to identify potential problems associated
with P applications and to select fields and practices that present the lowest risk.
Ideally, field assessment using a PI or other P risk assessment tool should include
two steps. The first step should identify the inherent soil and landscape factors that
may limit P applications to a field, and the second step should determine the optimum
or maximum rate of P that may be applied based on application time and method.
The planner should use the results of the initial assessment to discuss inherent risk
factors with the producer and should determine how to address these issues with
improved management — if this is an option — and then should use the PI to
determine the optimum or maximum P rate. At a minimum, PIs should determine
allowable P rates based on time and method of application and other field and
management variables.
Unfortunately, many PIs were originally designed as post mortem risk assess-
ment tools rather than tools to help planners determine the optimum or maximum
rates of P that can be applied to a field. In these PIs, the assessment includes the
rate, time of year, and method of manure and commercial fertilizer P applications,
and the planner must run multiple scenarios to determine the optimum or maximum
rate of P that can be applied. If the objective of a PI is to help the user determine
P application rates, then many first-generation PIs fall short of the mark. The
following sections discuss some of the design flaws present in many PIs that limit
their potential usefulness for developing effective NMPs.
14.2.2 I
NCONSISTENCIES
BETWEEN
P
RESCREENING
T
OOLS
AND
PI
S
Planners typically perform some type of P risk assessment on all crop fields as part
of the nutrient management planning process. Due to the repetitive, computation-
intensive nature of most PIs, PI developers in many states developed a prescreening
procedure that eliminates the need to conduct the full PI on a field if certain criteria
are met. These prescreening procedures typically look at distance to water body, soil
test P level, field slope, or other readily available information. Though prescreening
procedures do reduce the total number of PI calculations, they also increase the risk
of overlooking potentially problematic fields and management scenarios and also
may lead to management decisions that will dramatically change the assessment
status of a field during the next round of plan development.
For example, if a prescreening procedure looks only at a field’s soil test P level
and distance to water, then the field will be exempt from the full PI assessment if
its P level is below a certain value and its distance to water is greater than a certain
value. If the field is exempt from further assessment, this usually means that manure
can be applied annually at a rate that supplies crop nitrogen (N) needs or, in the
case of legumes, the amount of N that the crop can utilize. In states where the rate
can be increased to account for anticipated losses of N between the time of appli-
cation and the time of plant N utilization, this can result in many years worth of P
being applied between soil tests if the state does not have any other cap on the rate.
In this case the planner is doing exactly what the assessment allows, but because
© 2007 by Taylor & Francis Group, LLC
336 Modeling Phosphorus in the Environment
the prescreening procedure allows the planner to skip the full PI assessment on
certain fields, they may be setting up the producer for a shock the next time the soil
in those fields is tested. In addition, since most PIs include the time, rate, and method
of manure application, we often find that N-based manure applications to fields
excluded from the full PI assessment based on prescreening results have PI results
that would not allow N-based management if the full PI had been run on these fields.
This lack of consistency in assessment makes the use of prescreening approaches
questionable in some states. With PI tool automation via computer software, the
additional increase in plan-writing efficiency made possible by using prescreening
tools probably is not great enough to justify the risk of overlooking potentially
problematic fields or of encouraging nonsustainable management strategies in the
resulting NMP.
14.2.3 L
ACK
OF
S
LIDING
S
CALES
IN
PI S
UBCATEGORIES
Nonsustainable P management plans often occur when a state does not have a
sliding scale on the upper ends of subcategories in traditional, matrix-based PIs.
For example, a state that does not have a soil test P limit above which no additional
P can be applied assigns the same number of points to any field above a certain
soil test P level. In the original PI template, a field is assigned eight points if its
soil test level is considered very high (Lemunyon and Gilbert, 1993). A state
might set the breakpoint for the very high category at 100 parts per million (ppm),
meaning a field with a soil test P level of 101 ppm would be assigned the same
8 points as a field with a soil test P level of 1001 ppm. The consequence of this
is that, all other things being equal, no distinction is made in the assessment
among fields that may be acceptable candidates for manure application and fields
that are probably very poor candidates for manure application. This can create a
false sense of security for the producer, who may continue managing the highest
testing fields in the same way that caused them to become high testing fields in
the first place. States that have implemented PIs with this problem could easily
address this issue with a sliding scale on the high risk end categories of all PI
inputs in matrix-based PIs.
14.2.4 L
ACK
OF
S
LIDING
S
CALES
IN
O
VERALL
PI I
NTERPRETATIONS
Though many PIs scale open-ended inputs like soil test P, soil loss, and P application
rate to avoid abrupt changes in a factor’s risk category due to small changes in input
values, the interpretation of the field’s overall PI value is usually not scaled. Instead,
most PIs have threshold values that are used to assign a field’s overall PI value to one
of several interpretation categories. For example, a PI might have a threshold value of
6.0, where a PI value above 6.0 indicates that no P can be applied and a PI value of
6.0 or below indicates that some P can be applied. What this means for the planner
and producer is that there is a significant difference between, say, 6.0 and 6.1, even
© 2007 by Taylor & Francis Group, LLC
Challenges to Using and Implementing Phosphorus Indices 337
though the magnitude of the numeric difference is small and may simply be due to
subtle differences in the way soil loss was estimated, for example.
The overall implication of hard thresholds in PIs is that the accuracy, even of
open-ended inputs, is critical, particularly soil loss. These thresholds also encourage
the planner to play with the inputs when a field’s PI value falls slightly above a
threshold rather than suggesting management changes that could actually reduce the
risk of P loss from the field. In many PIs, no scientific basis is given for the choice
of threshold values. And since the thresholds appear to be arbitrary, planners and
producers understandably question why the interpretation is so inflexible. This issue
could be resolved with minor modifications to many current PIs.
14.2.5 T
HE
C
HICKEN
–E
GG
P
ROBLEM
As stated previously, most PIs are post mortem assessment tools that include the
rate, time of year, and method of manure or commercial fertilizer P application.
With these PIs, the planner must run multiple scenarios to determine the optimum
or maximum rate of P that can be applied. This is a common problem with nearly
all PIs and is illustrated in the following scenario.
A planner wants to know the greatest possible P application rate that presents
an acceptable risk of P loss. The PI requires information about planned nutrient
applications and will indicate, once it has this information, if the planned appli-
cations are acceptable. For example, if the planner selects an application rate that
supplies the planned crop’s N need, two outcomes are possible when this appli-
cation is analyzed for risk. Either the application presents an acceptable risk, or
it does not. If the risk is too great, the rate must be reduced or the management
must be changed to lower the risk. However, if the rate is reduced, for example
to supply only the crop’s P need, a subsequent PI run might indicate that the risk
with the reduced rate is low enough that the rate can be increased. Somewhere
in-between the N-based rate and the P-based rate is the optimal rate that the
planner wants, but the assessment procedure is unable to determine it. So the
planner is forced into a game of trial and error, oscillating between higher and
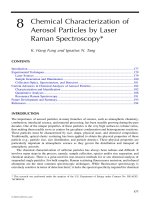
lower rates until the desired rate is eventually discovered. Table 14.1 illustrates
this iterative procedure.
In practice, determining the ideal rate this way can be a time-consuming and
frustrating experience. Though the risk assessment procedure is doing what it was
designed to do, which is to assess the risk for a given nutrient application scenario,
that is largely all it can do. For each application scenario, the planner must review
the available sources of organic and commercial fertilizer nutrients; consider appli-
cation equipment, timing windows, and labor availability; take into account hauling
costs if manure is involved; and discuss these issues with the producer, only to
discover after the risk assessment is performed that much of this work may have
been for naught.
Many planners intuitively understand that what is needed is a way of assessing
risk before committing resources to the actual nutrient application planning. We have
© 2007 by Taylor & Francis Group, LLC
338 Modeling Phosphorus in the Environment
learned that some planners will run the PI report before planning any nutrient
applications in MMP, hoping to discover something about the fields’ relative risk
independent of any nutrient applications. Since planning nutrient applications can
be one of the most time-consuming components of NMP development, planners
naturally are looking for ways to expedite this process. Though the preapplication
PI report will not be the final one, it may provide important clues about what fields
are poor candidates for nutrient applications in any scenario and what fields are
likely to be good candidates.
We have identified a couple of ways to address this obvious planning need.
One would be to develop a preliminary risk assessment procedure that considers
only the field’s inherent properties such as soil type, soil properties, field slope,
soil test levels, and distance to water, possibly including management factors that
the producer would be unlikely to modify, such as crop rotation or even application
timing. The results of this preliminary assessment could be fairly simple, for
example, dividing fields into two groups: those that are not likely to be good
TABLE 14.1
Chicken–Egg Iterative Process for Determining Maximum Manure
Application Rate Allowed by PI
Iteration Rate Basis
Planned Rate
(Gal/Acre) PI Rating
PI
Interpretation
1 No manure applied 0 Low Use N-based
management
2 Crop N need 3900 Very high No P applied
3 1-year crop P removal 700 Low Use N-based
management
4 2-year crop P removal 1400 Low Use N-based
management
5 3-year crop P removal 2100 Medium Use N-based
management
6 4-year crop P removal 2800 High P limited to crop
removal
7 5-year crop P removal 3500 Very high No P applied
8 4.5-year crop P removal 3200 Very high No P applied
9 4.25-year crop P removal 3000 Very high No P applied
10 4.1-year crop P removal 2900 High P limited to crop
removal
Notes: In this hypothetical scenario, rates have been rounded up to the nearest 100 gallons.
Equilibrium is reached when the highest rate with a high rating is found (iteration 10). In
practice, a planner would likely stop iterating when the highest rate with a whole number of
years’ P removal is found (iteration 6, but 7 iterations would be required to determine this).
© 2007 by Taylor & Francis Group, LLC
Challenges to Using and Implementing Phosphorus Indices 339
candidates for nutrient applications in any scenario and those that are good can-
didates, or could become good candidates with appropriate management or con-
servation practices. The planner could then concentrate initially on the good
candidates, turning to the poorer candidates only if they are needed to utilize
manure. A complete risk assessment would still be done on any field that receives
manure, unlike some prescreening procedures, which exempt certain fields from
any further assessment.
Another approach would be to leave the current risk assessment procedures
unchanged but to program the PI software tool to iterate through various rates until
it finds the highest rate that still presents an acceptable level of risk for a particular
application method and timing scenario. In other words, the PI tool would automate
the trial-and-error process that the planner currently has to perform manually.
14.2.6 THE BERMUDA TRIANGLE
The previous section describes the circular dependency of planned manure appli-
cations and PI interpretation. A third element, estimated soil loss, is often
involved as well because planned manure applications can affect estimated soil
loss, and estimated soil loss is an input for most PIs. For example, surface-
applied solid manure can add a significant amount of residue to a field, generally
lowering soil loss, whereas incorporating liquid manure can disturb a field’s
existing plant residue, generally increasing soil loss. This means that for each
change in planned manure application rate, the Revised Universal Soil Loss
Equation version 2 software (RUSLE2, 2006) needs to be run again to determine
an adjusted soil loss estimate, and the new soil loss estimate must be entered
into the PI to calculate an adjusted PI value. This revised PI value is then used
to evaluate whether the new application rate is acceptable. If the rate is not
acceptable, this three-step process — rate determination, soil loss estimation, PI
calculation, hence the term Bermuda Triangle — needs to be repeated until an
acceptable rate is discovered.
In practice, some planners may not account for the impacts of manure applica-
tions in RUSLE2, and fewer still likely determine the impacts of different manure
application rates on estimated RUSLE2 soil loss. Should all changes to planned
manure applications be reflected in RUSLE2? If changes to the planned crop rotation
and yield goals must be reflected in RUSLE2, then the answer to this question is
probably yes.
Unfortunately, accounting for planned manure applications in RUSLE2 can be
tricky. Though some RUSLE2 Crop Management Zone (CMZ) files include crop-
management scenarios that account for typical manure applications for common
crop rotations, these management scenarios may not match the field’s planned crop
rotation or may differ in other assumptions about application rate, timing, and
associated tillage operations. In these cases, the planner must create a custom crop-
management scenario and manually enter all planned manure applications and asso-
ciated tillage operations during the rotation, as well as manually calculate the amount
© 2007 by Taylor & Francis Group, LLC
340 Modeling Phosphorus in the Environment
of residue added to the field by each application based on the manure’s dry matter
concentration. To manually solve the Bermuda Triangle, planners currently must use
three separate software tools. This is a time-consuming, repetitive process. The only
way to speed up the rate calculations is to dynamically link all three software tools
to automate this iterative process in a manner similar to solving the chicken–egg
scenario.
14.2.7 T
EMPORAL
D
ISCONTINUITIES
Guidance from the assessment procedure’s authors is usually helpful in determining
the PI’s temporal scope. Some PIs are designed to assess fields over the entire rotation
or planning period, whereas other PIs assess each crop year separately and may or
may not combine these results into a summary interpretation. Once a decision has
been made to calculate the assessment on an annual or rotational basis, related issues
must then be addressed. For example, most risk assessment procedures utilize esti-
mated soil loss by water, which historically has been calculated as a long-term
annualized average for the entire rotation. However, if the risk assessment is deter-
mined on an annual basis, soil loss also should be determined for each cropping
year in the rotation because soil loss estimates can differ considerably from year to
year as a field’s crop, tillage, and planned manure applications change. As a result,
using a rotational average soil loss may overestimate risk in some years and under-
estimate risk in other years.
Using rotational average soil loss estimates in the PI also makes the process of
determining appropriate manure application rates nearly impossible because the
impact of a current planned manure application can change the PI result for a
previous application. For example, if liquid manure is applied to a corn silage field
in the first year of the plan, it will have some impact on rotational average soil
erosion. If during the second year of the plan, solid manure is applied to this same
field, soil erosion may decrease dramatically for that year and may lower the rota-
tional average soil loss. This change in rotational average soil loss will actually
change the PI value for the previous year’s application. Though a previous year’s
manure application certainly may impact future applications, applications planned
for future years should not impact the previous year’s planned application. The
circular interaction cannot be solved with software. Any PI that uses the rotational
average soil loss has this inherent design flaw. The solution to this problem is for
PIs to use annual soil loss estimates for each crop year in the plan. However, per
current PI guidelines, MMP’s PIs use the rotational average soil loss with annual
assessments in most states.
States that use a rotational risk assessment procedure, or a matrix-based PI that
has no inherent temporal context, also face the issue of data that cannot be averaged.
For example, many assessment procedures use information about the timing and
method of nutrient applications, but these data cannot be averaged. If manure is
applied differently to a field throughout the rotation — or even for multiple appli-
cations within a given year — one time and method must be selected for use in the
© 2007 by Taylor & Francis Group, LLC
Challenges to Using and Implementing Phosphorus Indices 341
assessment. In general, if not specified by the assessment procedure, MMP’s PIs
use the time and method that present the greatest risk. In most cases, this approach
unfairly penalizes the producer in the overall PI assessment for a field. Second-
generation PIs should use an annual PI assessment for each crop year and then, if
appropriate, should generate a summary report for each field.
14.3 CHALLENGES COMMONLY ENCOUNTERED
BY FIRST-GENERATION PI USERS
14.3.1 OVERVIEW
Because the purpose, data requirements and interpretation of PIs vary widely
across states, planners must have a solid understanding of these and other issues
to properly use PIs in the plans they develop. Normally this requires instruction
of some kind, either as training specific to the PI or as part of a larger nutrient
management planning course. However, based on our experience, many planners,
especially those working in multiple states, have received little or no in-depth
training on PIs and have acquired their knowledge about various PIs from slide
shows, sample nutrient management plans, extension publications, and USDA-
NRCS Nutrient Management 590 standards (NRCS, 2006). Some states have
developed nutrient management planning Web sites to provide required data and
helpful reference materials at a single location. Even with PI software that auto-
mates much of the assessment procedure, planners often struggle with operation-
specific issues frequently encountered in the real world but that are not generally
covered in training courses or reference materials. This section discusses a few of
these common challenges.
14.3.2 S
OME
I
NPUT
D
ATA
M
AY
N
OT
B
E
K
NOWN
DURING
P
LANNING
Some PIs depend on knowledge of soil and field conditions such as residue cover,
hydrologic condition, soil condition, and field condition (e.g., whether the soil is
frozen) in calculating runoff and other factors, even though these inputs will not be
known when the NMP is created. With these inputs, MMP’s PI tools make an
assumption based on crop rotation or application timing. For example, with field
condition, a PI tool for a state in the north-central U.S. might assume that the soil
is likely to be frozen during the winter months of December through February and
not frozen during other months of the year. Even though in any given year there
may be periods during the winter when the soil is not frozen, and there is always
the possibility that the soil could be frozen outside of the winter months, from a
planning perspective this assumption is simply indicating that it is risky to count on
fields being available (unfrozen) during those months. This is consistent with the
idea that multiyear NMPs are designed to demonstrate that the producer can manage
the operation’s manure properly in a typical year.
© 2007 by Taylor & Francis Group, LLC
342 Modeling Phosphorus in the Environment
14.3.3 WHAT IF A FIELD IS NOT UNIFORMLY MANURED?
Many risk assessment procedures ask for the rate, method, and timing of P appli-
cations. Though at first glance this may appear to be an easy question to answer,
determining this information can be difficult in a number of situations. For example,
most states have regulatory manure application setback areas such as streams, wells,
sinkholes, roads, and property boundaries. In general, manure cannot be applied
here. If the affected area is small, it may be possible to disregard this area in the
field’s assessment. However, if the nonmanured area is large enough that the producer
will likely apply commercial fertilizer to it, the result is a field that may have
significant differences between its manured and nonmanured parts in the rate,
method, and timing of P applications. A good rule of thumb is to subdivide these
kinds of fields and then do an independent risk assessment on each subfield.
Large fields also are sometimes not completely manured, usually because the
producer does not have enough manure to cover the entire field. Ideally, these fields
should also be subdivided so that each subfield can be uniformly manured from the
same manure source, with the same equipment, and during the same time of year.
If fields are not subdivided, MMP’s PI tools calculate a per-acre weighted average
rate, even though there may be significant rate differences across the field. The PI
assessment results can be misleading in these cases.
14.3.4 G
AMING
THE
S
YSTEM
Gaming the system is the term we use to describe the process of determining manure
application strategies that may be used by some experienced planners once they fully
understand the design flaws inherent in the PI with which they are working. The
circular chicken–egg problem discussed previously arises when the P application rate
is a factor in determining the PI value, whereas the PI value in turn is used to limit
the application rate. When RUSLE2 is included in the PI, the issue becomes even
more complicated (i.e., the Bermuda Triangle). To further compound the P rate deter-
mination dilemma, PIs often lack scaling in PI subcategories or in the final PI inter-
pretation. Matrix-based first-generation PIs have most of these inherent design flaws.
These PI design flaws also have another side effect. With P-based management,
the maximum rate will usually put the field off limits for further manure applications
until the P applied has been removed from the field as harvested crop material. In
many cases, this will take several harvests. Reducing the rate to where the PI result
allows N-based management may permit annual applications at a rate that in many
cases is only slightly less than the multiyear P-based maximum rate. Although
allowed by the PI, this can result in a rapid build-up of soil P, which may mean that
fields managed in this way will abruptly become unavailable following the next
round of soil testing if the state has a soil test P cutoff level above which no further
P can be applied. Whether intentional or not, this application strategy could be
problematic for the producer and surely is not what the designers of the PI intended.
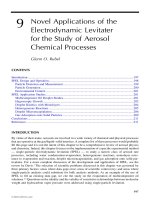
Table 14.2 illustrates this problem.
© 2007 by Taylor & Francis Group, LLC
Challenges to Using and Implementing Phosphorus Indices 343
14.4 CHALLENGES AND OPPORTUNITIES
FOR IMPLEMENTING PIs
IN THE FUTURE
14.4.1 P
OTENTIAL
I
MPLEMENTATION
A
PPROACHES
In developing MMP, we have identified several possible approaches to implement-
ing (programming) PIs. One approach would be to implement the PI as part of the
larger nutrient management planning software, in our case MMP. The chief disad-
vantage to making the PI tool a built-in part of the planning software is that even
minor changes or corrections to the PI procedure require a revision of the planning
software. Another disadvantage is that the source code for the PI tool probably will
not be made available if it is part of a larger program. This approach also runs
counter to MMP’s development philosophy, where all state-specific crop-fertilizer
recommendations, manure nitrogen availability estimates, manure application rate
calculations, and state-specific reports are driven by human-readable data stored
external to MMP.
Another possible approach would be to create an external program, complete
with data entry and storage capabilities, which is independent of the planning
software. Traditionally this has meant a Microsoft Excel spreadsheet, which can be
difficult to debug, document, and maintain once a certain level of complexity is
reached. Spreadsheets date to the very first personal computers but now represent
an approach that is out of step with modern software development best practices.
TABLE 14.2
Gaming the System by Reducing the Manure Application Rate
Enough to Permit Annual Applications
Year
Planned Rate When Using Maximum
P-Based Management Rate
(Gal/Acre)
Planned Rate When Using
Maximum N-Based
Management
Rate (Gal/Acre)
1 2900 2100
20 2100
30 2100
40 2100
Total 2900 (4 years of crop P removal) 8400 (12 years of crop
P removal)
Notes: 2900 gal/acre is the maximum rate determined in Table 14.1, which puts
the field off limits to further application for four years. 2100 gal/acre is the highest
rate from Table 14.1 that still permits N-based management (annual applications).
© 2007 by Taylor & Francis Group, LLC
344 Modeling Phosphorus in the Environment
Linking the spreadsheet to other software also is unlikely, since getting data into or
out of a spreadsheet programmatically can be difficult. Though useful for prototyping
and proof of concept work, a spreadsheet is rarely the right tool for creating pro-
duction quality software.
Of course, an external PI tool does not need to be implemented as a spreadsheet.
A database like Microsoft Access could be used, or the PI tool could be built from
scratch as a stand-alone program that does not require Excel or Access. The PI tool
could even be implemented as a Web-based calculator. However, as with a spread-
sheet, the PI tool would still need to implement its own user interface for data entry,
its own program help, and its own data storage. Though this may be acceptable if
only one PI tool is being developed, implementing PIs for multiple states this way
would likely involve duplication of effort from one tool to the next. This approach
also means that data common to both the planning software and the PI tool are
stored in both programs and can get out of sync if one program’s data are edited
but not the other’s.
A third possible approach involves exporting data from the planning software
to an existing PI spreadsheet. Since many states already have working spreadsheet
versions of their risk assessment procedures, this would seem like an obvious choice
because it means that the planning software developers would not necessarily have
to understand the PI to utilize it. This type of blind exporting makes sense when the
target program has a well-defined application programming interface (API) or data
input format, but a PI spreadsheet generally will not have this. Spreadsheet-based
PI tools often are designed to be operated only in an interactive calculator mode,
meaning they do not have a place to put data for more than one crop field at a time.
This approach also has some of the same data linkage and duplication issues as the
second approach. Each state PI, too, would require its own link with the planning
software, which could involve just as much programming effort as implementing
the risk assessment procedure itself. With a PI spreadsheet, this kind of link tends
to be fragile since the planning software needs to write to specific cells in the
spreadsheet. Any modification to the PI spreadsheet can break this type of link.
Still another approach involves creating an external report designed specifically
to draw on data entered and stored in the planning software to calculate the risk
assessment. Since reports are normally driven by data from database queries, a
database like Access can be used to develop the report. This approach avoids most
of the problems in the approaches discussed previously, although the assessment
report still must be developed on a state-by-state basis.
No field data are actually entered in the report tool. This means that all field
data must come from the planning software. MMP includes a special assessment
data input panel to supply all of the data required by the PI report. This panel serves
as a collection site for any additional field data required by various state PIs. It
includes dedicated columns for entering commonly used assessment data such as
distance to water, buffer width, artificial drainage type, and estimated water, wind,
irrigation, gully, and ephemeral erosion. The assessment panel also has several
optional columns that can be enabled for entering miscellaneous data unique to a
© 2007 by Taylor & Francis Group, LLC
Challenges to Using and Implementing Phosphorus Indices 345
particular state. Assessment panel data generally are not used in the nutrient man-
agement planning process per se but are simply passed along with field, crop, and
nutrient application data to the PI report.
There are several advantages to this approach. Since the PI tool draws exclusively
on data from the planning software, this means the PI tool does not need its own
user interface or data storage. Since data are only entered and stored in one place,
the PI tool always uses the current plan data whenever it is run. Any import or export
facilities in the planning software can be used to import and export PI input data as
well. This approach also allows the PI tool to be modified and distributed independent
of the planning software. The PI’s source code also can be included without exposing
the planning software’s source code. The PI report’s database queries also can be
used in other ways, for example to create a table of assessment results — rather
than a full report — that can be inserted into a nutrient management plan document.
Finally, this type of P tool can theoretically be developed or modified by third parties
rather than by the planning software developers.
This is the current approach taken by MMP, and though the resulting reports
are of immediate and significant benefit to planners, we consider this approach only
a short-term solution necessitated by the need to produce something that increases
planner productivity compared to using a spreadsheet-based implementation.
Because of MMP’s dependency on both RUSLE2 and PIs in determining and
evaluating manure application rates, in the longer term both RUSLE2 and PIs need
to be integrated more closely with MMP, although stopping short of becoming part
of MMP. To further speed up the planning process, MMP will eventually need to
have real-time, on-demand access to RUSLE2 and PI results for any given field,
similar to the way MMP automatically recalculates a field’s crop fertilizer recom-
mendations whenever any crop inputs change. This PI tool implementation strategy
would help solve the Bermuda Triangle issue.
14.4.2 I
MPLEMENTATION
C
HALLENGES
As part of the national MMP project, we have implemented over a dozen state-
specific PI tools. Though each has its own specific challenges, the following imple-
mentation challenges are common to many risk assessment procedures.
14.4.2.1 Interpreting the Risk Assessment Procedure
The overall goals of a state’s risk assessment procedure, as well as its equations and
algorithms, are usually well documented or can be determined from existing spread-
sheets or planning examples. However, as discussed previously, sometimes the tem-
poral scope of the assessment or other essential details of its use are not clear. For
example, a common issue is determining whether a state’s assessment should be
applied to one or more individual crop years or to the crop rotation as a whole. Though
one implementation solution might be to provide both options, this does not necessarily
help the planners using the software, who will then be forced to make this decision.
© 2007 by Taylor & Francis Group, LLC
346 Modeling Phosphorus in the Environment
14.4.2.2 Supplying Soil Loss Estimates
RUSLE2 is the software used to estimate soil loss by water for official USDA-NRCS
purposes. RUSLE2 is a complex, stand-alone program with its own user interface
and data storage. RUSLE2 brings additional capabilities to soil loss estimation over
its table-driven predecessor, RUSLE, although at the expense of increased complex-
ity and data input requirements. Many risk assessment procedures were developed
prior to the deployment of RUSLE2, assume that soil loss is something that is easy
to estimate, and may not be designed for RUSLE2’s estimates. For example, assess-
ment procedures that ask for both sediment delivery and any vegetative buffer or
sediment control structure that reduces sediment delivery may be double counting
the impact of these structures on P loss since RUSLE2’s sediment delivery values
already take these structures into account. Implementing this sort of assessment
procedure merely propagates the data mismatch, rather than eliminates it.
Historically, a field’s estimated soil loss, once determined, has sometimes been
treated almost like a constant or an inherent property of the field rather than as a snapshot
of the complex, dynamic process that is soil erosion. This may have contributed to the
development of PIs that consider soil loss as just another input rather than as something
that is inextricably linked to the manure applications that the PI is designed to evaluate.
Many of the input data required by RUSLE2 also are used by nutrient manage-
ment planning software. However, without a software link to RUSLE2 these data
must be entered manually into RUSLE2. MMP currently addresses this problem by
exporting common data such as field ID, slope, and soil type from the MMP plan
to RUSLE2. Though this eliminates duplicate entry of common field data, it also
means that these data are now stored in more than one place, creating the potential
for data to get out of sync. However, this data synchronization problem is not unique
to MMP and RUSLE2. In the nutrient management planning world, the same field
data also may be stored in GIS mapping software, commercial farm management
software, recordkeeping programs, and software such as Customer Service Toolkit,
which is used by NRCS field offices to develop conservation plans (Toolkit, 2006).
MMP also can import each field’s rotational average soil loss from RUSLE2 —
and could import annual, or even seasonal, soil losses — since this is the value used
in most PIs. This does not simplify the problem of using RUSLE2 efficiently and
correctly, but it does eliminate the manual entry of these values into MMP and means
that the soil loss estimates can be stored in the MMP plan file with the other data
required to calculate the PI.
14.4.2.3 Errors or Gaps in Soils Data
In addition to field and soil loss data, most PIs also are driven by soils data, specifically
the underlying properties of the field’s predominant or most limiting soil type. The
National Soil Information System (NASIS) database is NRCS’s central repository for
U.S. soils data (NASIS, 2006). However, the soils data are not updated at the national
level and the completeness and accuracy of data can differ from state to state.
© 2007 by Taylor & Francis Group, LLC
Challenges to Using and Implementing Phosphorus Indices 347
For example, in NASIS, each component of a soil map unit can be associated
with a representative slope length, which is the distance from the overland flow’s
point of origin to where the slope decreases enough that soil deposition begins.
Slope length is also an input to RUSLE2. Though determining slope length in the
field is the preferred method, there are situations where having a rough estimate
based on soil type is adequate for RUSLE2. NASIS would be the natural source for
these slope length estimates. However, though in some states slope lengths are
available in NASIS for most soils, in others these values are missing or appear to
be a mix of values in meters and feet. Due to these database issues, and because of
the fact that planners should determine slope lengths in the field as part of the site
visit, MMP currently does not export slope lengths to RUSLE2 based on soil type.
Sometimes there can be a difference between the data that the assessment
procedure’s authors had in mind and the data available to the planner. For example,
many assessment procedures use some measure of a field’s runoff potential in
determining risk. This potential is typically either the NASIS surface runoff class,
which is based on soil permeability and field slope, or a class based on soil hydrologic
group and field slope. However, the derivation of the NASIS runoff class is not static
and may be periodically recalculated. This may result in values that differ from those
originally used by the authors of the PI.
The content, format, and availability of soils data are also constantly evolving
as new methods of delivering soils data to users are developed and tried out. Currently
soils data for a single survey — typically one county — can be downloaded from
the NRCS Soil Data Mart and imported into a supplied Access database for viewing
and summarizing (Soil Data Mart, 2006). Soils data for RUSLE2 are available for
downloading along with the RUSLE2 software. MMP includes selected soil data for
each state that it supports. For each state where MMP also includes a PI tool, these
data include any soil properties required by the PI tool as well.
14.4.2.4 Program Support and Maintenance
Questions will naturally arise during the risk assessment phase of NMP development,
both about the PI and the PI software implementation tool. In general, questions about
the PI should be directed to its authors or the responsible agency, whereas questions
about the PI tool should be directed to the tool developers. However, planners some-
times look to the tool developers for help with the PI because they cannot obtain help
elsewhere, because the PI tool is the context where their questions arose or simply
because they do not make a distinction between the PI and the PI tool. This puts the
PI tool developers in the awkward position of being considered experts about the PI.
As with many software support issues, there is no easy solution to this problem.
Maintaining a piece of software can be as difficult as developing a new program.
Maintaining multiple PIs can also be challenging. With MMP’s PI tools we devel-
oped an Access database template containing common code and design elements
that can be used with all PIs as well as a common report style and method of
presentation. Though each PI tool represents a particular state’s thinking on the risk
© 2007 by Taylor & Francis Group, LLC
348 Modeling Phosphorus in the Environment
of P loss from crop fields, which may differ in both obvious and subtle ways from
other states, the high-level structure of all PI tools is similar, differing primarily in
the low-level implementation details.
14.5 CONCLUSIONS
PIs present a variety of challenges not only to the planners who use them but also to
the programmers who have taken on the job of implementing them as part of larger
NMP programs. Though implementing PIs can reduce some of the challenges currently
facing planners, in other cases, particularly with the complicated interaction of manure
application rate, soil loss, and PI interpretation, advances will take place only with
considerable future programming efforts.
Current state P risk assessment procedures represent an advance over previous
efforts to evaluate site and management risks; however, some are not optimized for
software implementation, and many were designed more for current-year or post
mortem analysis than for multiyear nutrient management planning. Next-generation
assessment procedures need to address the issues discussed in this chapter as well
as to anticipate emerging trends in nutrient management. For example, most assess-
ment procedures do not address variations in P source availability. The availability
of P in alum-treated poultry litter is probably different enough from hog and dairy
manure that it needs to be considered in any assessment procedure.
Manure allocation strategies need to consider economic factors as well. For exam-
ple, given two fields with similar risk an economic analysis can help identify the field
with the higher priority for manure application. But what about fields with dissimilar
risk? Should economics ever trump risk? For example, would an increased level of risk,
perhaps on a small area, that realizes larger cost savings elsewhere ever be acceptable?
Is there a role for regional or even national P risk assessment procedures?
Differences among current assessment procedures, coupled with differences in fer-
tilizer recommendations and assumptions made about applied manure N availability,
mean that — all other things being equal — producers are allowed to apply manure
at greater rates in some states than in others. A regional assessment procedure might
help level the playing field among states. An analogy with RUSLE2 is apt: Even
though significantly more complex to program than even the most complicated state
PI, the authors of RUSLE2 have been able to deliver a single national program that
is driven by standard, localized data and produce a standard result that can be
compared across states. A single, quantitative, process-oriented model for estimating
the quantity of P lost from a field would be very useful for making objective PI risk
assessments. In time, this quantitative model could replace individual state PIs, which
are largely qualitative in nature.
Most PIs and other risk assessment procedures emerged as the result of numerous
meetings and much correspondence between multiple authors from several agencies
over a period of months or sometimes even years. Reassembling this group in each
state might be the biggest challenge to developing next-generation assessment
procedures.
© 2007 by Taylor & Francis Group, LLC
Challenges to Using and Implementing Phosphorus Indices 349
REFERENCES
Lemunyon, J.L. and R.G. Gilbert. 1993. The concept and need for a phosphorus assessment
tool. Journal of Production Agriculture. 6:483–486.
MMP. 2006. Manure management planner. Purdue University. due.
edu/mmp.
NASIS. 2006. National soil information system. Natural Resources Conservation Service.
/>NRCS. 2006. Natural Resources Conservation Service Conservation Practice Standard. Code
590. />RUSLE2. 2006. Revised Universal Soil Loss Equation, Version 2. due.
edu/rusle2_dataweb/RUSLE2_Index.htm.
Soil Data Mart. 2006. Natural Resources Conservation Service Soil Data Mart. http://
soildatamart.nrcs.usda.gov/.
Toolkit. 2006. Natural Resources Conservation Service. />© 2007 by Taylor & Francis Group, LLC