2000 CDC Growth Charts for the United States: Methods and Development - part 3 ppt
Bạn đang xem bản rút gọn của tài liệu. Xem và tải ngay bản đầy đủ của tài liệu tại đây (2.38 MB, 20 trang )
Figure 13. Individual growth chart 3rd, 5th, 10th, 25th, 50th, 75th, 90th, 95th, 97th percentiles, 2 to 20 years: Boys body mass index-for-age
Series 11, No. 246 [ Page 31
Figure 14. Individual growth chart 3rd, 5th, 10th, 25th, 50th, 75th, 85th, 90th, 95th, 97th percentiles, 2 to 20 years: Girls body mass
index-for-age
Page 32 [ Series 11, No. 246
Series 11, No. 246 [ Page 33
Figure 15. Individual growth chart 3rd, 5th, 10th, 25th, 50th, 75th, 85th, 90th, 95th, 97th percentiles: Boys weight-for-stature
Page 34 [ Series 11, No. 246
Figure 16. Individual growth chart 3rd, 5th, 10th, 25th, 50th, 75th, 85th, 90th, 95th, 97th percentiles: Girls weight-for-stature
Figure 17. Clinical growth chart 5th, 10th, 25th, 50th, 75th, 90th, 95th percentiles, birth to 36 months: Boys length-for-age and weight-for-
age percentiles
Series 11, No. 246 [ Page 35
Figure 18. Clinical growth chart 5th, 10th, 25th, 50th, 75th, 90th, 95th percentiles, birth to 36 months: Girls length-for-age and weight-for-age
percentiles
Page 36 [ Series 11, No. 246
Figure 19. Clinical growth chart 5th, 10th, 25th, 50th, 75th, 90th, 95th percentiles, birth to 36 months: Boys head circumference-for-age and
weight-for-length
Series 11, No. 246 [ Page 37
Figure 20. Clinical growth chart 5th, 10th, 25th, 50th, 75th, 90th, 95th percentiles, birth to 36 months: Girls head circumference-for-age and
weight-for-length
Page 38 [ Series 11, No. 246
Figure 21. Clinical growth chart 5th, 10th, 25th, 50th, 75th, 90th, 95th percentiles, 2 to 20 years: Boys stature-for-age and weight-for-age
Series 11, No. 246 [ Page 39
Figure 22. Clinical growth chart 5th, 10th, 25th, 50th, 75th, 90th, 95th percentiles, 2 to 20 years: Girls stature-for-age and weight-for-age
Page 40 [ Series 11, No. 246
Figure 23. Clinical growth chart 5th, 10th, 25th, 50th, 75th, 85th, 90th, 95th percentiles, 2 to 20 years: Boys body mass index-for-age
Series 11, No. 246 [ Page 41
Figure 24. Clinical growth chart 5th, 10th, 25th, 50th, 75th, 85th, 90th, 95th percentiles, 2 to 20 years: Girls body mass index-for-age
Page 42 [ Series 11, No. 246
Figure 25. Clinical growth chart 5th, 10th, 25th, 50th, 75th, 85th, 90th, 95th percentiles: Boys weight-for-stature
Series 11, No. 246 [ Page 43
Figure 26. Clinical growth chart 5th, 10th, 25th, 50th, 75th, 85th, 90th, 95th percentiles: Girls weight-for-stature
Page 44 [ Series 11, No. 246
Series 11, No. 246 [ Page 45
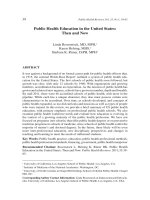
Percentile
105
97
95
90
100
75
50
95
25
10
5
90
3
85
80
0
21 23 25 27 29 31 33 35 37 39
Age (months)
Length
Stature
Length or stature (cm)
Figure 27. Smoothed percentile curves, 22–39 months: Boys length-for-age and stature-for-age
Page 46 [ Series 11, No. 246
97
95
90
70
50
25
10
5
3
80
85
90
95
100
105
Length
Stature
Percentile
0
21 23 25 27 29 31 33 35 37 39
Age (months)
Figure 28. Smoothed percentile curves, 22–39 months: Girls length-for-age and stature-for-age
Length or stature (cm)
Series 11, No. 246 [ Page 47
97
95
90
75
50
25
10
5
3
8
9
10
11
12
13
14
15
16
17
18
19
20
21
22
Length
Percentile
Stature
0
74 78 82 86 90 94 98 102 106
Length or stature (cm)
Weight (kg)
Figure 29. Smoothed percentile curves, 75–106 cm: Boys weight-for-length and weight-for-stature
Page 48 [ Series 11, No. 246
Percentile
97
5
6
7
8
9
10
11
12
13
14
15
16
17
18
19
20
21
22
0
Length
Stature
95
90
75
50
25
10
5
3
74 78 82 86 90 94 98 102 106
Length or stature (cm)
Figure 30. Smoothed percentile curves, 75–106 cm: Girls weight-for-length and weight-for-stature
Weight (kg)
Series 11, No. 246 [ Page 49
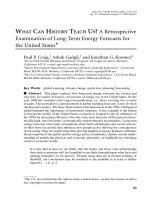
Percentile
18
97
17
Smoothed percentile curves
Empirical data points
NOTE: When values at a given age for two or more percentile lines are
identical, the values are overlaid and appear as a single data point.
90
16
15
50
14
13
10
12
3
11
10
9
8
7
6
5
4
3
2
1
0
0 3 6 9 12 15 18 21 24 27 30 33 36
Age (months)
Weight (kg)
Figure 31. Comparison of smoothed 3rd, 10th, 50th, 90th, 97th percentile curves to empirical data points, birth to 36 months: Boys
weight-for-age