báo cáo khoa học:" Cross-cultural validity of four quality of life scales in persons with spinal cord injury" docx
Bạn đang xem bản rút gọn của tài liệu. Xem và tải ngay bản đầy đủ của tài liệu tại đây (366.8 KB, 16 trang )
RESEARC H Open Access
Cross-cultural validity of four quality of life scales
in persons with spinal cord injury
Szilvia Geyh
1,2*
, Bernd AG Fellinghauer
1,2,3
, Inge Kirchberger
4
, Marcel WM Post
5
Abstract
Background: Quality of life (QoL) in persons with spinal cord injury (SCI) has been found to differ across countries.
However, comparability of measurement results between countries depends on the cross-cultural validity of the
applied instruments. The study examined the metric quality and cross-cultural validity of the Satisfaction with Life
Scale (SWLS), the Life Satisfaction Questionnaire (LISAT-9), the Personal Well-Being Index (PWI) and the 5-item
World Health Organization Quality of Life Assessment (WHOQoL-5) across six countries in a sample of persons with
spinal cord injury (SCI).
Methods: A cross-sectional multi-centre study was conducted and the data of 243 out-patients with SCI from
study centers in Australia, Brazil, Canada, Israel, South Africa, and the United States were analyzed using Rasch-
based methods.
Results: The analyses showed high reliability for all 4 instruments (person reliability index .78 92).
Unidimensionality of measurement was supported for the WHOQoL-5 (Chi
2
= 16.43, df = 10, p = .088), partially
supported for the PWI (Chi
2
= 15.62, df = 16, p = .480), but rejected for the LISAT-9 (Chi
2
= 50.6 0, df = 18, p =
.000) and the SWLS (Chi
2
= 78.54, df = 10, p = .000 ) based on overall and item-wise Chi
2
tests, principal
components analyses and independent t-tests. The response scales showed the expected ordering for the
WHOQoL-5 and the PWI, but not for the other two instruments. Using differential item functioning (DIF) analyses
potential cross-country bias was found in two items of the SWLS and the WHOQoL-5, three items of the LISAT-9
and four items of the PWI. However, applying Rasch-based statistical methods, especially subtest analyses, it was
possible to identify optimal strategies to enhance the metric properties and the cross -country equivalence of the
instruments post-hoc. Following the post-hoc procedures the WHOQOL-5 and the PWI worked in a consistent and
expected way in all countries.
Conclusions: QoL assessment using the summary scores of the WHOQOL-5 and the PWI appeared cross-culturally
valid in persons with SCI. In contrast , summary scores of the LISAT-9 and the SWLS have to be interpreted with
caution. The findings of the current study can be especially helpful to select instruments for international research
projects in SCI.
Background
In the general population, quality of life (QoL) is mea-
sured across countries to indicate the state and develop-
ment of societies like, for example, in the annual
Eurobarometer of the European Commission [1] or the
World Values Surv ey [2]. Nation al levels of QoL have
been found to be related with wealth, human rights,
individualism, and the fulfillment of basic biological
needs in a given society [3,4]. Measuring QoL of
individuals with certain health conditions provides infor-
mation about health states beyond diagnosis, about the
impact of a disease and its treatment on different
domains of daily life, and about the health experience
from the “insider” perspective of the affected persons
themselves [5,6]. In relation to health, QoL is measured
across countries to compare the burden of disease and
disability in different populations. However, QoL is not
restricted to health-related issues.
The notion of QoL in general covers various concepts
including health-related quality of life (HRQoL) but also
subjective well-being (SWB) [7]. HRQoL, on the one
* Correspondence:
1
Swiss Paraplegic Research (SPF), Nottwil, Switzerland
Full list of author information is available at the end of the article
Geyh et al. Health and Quality of Life Outcomes 2010, 8:94
/>© 2010 Geyh et al; licensee BioMed Central Ltd. This is an Open Access article distributed under the terms of the Creative Commons
Attribution License (http://creativec ommons.or g/licenses/by/2.0), which permits unrestricted use, distribution, and reproduction in
any medium, provided the original work is properly cited.
hand, describes difficulties caused by poor health on
mental and physical functioning, task perfor mance, par-
ticipation in life areas, or “health status” [8,9]. SWB on
the other han d, includes overall life satisfaction, satisfac-
tion with life domains, as well as positive and negative
affect [10]. Life satisfaction is traditionally viewed as a
cognitive, needs-based approach towards QoL. It refers
to the individual’ s personal evaluation of the gap
between his or her aspirations and achievements. More
currently, also a cognitive-affective c onceptualization of
satisfaction has been discussed [10,11].
Essentially, life satisfaction is related to the subjective
“insider” perspective and is increasingly considered as a
meaningful and efficient way to collect information
about QoL [12,13]. Assessing QoL of individuals in
health services provision and research complements
measurement that is based on performance, and adds
relevant infor mation for treatment decision-making and
outcome evaluation [6,14].
QoL of persons who sustained spinal cord injury (SCI)
seems to be diminished compared to the general popu-
lation [15,16] QoL appears not to be directly related to
the severity of SCI [16,17], but it is related to perceived
health, participation and integration, to social support
and relationships as well as to living circumstances, e.g.
accessibility or income [15,17].
Several reviews summarized the application and
metric properties of QoL measures in SCI [16,18-20].
Among the various instruments with promising proper-
ties were also short scales, such as the Satisfaction w ith
Life Scale (SWLS) [21], which is part of the United
States SCI Model Systems [22], the Life Satisfaction
Questionnaire (LISAT) [23], or the World Health Orga-
nizationQualityofLifeAssessment (WHOQOL-BREF)
[24].
QoL in persons with SCI has been found to differ
across countries [25,26]. Such differences may be related
to country level factors (e.g. culture and values), to
internal and external individual level factors (e.g. per-
sonality, self-esteem or social support), as well as their
interactions (e.g. social desirability) [27]. Differences
found in these studies m ay reflect the properties of the
measurement instruments used.
The comparability of measurement results between
countries depends on the cross-cultural validity of the
applied instruments [28]. Common steps in various
guidelines for cross-cultural adaptation of QoL instru-
ment include systematic translation procedures and
cross-cultural testing of psychometric properties [29].
There have been efforts to develop and/or validate QoL
instruments cross-culturally (e.g. the WHOQoL-devel-
opmentortheInternationalQualityofLifeAssessment
project) [30,31]. However, the cross-cultural validity and
international c omparability of QoL measurement is not
well established in SCI.
Psychometric properties, like reliability, validity, etc.
can be examined using different techniques. Currently,
Rasch-based methods are becoming increasingly popular
in the context of rehabilit ation outcome measurement
[32]. They are used to create interval scale measure-
ment, can reveal metric difficulties of the measures, but
also provide techniques to account for them at a statisti-
cal level in certain circumstances, for example, by item
reduction, collapsing response scale options, s plitting
items, etc. Thus, Rasch-based methods have also been
used to examine and account for cross-cultural bias in
outcome measures [33,34].
The objective of this study is to examine the cross-
cultural validity of selected QoL scales across countries
in a sample of persons with SCI using Rasch analysis.
The specific aims are (1) to examine and compare mea-
surement properties of the instruments, namely, dimen-
sionality, response scale structure, and reliability; (2) to
examine the validity of the instruments across countries;
and (3) to examine possibilities to enhance the measure-
ment properties and the cross-cultural validity o f the
instruments.
Methods
Design and setting
This cross-sectional multi-centre study was conducted
as a nested project within the international collaborative
development of the “ ICF Core Sets for Spinal Cord
Injury” [35,36 ]. For the current analyses, data from par-
ticipating study centers in Australia, Brazil, Canada,
Israel, South Africa, and the United States are used.
Participants and data collection
Subjects were recruited through the six participating
rehabilitation facilities. Patients were recruited w ho had
sustained a SCI with an acute onset and who were at
least 18 years old. Acute onset was defined as a trauma
or non-trauma tic event resulting in spinal cord dysfunc-
tion within 14 days of onset. Subjects with significant
traumatic brain injury or diagnosed mental disorders
prior to SCI were excluded. Prior to data collection par-
ticipants were informed about the purpose and reason
of the study and signed an informed consent.
For the purpose of the analyses presented in this paper
data from outpatients were selected. In four of the parti-
cipating centers data were also collected f or inpatients.
Overall, 109 inpatient data sets were av ailabl e; however,
76% of these were from one country only (Israel). Thus,
to avoid confounding of country with care setting, and to
obta in a more homogeneous data set for the cross-coun-
try comparisons, the inpatient data were omitted.
Geyh et al. Health and Quality of Life Outcomes 2010, 8:94
/>Page 2 of 16
The data collection included, beside socio-demo-
graphic and injury related variables, four QoL measures:
The Satisfaction with Life Scale (SWLS) [21], the Life
Satisfaction Questionnaire-9 (LISAT-9) [23], the Perso-
nal Well-Being Index (PWI) [37] and five satisfaction
items from the World Health Organization Quality of
Life Assessment (WHOQOL-5) [24,38]. For the data
collection, instruments were selected that include less
than 10 ite ms, focus on the concepts of life and domain
satisfaction, and contain items that are applicable and
not offensive to people with S CI (do not contain items
on walking, kneeling, bending, etc.). In addition, psycho-
metric properties and the availability of different lan-
guage versions w ere considered. Short questionnaires
are more feasible, acceptable, and impose less burden
on the patients compared to longer instruments. They
can be more easily embedded into routine clinical
assessments or larger scale data collection schemes.
Instruments were chosen with a focus on the aspect of
satisfaction within the broader notion of QoL, as satis-
faction is not only conceptually well-defined, but has
also been traditio nally considered as a clinically relevant
person-centered outcome in rehabilitation [39].
In Australia, Canada, South Africa, and the United
States the English versions of the instruments were
used. For the SWLS and the WHOQOL also the Portu-
guese (Brazil) and the Hebrew (Israel) versions exist.
However, for the LISAT and the PWI translatio ns were
not available in Brazil and Israel. In the se cases, transla-
tions of the English version were prepared at the partici-
pating facilities.
Satisfaction with Life Scale
The SWLS was designed to assess global life satisfac-
tion. It addresses the cognitive evaluation of one ’sown
life in terms of ideal life, wish for change, and c urrent
and past satisfaction. The S WLS consists of five items
with a 7-point Likert-scale from “ strongly disagree” to
“ strongly agree” . Reliability and vali dity of the scale
have been examined in several s tudies [21,40,41] also
for various translations and in different countries
[42,43]. The SWLS has been used in cross-country stu-
dies in the general and student populations [27] and is
also widely used in SCI research, especially in the Uni-
ted States [22,44-49]. Internal consistency coefficients
range between .79 and .89 [40] and several studies
confirmed the single factor structure of the SWLS
[21,41-43,50]. However, studies in SCI scarcely
reported about the psychometric properties of the
instrument [47]. Two studies comparing general popu-
lation samples in the United States and Russia [51],
Norway and Greenland [52], respectively, hinted at
potential cross-cultural biases affecting the interpreta-
tion of the SWLS.
Life Satisfaction Questionnaire
The LISAT-9 is a measure of d omain-specific life satis-
faction. It consists of nine items including one on gen-
eral life satisfaction and eight domain-specific items
(self-care, vocational, financial, leisure situation, sexual
life, partner relationship, family life, social contacts).
Responses are rated along a 6-point scale from “ve ry
dissatisfying” to “very satisfying”. Among the psycho-
metric properties of the LISAT, internal consistency and
factorial structure are reported in the literature
[23,53,54]. A 3-factor has b een shown for the LISAT-9
and a 4-factor structure for the LISAT-11 with internal
consistency reliability of the factors between .57 and .79
(over all .85) [23,53]. Thus, analyses using the LISAT are
frequently done item-wise, but also using mean or med-
ian of the scores. The instrument has been widely used
in SCI research, mainly in Europe [25,54-59], little is
known about the measur ement properties of the LISAT
in non-European countries, and only few studies have
addressed the psychometric properties of the LISAT in
the SCI population [54] The LISAT has also been used
to compare SCI samples across countries (Sweden and
Japan; China and UK; UK, Germany, Aus tria, and Swit-
zerland), however, without considering potential cross-
cultural validity issues [25,26,58].
Personal Well-Being Index
The PWI consists of 7 items about satisfaction with spe-
cific life domains (living standard, health, achievement,
relationships, safety, community, future security) and
one optional item about overall life satisfaction.
Responses are provided on a 0-10 numeric rating scale
with the end points “completely dissatisfied” to “comple-
tely satisfied”. The PW I has b een developed in Australia
for use in national surveys [60] and has been adapted
for international use [37]. Validity and reliability of the
PWI have been demonstrated in general population
samples from d ifferent countries [37,60-62]. The PWI
has been designed as a unidimensional tool with internal
consistencies between .70 and .85. Although already
used in various countries (Australia, Hong Kong/China,
Algeria), a rigorous examination of cros s-cultural valid-
ity has not yet been conducted. The PWI has not been
used with persons with SCI so far.
World Health Organization Quality of Life Assessment-5
The WHOQOL-5 is a selection of five satisfaction items
out of the World Health Organization’ sshorthealth-
related quality of life measure, the WHOQOL-BREF.
The 5 items cover overall quality of life, satisfaction
with health, daily activities, relationships, and living con-
ditions. The WHOQOL and WHOQOL-BREF were spe-
cifically developed for cross-cultural use and are
currently available in 36 languages. Psychometric
Geyh et al. Health and Quality of Life Outcomes 2010, 8:94
/>Page 3 of 16
properties have been examined in 23 countries with
samples of sick and healthy persons [24,38,63], with
internal consistency coefficients lying between .75 and
.87. The WHOQOL-BREF has also been applied in peo-
ple with SCI [64,65]. A selection of 8 items out of the
WHOQOL-BREF (including the 5 items in this study)
was used in the EUROHIS project across 10 European
countries and showed satisfactory psychometric proper-
ties, unidimensionality and cross-cultural validity
[66,67]. The 5-item version has been used in diff erent
international WHO collaboration pro jects since 2002
[35,68,69], but has not been psychometrically tested pre-
viously in this format.
Ethics committee approval
The study was carried out in compliance with the Hel-
sinki Declaration, the design and materials were
approved by the Ethics Committee of the Ludwig-Maxi-
milian University Munich, as well as by the respective
Ethics Committees for the study centers in each world
region.
Rasch Analyses
Rasch analyses were carried out using the RUMM soft-
ware [70] and applying the partial credit Rasch model
[71]. This model is a special case of the one-parameter
Rasch model. In the field of Rasch-based or item
response modeling further types of models exist, e.g.
two- or three-parameter item response models, non-
parametric Mokken analyses, or mixed Rasch models,
etc. The use of these models might result in better fit of
the data, as they consider varying item difficulty curves,
varying homogeneity or monotonicity of the data, or
multiple latent classes within the sample populatio ns.
However, the one-parameter Rasch model is especially
helpful for developing precise and accurate measure-
ment instruments, as it imposes strict requirements on
the items and is not data-driven. It can ensure through
its mathematical formulation fundamental measurement
in the tradition of Guttman’s work within a probabilistic
framework [72,73].
Applying this type of Rasch analysis, three paramet ers
are estimated: The person parameters (for the patie nts),
the item parameters, and the parameters of the thresh-
olds of the response scale (e.g. four threshold para-
meters for a 5-point Likert-scale). These parameters
describe the positio n of the persons, items and thresh-
olds on the unidimensional continuum of the measured
latent trait (e.g., low to high quality of life).
First, the unidimensionality of each instrument was
examined. Unidimensionality describes the idea that
items should contribute to the measurement of only one
attribute at a time and should not be confounded by
other attributes or dimensions [73]. This ensures the
interpretability of the summary scores of the instrument.
Unidimensionality can be checked for by comparing the
observed responses in a set of items to the expected
values predicted by the unidimensional Rasch model
[74]. The fit of each item is indicated by standardized
residuals (z values) and Chi
2
test results. Z values
exceeding +/-2.5 are considered to indicate misfit to the
Rasch model [74]. For the Chi
2
significance tests a Bon-
ferroni-corrected critical p-value at the 5% level [75]
was applied.
To further examine unidimensionality, principal com-
ponents analyses (PCA) of the residu als not explained
by the Rasch-model were performed. The residuals
should show a random pattern to indicate unidimen-
sionality [76]. Given the sample size in this study, eigen-
values below 1.9 in the PCA results are indicative of
random residual variation, eigenvalues above 1.9 indicate
some structure in the residuals [77]. In addition, the
Rasch person parameters of each patient were estimated
separately for the items with positive versus negative
loadings on the first PCA factor, and then compared
using independ ent t-tests. The percentage of significant
t-tests (a = 0.05) should not exceed 5% [78,79].
The structure of the response scale for each instru-
ment was studied based on the ordering of the threshold
parameters. The threshol d parameters should take
increasing values, as they represent the successive transi-
tion points along the response scale from low to high
quality of life. Reversed thresholds show that the scores
do not differentiate as intended [80].
Reliability is indicated by the person reliability index,
which i s the Rasch-based correspondent to Cronbach’s
alpha [71,81]. The person reliability index is constructed
using the person parameter estimates and the standard
errors of measurement to calculate the ratio of true per-
son ability variance to the observed variance [74,82]. It
ranges between 0 and 1, where the value of 1 indicates
perfect reproducibility of person placements on the
latent continuum.
To examine the cross-cultural validity of the four
instruments across countries, differential item function-
ing (DIF) analyses were conducted [33]. Potential DIF is
ascertained for each item by comparing the standardized
residuals between the countries and across the latent
trait continuum of QoL using a two-way analysis of var-
iance (ANOVA). A significant main effect of the country
(uniform DIF) or a significant inter action effect in the
ANOVA results (e.g. Country × QoL, non-uniform DIF)
indicates problems with the cross-country comparability
of the responses. If no DIF is apparent, the scores are
comparable across countries. A respective Bonferroni-
corrected type I error level was applied [75]. Tukey-Cra-
mer post-hoc tests allowed identifying the countries that
contribute to DIF in the data.
Geyh et al. Health and Quality of Life Outcomes 2010, 8:94
/>Page 4 of 16
Based on the results of Rasch analyses different
approaches can be taken to account for weaknesses in
the metric properties of the instruments post-hoc. To
come up with suggestions to enhance the measurement
properties and cross-cultural validity of the instruments
across countries, four alternative strategies of handling
the data set were tested and compared. As a result, for
each instrument an optimal solution for handling t he
data could be identified, which allows for acc eptable
measurement properties with as little change to the
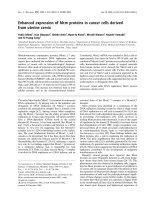
instrument as possible. Figure 1 gives an overview of the
four strategies implemented in the post-hoc analyses.
In the first strategy, response scale disorder was
addressed first. Disordered response categories were col-
lapsed, i.e. adjacent response options were merged and
the scores recoded for all items of the instrument if
more than half of the items showed disorder [80]. In
addition, items that still misfitted after the collapsing,
were deleted using a step-wise top-down deletion strat-
egy until the remaining items fit the model [83].
In the second strategy, item misfit was attended to
first by using the step-wise top-down deletion strategy
and the remaining fitting items are checked again for
response scale disorder.
The third strategy focused on accounting for DIF. So-
called subtest analyses were conducted, which were used
to merge the scores of those items that display DIF for
country. Thereby, if two items of an instrument show
DIF but in opposite directions, they can be combined
into one score, which adjusts for invariance across coun-
tries. The advantage of this strategy-if it is successful in
ameliorating DIF-is that no changes to the items are
necessary and the summary score of the instrument can
be interpreted as comparable across countries.
The fourth strategy also addressed DIF, but applied
the subtest analyses to either option one or option two,
depending on which of the two represented the most
effective strategy for the instrument so far (i.e. enhanced
statistics with less change).
The strategies one to three were calcula ted for all
four instruments (according to the properties in the
basic analyses), and after e ach step, the overall and
item fit, DIF, response scale ordering, and reliability
were documented. The fourth strategy was only
applied, if the first three did not result in acceptable
metric properties.
The efficiency of the different strategies was deter-
mined by the metric properties on the one side and the
modifications to the i nstrument on the other side.
Hereby, the metric properties were considered hierarchi-
cal in terms of desirability: Item and overall fit were
considered the most important criteria to be fulfilled
first, DIF as second, and response scale ordering as the
third criterion. Regarding the modifications to the
instruments, the merging strategy was considered the
least invasive strategy, as it does not require changes to
the items or the response scale. Collapsing of response
options was considered the second least invasive strat-
egy, as it requires the recoding of responses, but no
changes to the items. Deleti on of items was considered
an invasive strategy, as it alters the instrument from its
original version.
Post-hoc strategies to account for weaknesses in
the metric properties of the instruments
Strategy 1 Strategy 3 Strategy 4
Collapse disordered
response categories if more
than 50% of the items show
disorder
Strategy 2
Delete misfitting items,
starting with the least-fitting
item (top-down)
Merge items showing
uniform DIF using subtest
analysis (equaling out
opposing effects)
Select the more efficient
solution from either strategy
1 or 2, if items still show
uniform DIF
Collapse disordered
response categories if more
than 50% of the items show
disorder
Delete misfitting items,
starting with the least-fitting
item (top-down)
Merge items showing
uniform DIF using subtest
analysis (equaling out
opposing effects)
Figure 1 Overview of the four Rasch-based strategies applied to account for the weaknesses in the metric properties of the four
quality of life instruments post-hoc.
Geyh et al. Health and Quality of Life Outcomes 2010, 8:94
/>Page 5 of 16
Thus, if for example the strategies one to three all
resulted in acceptable metric properties in terms of fit,
DIF, and response scale ordering, then the merging
strategy three would be preferred as optimum solution,
for being least invasive.
Results
From six countries and four different world regions,
overall, 243 out-patients with SCI were included in the
study. Table 1 shows the socio-demographic and SCI-
related characteristics of the study sample. Table 2
shows the mean raw scores, respective standard devia-
tions, and the number of valid responses in the four
instruments overall, per item, and per country.
Statistics for the examined measurement properties of
the 4 instruments are documented in Table 3. The
SWLS showed overall misfit to the Rasch model accord-
ing to the significant Chi
2
test and the PCA eigenvalue.
At the item level, 3 out of 5 items showed misfit to the
model. In terms of response scale structure, 3 out of 5
items had disordered thresholds. Reliability was high
with a value of 0.88.
For the LISAT-9, the overall fit statistics (i.e. Chi
2
test,
PCA eigenvalue, and independent t-test approach) con-
sistently contradict the assumption of unidimensionality.
At item level, 3 items out of 9 showed misfit to the
Rasch model. In 5 items the response scale thresholds
were disordered. The person reliability index was high
with a value of 0.86.
For the PWI the Chi
2
statistics suggested unidimen-
sionality overall as well as for the individual items. How-
ever, the eigenvalue and the t-test approach questioned
the assumption of unidimensionality of the instrument.
The response scale thres holds were all ordered with the
exception of 1 item out of the 8. Reliability was found
high with a value of 0.92.
For the WHOQoL-5 all overall statistics confirmed
unidimensionality, but one of the items misfitted the
model according to the significant Chi
2
test result. All
response scale thresholds were ordered and reliability
was within an acceptable range with a value of 0.78.
The results of the DIF analyses to examine the cross-
cultural validity of the 4 instruments are displayed in
Table 4. Uniform DIF across countries was found in two
items of the SWLS and the WHOQoL-5, three items of
the LISAT-9 and four items of the PWI. Non-uniform
DIF was found only in the item “Leisure situation” of
the LISAT-9 (data not shown). For the SWLS and the
LISAT-9 the data from Israel showed most frequently
significant differences from the other countries. For the
PWI, the data from Australia and Canada showed most
frequently signif icant differences to other count ries. For
the WHOQoL-5 this was the case for the data from
Canada (data for post-hoc tests not shown).
Table 5 shows the statistics about instrument and
item fit, response scale structure, and reliability for the
4 different strategies applied to enhance the measure-
ment properties and the cross-cultural validity of the 4
instruments. Also, Table 4 contains the results of the
final check f or DIF after having identified the optimal
option for handling the data.
Table 1 Socio-demographic and spinal cord injury related
patient characteristics (N = 243)
Variable Descriptive statistics
Socio-demographic characteristics
Years of age
mean (SD) 41.4 (13.6)
Gender
% male 79.4
Marital status
% never married 41.6
% currently married or cohabiting 39.9
% separated, divorced, widowed 18.0
Years of education
mean (SD) 13.0 (4.0)
Current occupational situation
% paid work, self-employed 33.7
% unemployed for health reasons 33.3
% retired 11.5
% other (student, house-maker, etc.) 21.5
Spinal cord injury characteristics
Etiology
% sport 9.1
% assault 6.2
% transport 35.0
% fall 11.9
% other traumatic 20.6
% non-traumatic 7.0
% unspecified 10.3
Level of injury
% paraplegia 45.7
Completeness of injury
% complete (A) 47.7
% incomplete (B-D) 43.6
% unspecified 8.6
Time since onset in months
mean (SD) 139.6 (138.8)
median (IQR) 86.1 (175.1)
Geyh et al. Health and Quality of Life Outcomes 2010, 8:94
/>Page 6 of 16
Strategy 2 was regarded as the optimum choice for the
SWLS. Two misfitting items were deleted using the
step-wise data purification procedure. With this hand-
ling of the data, it em fit and response scale order were
achieved, and no DIF was apparent.
Strategy 4 was regarded the optimum choice for hand-
ling the data for the LISAT-9. Only after collapsing the
response options, deleting two misfitting items and mer-
ging another two items with DIF were all the remaining
items fitting, the response scale thresholds ordered (with
one exception), and DIF not present.
Strategy 3 appeared the optimum choice for the PWI.
The scores of the four items that displayed DIF prior to
applying any post-hoc strategies were merged into two
items, which lead to no item misfit and no response
scale disorder. However, one of the merged items
remained inconsistent across countries and displayed
DIF.
Table 2 Raw scores for the four instruments overall and by country
Items ALL AUS BRZ CAN ISR RSA USA
N m sd n m sd n m sd n m sd n m sd n m sd n m sd
SWLS
Sum score 243 18.2 7.4 40 17.2 6.0 34 17.3 7.5 34 20.2 7.7 71 19.3 7.1 30 14.1 6.7 34 19.6 8.5
Ideal life 243 3.3 1.9 40 2.9 1.4 34 3.5 1.8 34 4.1 2.1 71 3.3 1.8 30 2.5 1.7 34 3.6 2.2
Life conditions 243 3.5 1.9 40 3.4 1.5 34 3.7 1.7 34 4.2 2.0 71 3.5 1.9 30 2.7 1.8 34 3.7 2.2
Life satisfaction 243 4.0 1.9 40 4.1 1.4 34 3.7 2.0 34 4.4 2.0 71 3.9 1.9 30 3.6 1.9 34 4.3 2.1
Got things I want 243 3.9 1.8 40 4.0 1.4 34 3.5 2.0 34 4.6 1.7 71 3.8 1.8 30 3.0 1.4 34 4.4 1.8
Change nothing in life 243 3.5 1.9 40 2.9 1.4 34 2.9 1.8 34 3.0 1.7 71 4.8 1.9 30 2.3 1.3 34 3.5 2.0
LISAT-9
Sum score 243 31.6 9.4 40 40.0 17.2 34 31.4 9.8 34 34.8 9.9 71 31.5 9.5 30 27.1 7.8 34 34.1 10.3
Life as a whole 243 3.9 1.3 40 4.0 0.9 34 3.6 1.3 34 4.2 1.3 71 3.9 1.4 30 3.4 1.2 34 4.4 1.2
Self care 243 3.5 1.7 40 2.6 1.4 34 3.5 1.7 34 4.2 1.6 71 3.5 1.6 30 3.1 1.6 34 4.0 1.8
Vocational situation 240 3.4 1.6 40 3.0 1.3 34 3.3 1.5 33 4.1 1.5 70 3.1 1.9 30 3.2 1.2 33 3.8 1.8
Financial situation 243 3.3 1.5 40 2.8 1.1 34 2.9 1.5 34 3.9 1.2 71 3.9 1.6 30 2.5 1.2 34 3.4 1.8
Leisure situation 243 3.4 1.5 40 3.9 0.9 34 2.9 1.3 34 3.8 1.4 71 3.1 1.8 30 3.5 1.3 34 3.6 1.5
Sexual life 237 2.5 1.5 38 2.5 1.4 33 2.5 1.5 32 3.0 1.7 71 2.2 1.6 30 2.2 1.3 33 3.0 1.6
Partner relations 139 4.5 1.6 18 4.7 1.7 25 4.8 1.2 18 4.5 1.7 51 4.0 1.8 8 4.3 1.4 19 5.1 1.1
Family life 242 4.6 1.3 40 5.0 0.8 34 4.7 1.1 33 4.8 1.3 71 4.4 1.5 30 3.7 1.3 34 4.8 1.1
Contact with friends 240 4.6 1.2 38 4.8 0.9 34 4.4 1.2 34 4.7 1.2 71 4.6 1.4 30 4.4 1.1 33 4.6 1.1
PWI
Sum score 242 48.3 15.6 40 43.4 10.9 34 46.9 14.9 33 53.9 14.7 71 47.3 17.5 30 48.9 11.3 34 51.5 18.7
Whole life 242 5.8 2.4 40 5.5 1.8 34 5.8 2.2 33 6.7 2.6 71 5.7 2.6 30 5.1 2.6 34 6.2 2.6
Living standard 242 6.0 2.4 40 5.6 1.9 34 5.3 1.9 33 6.8 2.4 71 6.1 2.5 30 6.1 2.6 34 6.4 2.8
Health 242 5.4 2.6 40 4.3 2.1 34 6.4 2.2 33 5.1 2.9 71 4.9 2.6 30 6.4 2.5 34 6.3 2.4
Life achievement 242 6.1 2.4 40 5.9 1.9 34 5.7 2.3 33 6.5 2.2 71 6.2 2.5 30 6.1 2.3 34 5.8 3.3
Relationships 241 7.0 2.2 40 7.1 1.6 33 7.1 2.3 33 7.1 2.1 71 7.1 2.2 30 6.7 2.2 34 6.6 3.1
Feeling safe 242 6.3 2.7 40 5.1 1.9 34 5.6 2.5 33 7.7 2.4 71 6.1 3.0 30 6.7 2.0 34 7.2 2.8
Feel part of community 242 6.2 2.4 40 6.0 1.3 34 6.1 2.3 33 7.3 1.8 71 5.7 2.8 30 6.0 2.4 34 6.7 2.8
Future security 242 5.5 2.6 40 4.0 2.0 34 5.6 2.3 33 6.7 2.4 71 5.5 2.8 30 5.6 2.3 34 6.3 2.7
WHOQoL-5
Sum score 243 18.2 7.4 40 17.2 6.0 34 17.3 7.5 34 20.2 7.7 71 19.3 7.1 30 14.1 6.7 34 19.6 8.5
Health 243 3.3 1.0 40 3.1 0.9 34 3.2 1.0 34 3.1 1.1 71 3.1 1.1 30 3.7 0.7 34 3.5 1.0
Activities of daily living 242 3.1 1.1 40 2.8 1.0 34 2.8 1.1 34 3.1 1.2 71 3.1 1.2 30 3.5 1.0 33 3.5 0.9
Relationships 242 3.7 1.0 39 3.9 0.7 34 3.5 0.9 34 3.7 1.1 71 3.5 1.0 30 3.5 1.0 34 3.8 1.1
Living place 243 3.7 1.1 40 3.6 0.8 34 3.1 1.0 34 4.1 1.1 71 3.8 1.2 30 3.6 1.1 34 4.1 1.1
Quality of life 243 3.6 1.0 40 3.5 0.8 34 3.3 0.9 34 4.0 1.0 71 3.3 1.0 30 3.5 0.9 34 3.9 0.9
Abbreviations: SWLS: Satisfaction with life scale; LISAT: Life satisfaction questionnaire; PWI: Personal well-being index; WHOQoL: World Health Organization quality
of life assessment; AUS: Australia; BRZ: Brazil; CAN: Canada; ISR: Israel; RSA: Republic of South-Africa; USA: United States of America; n: sample size; m: mean raw
score; sd: standard deviation of the raw score.
Geyh et al. Health and Quality of Life Outcomes 2010, 8:94
/>Page 7 of 16
Table 3 Rasch-based fit statistics, ordering of the response scale thresholds, and reliability (n = 243)
Items δ SE z Chi
2
df p PCA eigen-value t-test
%
τ r
SWLS
Overall 78.54 10 0.000
b
1.97
c
3.3 7-steps
scale
0.88
Ideal life 0.35 0.05 -2.22 13.22 2 0.001
b
disord
Life conditions 0.15 0.05 -1.70 15.10 2 0.001
b
ord
Life satisfaction -0.15 0.05 -1.13 7.21 2 0.027 ord
Got things I want -0.25 0.06 0.37 3.10 2 0.212 disord
Change nothing in life -0.11 0.05 6.41
a
39.90 2 0.000
b
disord
LISAT-9
Overall 50.60 18 0.000
b
2.06
c
7.4
d
6-step
scale
0.86
Life as a whole -0.13 0.07 -2.04 19.15 2 0.000
b
ord
Self care 0.08 0.05 0.60 1.16 2 0.561 ord
Vocational situation 0.26 0.06 -0.63 2.65 2 0.266 disord
Financial situation 0.19 0.06 1.43 0.22 2 0.897 ord
Leisure situation 0.34 0.06 -0.78 5.45 2 0.066 ord
Sexual life 0.97 0.06 -0.18 1.42 2 0.491 disord
Partner relations -0.30 0.07 2.70
a
11.20 2 0.004
b
disord
Family life -0.58 0.06 2.59
a
8.23 2 0.016 disord
Contact with friends -0.82 0.07 0.11 1.13 2 0.569 disord
PWI
Overall 15.62 16 0.480 1.96
c
8.7
d
11-steps
scale
0.92
Whole life 0.13 0.04 -1.25 5.12 2 0.077 ord
Living standard 0.02 0.04 1.07 1.56 2 0.457 ord
Health 0.20 0.04 3.14
a
2.35 2 0.309 ord
Life achievement 0.05 0.04 1.04 0.62 2 0.735 ord
Relationships -0.35 0.04 1.63 1.39 2 0.499 ord
Feeling safe -0.11 0.04 -1.44 1.84 2 0.399 ord
Feel part of community -0.09 0.04 -0.04 0.39 2 0.824 disord
Future security 0.14 0.04 -1.11 2.35 2 0.309 ord
WHOQoL-5
Overall 16.43 10 0.088 1.81 3.3 5-steps
scale
0.78
Health 0.30 0.09 0.32 1.49 2 0.475 ord
Activities of daily living 0.68 0.08 -0.29 0.94 2 0.627 ord
Relationships -0.37 0.09 1.67 2.04 2 0.361 ord
Living place -0.26 0.08 2.05 1.57 2 0.456 ord
Quality of life -0.36 0.09 -1.83 10.40 2 0.005
b
ord
Index:
a: Exceeds the critical value of z > +/-2.5
b: Below the Bonferroni corrected probability level of p < 0.05/number of items (SWLS and PWI: p < 0.01; LISAT and PWI: p < 0.006)
c: Exceeds the decision level for chance distribution of residuals with eigenvalue > 1.9
d: Exceeds the 5% boundary for the number of significant independent t-tests based on the PCA results
Abbreviations:
SWLS: Satisfaction with life scale; LISAT: Life satisfaction questionnaire; PWI: Personal well-being index; WHOQoL: World Health Organization quality of life
assessment; δ: Item location in logits (delta); SE: Standard error of item location; z: Standard normal distributed test value z; df: Degrees of freedom; p:
Probability; PCA: Principal components analysis; t-test %: Percentage of significant independent t-tests; τ: Ordering of the response scale thresholds (tau); r:
Person reliability index.
Geyh et al. Health and Quality of Life Outcomes 2010, 8:94
/>Page 8 of 16
Strategy 3 was also the optimum choice for the
WHOQoL-5. After merging the scores of those two
items which initially indicated DIF, all items fitted the
Rasch model, the response scale thresholds were
ordered, and no DIF was found.
Discussion
The study examined the metric properties of the Satis-
faction with Life Scale (SWLS), the Life Satisfaction
Questionnaire (LISAT), the Personal Well-Being Index
(PWI) and the 5-item World Health Organization
Table 4 DIF across countries prior to and after applying the post-hoc strategies (n = 243)
Items Prior modification After modification
MS F df p MS F df p
SWLS Strategy 2
Ideal life 1.72 3.36 5 0.006 0.86 1.47 5 0.202
Life conditions 1.54 2.74 5 0.020 0.58 0.88 5 0.494
Life satisfaction 1.64 2.70 5 0.022 1.55 2.26 5 0.050
Got things I want 3.03 4.01 5 0.002
b
deleted
Change nothing in life 15.15 11.20 5 0.000
b
deleted
LISAT-9 Strategy 4
Life as a whole 1.45 2.35 5 0.042 0.76 1.15 5 0.333
Self care 3.23 3.64 5 0.004
b
2.43 2.85 5 0.016
Vocational situation 1.34 1.67 5 0.142 0.97 1.37 5 0.237
Financial situation 7.13 8.08 5 0.000
b
merged
Leisure situation 4.17 6.64 5 0.000
b
merged
Sexual life 0.87 1.04 5 0.3959 2.01 1.90 5 0.095
Partner relations 2.27 1.65 5 0.1513 deleted
Family life 3.74 3.38 5 0.0058 deleted
Contact with friends 0.72 0.80 5 0.5485 2.21 2.05 5 0.073
Merged item 4 and 5 1.19 1.90 5 0.095
PWI Strategy 3
Whole life 1.80 2.59 5 0.027 1.783 2.53 5 0.030
Living standard 2.08 2.28 5 0.048 2.094 2.25 5 0.051
Health 9.22 9.59 5 0.000
b
merged
Life achievement 1.72 1.80 5 0.114 1.792 1.84 5 0.106
Relationships 4.44 4.65 5 0.001
b
merged
Feeling safe 3.80 5.63 5 0.000
b
merged
Feel part of community 1.82 2.20 5 0.055 1.811 2.16 5 0.060
Future security 2.77 3.88 5 0.002
b
merged
Merged item 3 and 8 6.683 9.05 5 0.000
b
Merged item 5 and 6 0.286 0.39 5 0.858
WHOQoL-5 Strategy 3
Health 2.90 3.85 5 0.002
b
merged
Activities of daily living 1.50 2.04 5 0.075 1.41 2.04 5 0.074
Relationships 2.32 2.50 5 0.031 2.14 2.46 5 0.034
Living place 2.97 2.99 5 0.012 2.69 2.89 5 0.015
Quality of life 2.36 4.13 5 0.001
b
merged
Merged item 1 and 5 0.80 1.47 5 0.200
Index:
b: Below the Bonferroni corrected probability level of p < 0.05/number of items (SWLS and PWI: p < 0.01; LISAT and PWI: p < 0.006)
Abbreviations:
SWLS: Satisfaction with life scale; LISAT: Life satisfaction questionnaire; PWI: Personal well-being index; WHOQoL: World Health Organization quality of life
assessment; DIF: Differential item functioning; MS: Mean square sum of residuals; F: F-distributed test value; df: Degrees of freedom; p: probability
Geyh et al. Health and Quality of Life Outcomes 2010, 8:94
/>Page 9 of 16
Table 5 Rasch-based statistics for the different strategies applied to enhance the metric properties of the instruments (n = 243)
Items Strategy 1:
Collapsing response
scale
Strategy 2:
Deleting misfitting
items
Strategy 3:
Merging DIF
items
Strategy 4:
Merging DIF items
(Option 1 or 2)
δ SE τ zprδ SE τ zprδ SE τ zprδ SE τ zpr
SWLS recoding: 0 1 12234 no DIF in selected option
Overall 0.990 0.87 0.250 0.90 0.000
b
0.89
Ideal life 0.48 0.11 ord -0.83 0.811 0.39 0.07 disord -0.88 0.119 0.32 0.06 ord -1.11 0.014
Life conditions 0.077 0.11 ord 0.08 0.910 0.06 0.07 ord -0.43 0.220 0.11 0.06 ord -0.56 0.006
b
Life satisfaction -0.56 0.11 ord 0.75 0.870 -0.45 0.07 ord 0.43 0.758 -0.24 0.06 ord 0.07 0.165
Got things I want del del merg
Change nothing in life del del merg
Merged item 4. and 5. -0.19 0.04 ord 2.67
a
0.038
LiSAT recoding: 0 1 1123 recoding: 011123
Overall 0.074 0.81 0.106 0.80 0.000
b
0.86 0.125 0.81
Life as a whole -0.44 0.12 ord -1.72 0.022 del -0.08 0.07 ord -1.96 0.000
b
-0.35 0.122 ord -1.38 0.037
Self care -0.08 0.10 ord 0.32 0.739 -0.08 0.06 ord 1.69 0.558 0.12 0.05 ord 0.68 0.626 0.00 0.098 ord 0.65 0.671
Vocational situation 0.27 0.10 ord -1.82 0.382 0.10 0.06 disord 0.25 0.125 0.30 0.06 disord -0.55 0.321 0.34 0.105 ord -1.35 0.454
Financial situation 0.12 0.11 ord 0.53 0.305 del merg merg
Leisure situation 0.41 0.11 ord -1.55 0.279 0.18 0.06 ord -1.22 0.014 merg merg
Sexual life 1.39 0.11 ord 1.93 0.055 0.86 0.06 disord 0.50 0.777 0.995 0.06 disord -0.11 0.476 1.45 0.112 ord 2.23 0.049
Partner relations del del -0.27 0.07 disord 2.77
a
0.008 del
Family life del del -0.53 0.06 disord 2.74
a
0.021 del
Contact with friends -1.67 0.11 ord 1.97 0.517 -1.06 0.07 disord 0.58 0.481 -0.77 0.07 disord 0.15 0.562 -1.63 0.110 ord 2.37 0.427
Merged item 4. and 5. 0.24 0.04 ord -1.66 0.279 0.18 0.078 disord -2.25 0.616
PWI no recoding (one item disordered)
Overall 0.346 0.92 0.710 0.92
Whole life 0.17 0.04 ord 0.26 0.250 0.11 0.04 ord -0.70 0.121
Living standard 0.06 0.04 ord 0.97 0.050 0.00 0.04 ord 1.66 0.427
Health del merg
Life achievement 0.09 0.04 ord 1.28 0.857 0.03 0.04 ord 1.62 0.646
Relationships -0.35 0.04 ord 1.68 0.207 merg
Feeling safe -0.08 0.04 ord -1.04 0.481 merg
Feel part of community -0.06 0.04 disord 0.06 0.598 -0.09 0.041 disord 0.495 0.730
Future security 0.18 0.04 ord -0.46 0.681 merg
Merged item 3. and 8. 0.19 0.03 ord 0.54 0.949
Merged item 5. and 6. -0.23 0.03 ord -1.00 0.501
Geyh et al. Health and Quality of Life Outcomes 2010, 8:94
/>Page 10 of 16
Table 5 Rasch-based statistics for the different strategies applied to enhance the metric properties of the instruments (n = 243) (Continued)
WHOQOL no recoding (no disorder)
Overall 0.340 0.81 0.567 0.76
Health 0.12 0.10 ord 0.15 0.371 merg
Activities of daily living 0.68 0.09 ord -0.30 0.240 0.58 0.08 ord -0.29 0.604
Relationships del -0.41 0.08 ord 1.59 0.582
Living place del -0.34 0.08 ord 1.92 0.475
Quality of life -0.80 0.10 ord 0.07 0.376 merg
Merged item 1. and 5. 0.16 0.06 ord -2.20 0.208
Index:
a: Exceeds the critical value of z > +/-2.5
b: Below the Bonferroni corrected probability level of p < 0.05/number of items (SWLS and PWI: p < 0.01; LISAT and PWI: p < 0.006)
Abbreviations:
SWLS: Satisfaction with life scale; LISAT: Life satisfaction questionnaire; PWI: Personal well-being index; WHOQoL: World Health Organization quality of life assessment; DIF: Differential item functioning; δ: Item
location in logits (delta); SE: Standard error of item location; τ: Ordering of the response scale thresholds (tau); z: Standard normal distributed test value z; p: Probability of the Chi
2
test; r: Person reliability index; del:
Item deleted due to misfit; merg: Item merged due to DIF; ord: Response scale thresholds ordered; disord: Response scale thresholds disordered
Geyh et al. Health and Quality of Life Outcomes 2010, 8:94
/>Page 11 of 16
Quality of Life Assessment (WHOQoL-5) in a cross-
country sample of persons with SCI based on Rasch
analysis. Although all instruments displayed metric pro-
blems in the analyses and showed cross-country bias at
first, it was possible to identify post-hoc strategies to
ameliorate those problems. Such strategies can also be
used in further studies to enhance the metric compar-
ability of data across countries. The two instruments
which performed best overall in this comparison in
terms of reliability, dimensionality, response scale struc-
ture, and cross-cultural validity were the WHOQoL-5
and the PWI, prior as well as after applying the post-
hoc strategies.
Reliability
In the current study, high values of the person reliability
index were found for all four instruments. The person
reliability index was similar for the WHOQoL-5 and for
the SWLS in our study to alpha coefficients reported in
the literature in different samples and countries, includ-
ing also persons with spinal cord injuries
[40,41,43,63,65-67]. However, for the PWI and the
LISAT-9, the reliability index was higher than reliability
measures reported earlier [37,53,54,61,62]. The person
reliabi lity index is the Rasch-based counterpart of Cron-
bach’s alpha. In this study, alpha coefficients could not
be calculated because of missing data. Rasch analysis,
however, not only deals r eadily with missing data [8 4],
but in general the person reliability i ndex can also have
the a dvantage of being a more conservative estimate of
reliability under certain circumstances, e.g. when alpha
may be inflated due to the number of items or the sam-
ple variance [85].
Dimensionality
In line with an earlier study using s tructural equation
modeling [67], unidimensionality can be assumed for
the WHOQoL-5. For the PWI, previous studies indi-
cated unidimensionality, which is partially supported by
the statistics in this analysis [60,62]. Although unlike
previous authors, we included the first overall item in
the analyses [37], in the item-wise examination, this
overall item fitted the model along with the domain-spe-
cific items.
The assumption of unidimensionality was rejected for
the LISAT-9 and the SWLS. Earlier studies, as well as
the findings presented here, suggest that more than one
dimension is assessed by the LISAT [23,53]. In this
study, with deleting the two items “part ner relations”
and “ family life” unidimensionality of the remaining
items was established. The item “partner r elations” had
far more missing data than any of the other items (see
Table 2), which might have caused metric irregularities.
However, the standard error of the estimates was not
larger compared to the other items, indicating accepta-
ble p recision of estimation. How ever, a potential expla-
nation how these two items differ from the others could
lay in the specific meaning of the items in the context
of SCI and in the specific experiences of the affected
persons. While the other items may be related to the
experienced difficulties and problems in body functions,
activities and participation imposed by SCI (e.g. dif ficul-
ties in sexuality, less contact with friends), the partner
and family life items may be related to the more stable,
positive, and support providi ng relationships [86]. Thus,
the difference b etween the separate dimensions identi-
fied in the statistical analyses might be interpreted con-
ceptually as negative versus positive experience,
problems in own functioning versus support by others.
The results regarding the unidimensionality of the
SWLS contradict the findings of s everal earlier studies,
which demonstr ated a single underlying dimension
[21,40-43,47,50]. In this study the last two items (“ If I
couldlivemylifeover,Iwouldchangealmostnothing”
and “So far I have gotten the important things I want in
life”)hadtoberemovedbeforeunidimensionality was
achieved for the remaining three. A study from France
using structural equation modeling found no support
for the unidimensionality of the SWLS in a general
population sample and th e authors proposed to take the
last two items separately [87]. They suggest that the
semantic structure of those two items, which relat e to
the past, may explain the inconsistency among the
items. In the current study the sample consisted of per-
sons who have met with a major life event in the past,
namely SCI. One thing that persons with SCI might
want to change in the past and might be strongly dissa-
tisfied with is the SCI itself [47]. In the context of SCI,
it could be hypothesized that the first items (related to
present life satisfaction) of the SWLS might be con-
nected to acceptance, the last two items t o grief and
regret. These different connotations might explain in
line with the suggestion of Vautier et al. (2004) the
observed inconsistency and disjunction among the items
within the instrument.
Response scale structure
Considering the response scale structure of the instru-
ments, the results suggest that the 5-steps scale of the
WHOQOL-5 (“ very dissatisfied”, “ dissatisfied”“ne ither
satisfied nor dissatisfied”, “satisfied”, “very satisfied”) and
the 11-st eps numeric rating scale of the PWI (“ comple-
tely dissatisfied” to “neutral” to “ completely satisfied”)
have the expected ordering and persons with SCI could
differentiate between the steps consistently when
responding to the items.
FortheSWLSandtheLISATtheresponsescale
structure showed disorder in several items. For the
Geyh et al. Health and Quality of Life Outcomes 2010, 8:94
/>Page 12 of 16
SWLS, after removing the last two items for misfit, only
one disordered item (“ideal life” ) remained. For the
LISAT-9 the original 6-step rating scale was reduced to
a 4-step solution in this study. The optimal solution in
the post-hoc analyses appeared to be the merging of the
response options “ dissatisfying” , “rather dissatisfying”
and “rather satisfying” . This merging of the response
options parallels the cut-off used by Fugl-Meyer to
dichotomize item scores (1-4 = satisfied/5-6 = unsatis-
fied) placing the “rather satisfying” option in the unsatis-
fied category [53]. Accordingly, future studies could test
themetricpropertiesandusefulnessofamodified4-
step scale for the LISAT with a suggested structure as
“very dissatisfying”, “dissatisfying”, “satisfying”, and “very
satisfying”.
Cross-cultural validity
The current findings hint at potential cross-country bias
in all four examined instruments largely in line with
existing research. In the case of the SWLS, two earlier
studies u sing different methodologies found indications
that the comparability and interpretability of the scores
across countries is not c onsistent [51,52], which is now
supported in an SCI sample.
Lau et al (2005) found cross-cultural differences in the
performance of the PWI between an Australian and a
Hong Kong Chinese population and suggested that cul-
tural response bias would be a plausible explanation for
the differenc es [61]. Our results in SCI showed DIF for 4
of the PWI items across the 6 countries, and Australia was
among the countries which showed strongest deviation
from the other five (beside Canada). However, by merging
the scores of those items which had DIF, the deviations
proved to be balanced out. Thus, at the level of the sum-
mary score, cross-country comparability may be possible.
Schmidtetal(2006)examinedDIFfortheEurohis-
QoL-8 instrument, which is a selection of 8 items out of
the WHOQOL-BREF and which includes the 5 items
used in this study [67]. They found acceptable cross-cul-
tural properties in their instrument which is in line with
the findings here for the reduce d 5-item version. Again,
the minor deviation in the first DIF analyses could be
alleviated by merging the two items “health” and “qual-
ity of l ife” to establish cross-country comparability of
the summary score.
Although the LISAT has been used in cross-country
studies [25,26], those did not examine potential bias
between the different language versions of the instru-
ment. In this s tudy, the post-hoc analyses showed that
acceptable metric properties could only be achieved for
the LISAT by applying the whole range of modificatio n
strategies, including the collaps ing of respo nse options,
the deletion of items and the merging of item scores.
Limitations
The study is subject to several methodological limita-
tions. The major drawback of the study is the low sample
size in the individual countries. For this reason certain
statistical techniques for assessing psychometric charac-
teristics and handling DIF could not be applied, e.g. the
item-splitting method suggested by Tennant et al [33].
However, the overall sample size was sufficient to reliably
sustain the performed analyses [88]. According to Linacre
(1994) a sample size of n = 250 is sufficient to achieve
stable item paramete rs. In the current analyses the stabi-
lity of the parameters was high, obvious from the small
standard errors of the item parameters (SE = 0.04-0.09,
see Table 3) . Secondly, as the study included a conveni-
ence sample of pe rsons with SCI, s election bias cannot
be ruled out and the generalizability of the results may be
compromised. Third, the quality of the Portuguese and
Hebrew language versions of the questionnaires were not
tested prior to their use in these data collections. Fourth,
as a more current development, the PWI includes a
further item on spirituality, which was not yet taken up
in the data collections for this study. Fifth, in t hese ana-
lyses, only basic psychometric characteristics (i.e. reliabil-
ity, unidimensionality) were considered, but features like
stability or sensitivity to change were not examined.
Sixth, the DIF analyses only focused on potential cross-
country biases, but were not extended to other factors
that might influence the participants’ responses, e.g.
sociodemographic factors or depression. Finally, the
post-hoc solutions shown i n this study can be considered
“optimum” only in the current sample, and in other s tu-
dies the results may look different. However, we have
shown that using these strategi es data can be handled in
a way that increases the confidence in the metric quality
and interpretability of the data.
Conclusions
The Rasch analyses of the four quality of life instru-
ments showed that the raw scores were not consistently
comparable across countries at first in an international
SCI sample. However, by accounting for DIF across
countries in a way that the requirements of the Rasch
model are met, the scores can become comparable. Fol-
lowing the post-ho c procedures the items of the WHO-
QOL-5andthePWIworkedinaconsistentand
expected way in all countries. Thus, the differences
between countries assessed by these instruments could
potentially show cross-culturally vali d differences in the
responses of the persons. In contrast, summary scores
of the LISAT-9 and the SWLS have to be interpreted
with caution. The findings of the current study can be
especially helpful to s elect instruments for international
research projects in spinal cord injury.
Geyh et al. Health and Quality of Life Outcomes 2010, 8:94
/>Page 13 of 16
Acknowledgements
The project was funded by Swiss Paraplegic Research, Nottwil, Switzerland.
The authors would like to expand a special thanks to the Regional Project
Coordinators Michael Baumberger (European Region), Robert Campbell
(African Region), Susan Charlifue (Region of the Americans), Apichana
Kovindha (South-East Asian Region), Haim Ring† (Eastern Mediterranean
Region), Anne Sinnott (Western Pacific Region), to all health professionals
who were involved in the local study organization or data collection, and to
the staff from the ICF Research Branch in Munich for their contribution
regarding data management. The authors are indebted to all persons with
spinal cord injury, who participated in the study.
Author details
1
Swiss Paraplegic Research (SPF), Nottwil, Switzerland.
2
Department of Health
Sciences and Health Policy, University of Lucerne and SPF, Nottwil,
Switzerland.
3
Seminar for Statistics, Swiss Federal Institute of Technology,
Zurich, Switzerland.
4
Institute of Health and Rehabilitation Sciences, Ludwig
Maximilian University, Munich, Germany.
5
Rehabilitation Centre ‘De
Hoogstraat’ and Rudolf Magnus Institute for Neuroscience, Utrecht, The
Netherlands.
Authors’ contributions
SG contributed to the conception and design of the study, the conception
and interpretation of the statistical analyses, and drafted the manuscript. BF
conducted the statistical analyses, contributed to the interpretation of data,
the drafting and revision of the manuscript. IK contributed to the acquisition
and management of the data and revised the manuscript. MP contributed
to the conception and design of the study, the acquisition of data, the
interpretation of the statistical analyses, and revised the manuscript. All
authors read and approved the final manuscript.
Competing interests
The authors declare that they have no competing interests.
Received: 5 March 2010 Accepted: 3 September 2010
Published: 3 September 2010
References
1. Eurobarometer: Eurobarometer 71. Public opinion in the European Union
Brussels: European Commission 2009.
2. Inglehart R, Foa R, Peterson C, Welzel C: Development, freedom, and
rising happiness. A global perspective (1981-2007). Perspectives on
Psychological Science 2008, 3:264-285.
3. Argyle M: The psychology of happiness Hove: Routledge, 2 2001.
4. Diener E, Suh EM: National differences in subjective well-being. In Well-
being The foundations of hedonic psychology. Edited by: Kahnemann D,
Diener E, Schwarz N. New York: Russell Sage Foundation; 1999:.
5. Acquadro C, Berzon R, Dubois D, Leidy NK, Marquis P, Revicki D,
Rothman M: Incorporating the patient’s perspective into drug
development and communication: an ad hoc task force report of the
Patient-Reported Outcomes (PRO) Harmonization Group meeting at the
Food and Drug Administration, February 16, 2001. Value Health 2003,
6:522-531.
6. Higginson IJ, Carr AJ: Measuring quality of life: Using quality of life
measures in the clinical setting. BMJ (Clinical research ed 2001,
322:1297-1300.
7. McDowell I: Measuring health: a guide to rating scales and
questionnaires. New York: Oxford University Press, 3 2006.
8. McHorney CA: Health status assessment methods for adults: past
accomplishments and future challenges. Annu Rev Public Health 1999,
20:309-335.
9. Ware JE Jr: Conceptualization and measurement of health-related quality
of life: comments on an evolving field. Archives of physical medicine and
rehabilitation 2003, 84:S43-51.
10. Diener E, Suh EM, Lucas RE, Smith HL: Subjective well-being: three
decades of progress. Psychological Bulletin 1999, 125:276-302.
11. Davern M, Cummins RA, Stokes MA: Subjective wellbeing as an affective-
cognitive construct. Journal of Happiness Studies 2007, 8:429-449.
12. Dijkers M: “What’s in a name?” The indiscriminate use of the “Quality of
life” label, and the need to bring about clarity in conceptualizations. Int
J Nurs Stud 2007, 44:153-155.
13. Moons P, Budts W, De Geest S: Critique on the conceptualisation of
quality of life: a review and evaluation of different conceptual
approaches. Int J Nurs Stud 2006, 43:891-901.
14. Naughton MJ, Shumaker SA: The case for domains of function in quality
of life assessment. Qual Life Res 2003, 12(Suppl 1)
:73-80.
15. Dijkers MP: Quality of life of individuals with spinal cord injury: a review
of conceptualization, measurement, and research findings. J Rehabil Res
Dev 2005, 42:87-110.
16. Post M, Noreau L: Quality of life after spinal cord injury. J Neurol Phys Ther
2005, 29:139-146.
17. Hammell KW: Exploring quality of life following high spinal cord injury: a
review and critique. Spinal Cord 2004, 42:491-502.
18. Wood-Dauphinee S, Exner G, Bostanci B, Glass C, Jochheim KA, Kluger P,
Koller M, Krishnan KR, Post MW, Ragnarsson KT, et al: Quality of life in
patients with spinal cord injury–basic issues, assessment, and
recommendations. Restor Neurol Neurosci 2002, 20:135-149.
19. Hallin P, Sullivan M, Kreuter M: Spinal cord injury and quality of life
measures: a review of instrument psychometric quality. Spinal Cord 2000,
38:509-523.
20. Spinal Cord Injury Rehabilitation Evidence. Version 3.0. Outcome
Measures. [ />21. Diener E, Emmons RA, Larsen RJ, Griffin S: The Satisfaction With Life Scale.
J Pers Assess 1985, 49:71-75.
22. National Spinal Cord Injury Statistical Center: The Spinal Cord Injury Model
Systems’ data collection syllabus for the National Spinal Cord Injury
Database. Birmingham, Alabama: National Spinal Cord Injury Statistical
Center 2006.
23. Fugl-Meyer AR, Bränholm I-B, Fugl-Meyer KS: Happiness and domain-
specific life satisfaction in adult northern Swedes. Clinical rehabilitation
1991, 5:25-33.
24. WHOQOL Group: Development of the World Health Organization
WHOQOL-BREF quality of life assessment. The WHOQOL Group. Psychol
Med 1998, 28:551-558.
25. Songhuai L, Olver L, Jianjun L, Kennedy P, Genlin L, Duff J, Scott-Wilson U:
A comparative review of life satisfaction, quality of life and mood
between Chinese and British people with tetraplegia. Spinal Cord 2009,
47:82-86.
26. Ide M, Fugl-Meyer AR: Life satisfaction in persons with spinal cord injury:
a comparative investigation between Sweden and Japan. Spinal Cord
2001, 39:387-393.
27. Diener E, Suh EM, Smith H, Shao L: National differences in reported
subjective well-being: Why do they occur? Social Indicators Research 1995,
34:7-32.
28. Herdman M, Fox-Rushby J, Badia X: A model of equivalence in the
cultural adaptation of HRQoL instruments: the universalist approach.
Qual Life Res 1998, 7:323-335.
29. Acquadro C, Conway K, Hareendran A, Aaronson N: Literature review of
methods to translate health-related quality of life questionnaires for use
in multinational clinical trials. Value Health 2008, 11:509-521.
30. Skevington SM, Sartorius N, Amir M: Developing methods for assessing
quality of life in different cultural settings. The history of the WHOQOL
instruments. Soc Psychiatry Psychiatr Epidemiol 2004, 39:1-8.
31. Ware JE, Gandek B: Overview of the SF-36 Health Survey and the
International Quality of Life Assessment (IQOLA) Project. Journal of
clinical epidemiology 1998, 51:903-912.
32. Granger CV: Rehabilitation and outcome measurement: where is Rasch
analysis going? Eura Medicophys 2007, 43:559-560.
33. Tennant A, Penta M, Tesio L, Grimby G, Thonnard JL, Slade A, Lawton G,
Simone A, Carter J, Lundgren-Nilsson A, et al: Assessing and adjusting for
cross-cultural validity of impairment and activity limitation scales
through differential item functioning within the framework of the Rasch
model: the PRO-ESOR project. Medical care 2004, 42:I37-48.
34. Catz A, Itzkovich M, Tesio L, Biering-Sorensen F, Weeks C, Laramee MT,
Craven BC, Tonack M, Hitzig SL, Glaser E, et al: A multicenter international
study on the Spinal Cord Independence Measure, version III: Rasch
psychometric validation. Spinal Cord 2007, 45:275-291.
35. Biering-Sorensen F, Scheuringer M, Baumberger M, Charlifue SW, Post MW,
Montero F, Kostanjsek N, Stucki G: Developing core sets for persons with
spinal cord injuries based on the International Classification of
Functioning, Disability and Health as a way to specify functioning. Spinal
Cord 2006, 44:541-546.
Geyh et al. Health and Quality of Life Outcomes 2010, 8:94
/>Page 14 of 16
36. Cieza A, Kirchberger I, Biering-Sorensen F, Baumberger M, Charlifue S,
Post MW, Campbell R, Kovindha A, Ring H, Sinnott A, et al: ICF Core Sets
for individuals with spinal cord injury in the long-term context. Spinal
Cord 2010, 8(4):305-12, Epub 2010 Jan 12.
37. International Wellbeing Group: Personal Wellbeing Index. Melbourne:
Australian Centre on Quality of Life, Deakin University, 4 2006.
38. WHOQOL Group: The World Health Organization Quality of Life
Assessment (WHOQOL): development and general psychometric
properties. Soc Sci Med 1998, 46:1569-1585.
39. Keith RA: Patient satisfaction and rehabilitation services. Archives of
physical medicine and rehabilitation 1998, 79:1122-1128.
40. Pavot W, Diener E: Review of the Satisfaction With Life Scale.
Psychological Assessment 1993, 5:164-172.
41. Pavot W, Diener E, Colvin CR, Sandvik E: Further validation of the
Satisfaction With Life Scale: evidence for the cross-method convergence
of well-being measures. J Pers Assess 1991, 57:149-161.
42. Arrindell WA, Meeuwesen L, Huyse FJ: The Satisfaction With Life Scale
(SWLS): psychometric properties in a non-psychiatric medical
outpatients sample. Pers Individ Diff 1991, 12:117-123.
43. Laranjeira CA: Preliminary validation study of the Portuguese version of
the satisfaction with life scale. Psychol Health Med 2009, 14:220-226.
44. Chwalisz K, Diener E, Gallagher D: Autonomic arousal feedback and
emotional experience: evidence from the spinal cord injured. J Pers Soc
Psychol 1988, 54:820-828.
45. Tate DG, Forchheimer M: Health-related quality of life and life satisfaction
for women with spinal cord injury. Topics in Spinal Cord Injury
Rehabilitation 2001, 7:1-15.
46. Rintala DH, Robinson-Whelen S, Matamoros R: Subjective stress in male
veterans with spinal cord injury. J Rehabil Res Dev 2005, 42:291-304.
47. Dijkers MP: Correlates of life satisfaction among persons with spinal cord
injury. Archives of physical medicine and rehabilitation 1999, 80:867-876.
48. Charlifue S, Lammertse DP, Adkins RH: Aging with spinal cord injury:
changes in selected health indices and life satisfaction. Archives of
physical medicine and rehabilitation 2004, 85:1848-1853.
49. Putzke JD, Richards JS, Hicken BL, DeVivo MJ: Predictors of life satisfaction:
a spinal cord injury cohort study. Archives of physical medicine and
rehabilitation 2002,
83:555-561.
50. Shevlin M, Brunsden V, Miles JNV: Satisfaction With Life Scale: analysis of
factorial invariance, mean structures and reliability. Person Indiv Diff 1998,
25:911-916.
51. Tucker KL, Ozer DJ, Lyubomirsky S, Boehm JK: Testing for measurement
invariance in the Satisfaction With Life Scale: A comparison of Russians
and North Americans. Social Indicators Research 2006, 78:341-360.
52. Vitterso J, Biswas-Diener R, Diener E: The divergent meanings of life
satisfaction: Item response modeling of the Satisfaction With Life Scale
in Greenland and Norway. Social Indicators Research 2005, 74:327-348.
53. Fugl-Meyer AR, Melin R, Fugl-Meyer KS: Life satisfaction in 18- to 64-year-
old Swedes: in relation to gender, age, partner and immigrant status. J
Rehabil Med 2002, 34:239-246.
54. Post MW, de Witte LP, van Asbeck FW, van Dijk AJ, Schrijvers AJ: Predictors
of health status and life satisfaction in spinal cord injury. Archives of
physical medicine and rehabilitation 1998, 79:395-401.
55. Kennedy P, Smithson E, McClelland M, Short D, Royle J, Wilson C: Life
satisfaction, appraisals and functional outcomes in spinal cord-injured
people living in the community. Spinal Cord 2009 2010, 48(2):144-8, Epub
2009 Jul 14.
56. Woolrich RA, Kennedy P, Tasiemski T: A preliminary psychometric
evaluation of the Hospital Anxiety and Depression Scale (HADS) in 963
people living with a spinal cord injury. Psychol Health Med 2006, 11:80-90.
57. Kennedy P, Taylor N, Hindson L: A pilot investigation of a psychosocial
activity course for people with spinal cord injuries. Psychol Health Med
2006, 11:91-99.
58. Kennedy P, Lude P, Taylor N: Quality of life, social participation, appraisals
and coping post spinal cord injury: a review of four community
samples. Spinal Cord 2006, 44:95-105.
59. Norrbrink Budh C, Kowalski J, Lundeberg T: A comprehensive pain
management programme comprising educational, cognitive and
behavioural interventions for neuropathic pain following spinal cord
injury. J Rehabil Med 2006, 38:172-180.
60. Cummins RA, Eckersley R, Pallant J, van Vugt J, Misajon R: Developing a
national index of subjective wellbeing: the Australian unity wellbeing
index. Social Indicators Research 2003, 64:159-190.
61. Lau ALD, Cummins RA, McPherson W: An investigation into the cross-
cultural equivalence of the Personal Wellbeing Index. Social Indicators
Research 2005, 72:403-430.
62. Tiliouine H, Cummins RA, Davern M: Measuring wellbeing in developing
countries: the case of Algeria. Social Indicators Research 2006, 75:1-30.
63. Skevington SM, Lotfy M, O’Connell KA:
The World Health Organization’s
WHOQOL-BREF quality of life assessment: psychometric properties and
results of the international field trial. A report from the WHOQOL group.
Qual Life Res 2004, 13:299-310.
64. Chapin MH, Miller SM, Ferrin JM, Chan F, Rubin SE: Psychometric validation
of a subjective well-being measure for people with spinal cord injuries.
Disabil Rehabil 2004, 26:1135-1142.
65. Lin MR, Hwang HF, Chen CY, Chiu WT: Comparisons of the brief form of
the World Health Organization Quality of Life and Short Form-36 for
persons with spinal cord injuries. Am J Phys Med Rehabil 2007, 86:104-113.
66. Schmidt S, Power M: Cross-cultural analyses of determinants of quality of
life and mental health: results from the EUROHIS study. Social Indicators
Research 2006, 77:95-138.
67. Schmidt S, Muhlan H, Power M: The EUROHIS-QOL 8-item index:
psychometric results of a cross-cultural field study. Eur J Public Health
2006, 16:420-428.
68. Cieza A, Ewert T, Ustun TB, Chatterji S, Kostanjsek N, Stucki G: Development
of ICF Core Sets for patients with chronic conditions. J Rehabil Med 2004,
9-11.
69. Grill E, Ewert T, Chatterji S, Kostanjsek N, Stucki G: ICF Core Sets
development for the acute hospital and early post-acute rehabilitation
facilities. Disabil Rehabil 2005, 27:361-366.
70. Andrich D, Sheridan B, Luo G: RUMM 2030 (Beta Version for Windows) Perth,
Western Australia: RUMM Laboratory Pty Ltd 2009.
71. Wright BD, Masters GN: Rating Scale Analysis Chicago, IL: MESA 1982.
72. Andrich D: Controversy and the Rasch model: a characteristic of
incompatible paradigms? Medical care 2004, 42:I7-16.
73. Bond TG, Fox CM: Applying the Rasch model: Fundamental measurement in
the human sciences Mahwah, NJ: Lawrence Erlbaum Associates 2001.
74. Andrich D: Rasch Models for Measurement Newbury Park, CA: Sage 1988.
75. Bland JM, Altman DG: Multiple significance tests: the Bonferroni method.
BMJ (Clinical research ed) 1995, 310:170.
76. Smith RM, Miao CY: Assessing unidimensionality for Rasch measurement.
In Objective Measurement: Theory into Practice. Edited by: Wilson M.
Norwood: Ablex; 1994:2:316-327.
77. Raîche G: Critical eigenvalue sizes in standardized residual principal
components analysis. Rasch Measurement Transactions 2005, 19:1012.
78. Smith EV Jr: Detecting and evaluating the impact of multidimensionality
using item fit statistics and principal component analysis of residuals.
Journal of applied measurement 2002, 3:205-231.
79. Tennant A, Pallant JF: Unidimensionality Matters! (A Tale of Two Smiths?).
Rasch Measurement Transactions
2006, 20:1048-1051.
80. Linacre JM: Optimizing rating scale category effectiveness. Journal of
applied measurement 2002, 3:85-106.
81. Fisher WP: Reliability statistics. Rasch Measurement Transactions 1992, 6:238.
82. Andrich D: An index of person separation in latent trait theory, the
traditional KR.20 index, and the Guttman scale response pattern.
Education Research and Perspectives 1982, 9:95-104.
83. Lange R, Irwin HJ, Houran J: Top-down purification of Tobacyk’s Revised
Paranormal Belief Scale. Personality and individual differences 2000,
29:131-156.
84. Andrich D, Luo G: Conditional pairwise estimation in the Rasch model for
ordered response categories using principal components. Journal of
applied measurement 2003, 4:205-221.
85. Fisher WP: The cash value of reliability. Rasch Measurement Transactions
2008, 22:1158-1161.
86. Post MWM, Ros WJG, Schrijvers AJP: Impact of social support on health
status and life satisfaction in people with a spinal cord injury. Psychology
and Health 1999, 14:679-695.
87. Vautier S, Mullet E, Jmel S: Assessing the structural robustness of self-
rated satisfaction with life: a SEM analysis. Social Indicators Research 2004,
68:235-249.
Geyh et al. Health and Quality of Life Outcomes 2010, 8:94
/>Page 15 of 16
88. Linacre JM: Sample Size and Item Calibration Stability. Rasch Measurement
Transactions 1994, 7:328.
doi:10.1186/1477-7525-8-94
Cite this article as: Geyh et al.: Cross-cultural validity of four quality of
life scales in persons with spinal cord injury. Health and Quality of Life
Outcomes 2010 8:94.
Submit your next manuscript to BioMed Central
and take full advantage of:
• Convenient online submission
• Thorough peer review
• No space constraints or color figure charges
• Immediate publication on acceptance
• Inclusion in PubMed, CAS, Scopus and Google Scholar
• Research which is freely available for redistribution
Submit your manuscript at
www.biomedcentral.com/submit
Geyh et al. Health and Quality of Life Outcomes 2010, 8:94
/>Page 16 of 16