Remote Sensing and GIS Accuracy Assessment - Chapter 4 pot
Bạn đang xem bản rút gọn của tài liệu. Xem và tải ngay bản đầy đủ của tài liệu tại đây (662.74 KB, 17 trang )
41
CHAPTER
4
In Situ
Estimates of Forest LAI for
MODIS Data Validation
John S. Iiames, Jr., Andrew N. Pilant, and Timothy E. Lewis
CONTENTS
4.1 Introduction 41
4.1.1 Study Area 43
4.2 Background 43
4.2.1 TRAC Measurements 43
4.2.2 Hemispherical Photography Measurements 45
4.2.3 Combining TRAC and Hemispherical Photography 45
4.2.4 Satellite Data 46
4.2.5 MODIS LAI and NDVI Products 46
4.3 Methods 47
4.3.1 Sampling Frame Design 47
4.3.2 Biometric Mensuration 48
4.3.3 TRAC Measurements 50
4.3.4 Hemispherical Photography 51
4.3.5 Hemispherical Photography Quality Assurance 52
4.4 Discussion 52
4.4.1 LAI Accuracy Assessment 52
4.4.2 Hemispherical Photography 52
4.4.3 Satellite Remote Sensing Issues 54
4.5 Summary 54
Acknowledgments 55
References 55
4.1 INTRODUCTION
Satellite remote sensor data are commonly used to assess ecosystem conditions through synoptic
monitoring of terrestrial vegetation extent, biomass, and seasonal dynamics. Two commonly used
vegetation indices that can be derived from various remote sensor systems include the Normalized
Difference Vegetation Index (NDVI) and Leaf Area Index (LAI). Detailed knowledge of vegetation
L1443_C04.fm Page 41 Saturday, June 5, 2004 10:17 AM
© 2004 by Taylor & Francis Group, LLC
42 REMOTE SENSING AND GIS ACCURACY ASSESSMENT
index performance is required to characterize both the natural variability across forest stands and
the intraannual variability (phenology) associated with individual stands. To assess performance
accuracy,
in situ
validation procedures can be applied to evaluate the accuracy of remote sensor-
derived indices. A collaborative effort was established with researchers from the U.S. Environmental
Protection Agency (EPA), National Aeronautics and Space Administration (NASA), academia, and
state and municipal governmental organizations, and private forest industry to evaluate the Moderate
Resolution Imaging Spectroradiometer (MODIS) NDVI and LAI products across six validation
sites in the Albemarle-Pamlico Basin (APB), in North Carolina and Virginia (Figure 4.1).
The significance of LAI and NDVI as source data for process-based ecological models has
been well documented. LAI has been identified as the variable of greatest importance for quantifying
energy and mass exchange by plant canopies (Running et al., 1986) and has been shown to explain
80 to 90% of the variation in the above-ground forest net primary production (NPP) (Gholz, 1982;
Gower et al., 1992; Fassnacht and Gower, 1997). LAI is an important biophysical state parameter
linked to biological productivity and carbon sequestration potential and is defined here as one half
the total green leaf area per unit of ground surface area (Chen and Black, 1992). NPP is the rate
at which carbon is accumulated by autotrophs and is expressed as the difference between gross
photosynthesis and autotrophic respiration (Jenkins et al., 1999).
NDVI has been used to provide LAI estimates for the prediction of stand and foliar biomass
(Burton et al., 1991) and as a surrogate to estimate stand biomass for denitrification potential in
forest filter zones for agricultural nonpoint source nitrogenous pollution along riparian waterways
(Verchot et al., 1998). Interest in tracking LAI and NDVI changes includes the role forests play in
the sequestration of carbon from carbon emissions (Johnsen et al., 2001) and the formation of
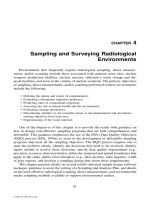
Figure 4.1
LAI field validation site locations within the Albemarle-Pamlico Basin in southern Virginia and
northern North Carolina. (1) Hertford; (2) South Hill; (3) Appomattox; (4) Fairystone; (5) Duke
FACE; (6) Umstead.
VA
NC
Roanoke
Raleigh
Virginia
Beach
Kilometers
Miles
0
0
4
6
5
2
1
3
50
50
S
N
Albemarle-
Pamlico Basin
L1443_C04.fm Page 42 Saturday, June 5, 2004 10:17 AM
© 2004 by Taylor & Francis Group, LLC
IN SITU
ESTIMATES OF FOREST LAI FOR MODIS DATA VALIDATION 43
tropospheric ozone from biogenic emissions of volatile organic compounds naturally released into
the atmosphere (Geron et al., 1994). The NDVI has commonly been used as an indicator of biomass
(Eidenshink and Haas, 1992) and vegetation vigor (Carlson and Ripley, 1997). NDVI has been
applied in monitoring seasonal and interannual vegetation growth cycles, land-cover (LC) mapping,
and change detection. Indirectly, it has been used as a precursor to calculate LAI, biomass, the
fraction of absorbed photosynthetically active radiation (fAPAR), and the areal extent of green
vegetation cover (Chen, 1996).
Direct estimates of LAI can be made using destructive sampling and leaf litter collection
methods (Neumann et al., 1989). Direct destructive sampling is regarded as the most accurate
approach, yielding the closest approximation of “true” LAI. However, destructive sampling is time-
consuming and labor-intensive, motivating development of more rapid, indirect field optical meth-
ods. A subset of field optical techniques include hemispherical photography, LiCOR Plant Canopy
Analyzer (PCA) (Deblonde et al., 1994), and the Tracing Radiation and Architecture of Canopies
(TRAC) sunfleck profiling instrument (Leblanc et al., 2002).
In situ
forest measurements serve as
both reference data for satellite product validation and as baseline measurements of seasonal
vegetation dynamics, particularly the seasonal expansion and contraction of leaf biomass.
The development of appropriate ground-based sampling strategies is critical to the accurate
specification of uncertainties in LAI products (Tian et al., 2002). Other methods that have been
implemented to assess the MODIS LAI product have included a spatial cluster design and a patch-
based design (Burrows et al., 2002). Privette et al. (2002) used multiple parallel 750-m TRAC
sampling transects to assess LAI and other canopy properties at scales approaching that of a single
MODIS pixel. Also, a stratified random sampling (SRS) design element provided sample intensi-
fication for less frequently occurring LC types (Lunetta et al., 2001).
4.1.1 Study Area
The study area is the Albemarle-Pamlico Basin (APB) of North Carolina and Virginia (Figure
4.1). The APB has a drainage area of 738,735 km
2
and includes three physiographic provinces:
mountain, piedmont, and coastal plain, ranging in elevation from 1280 m to sea level. The APB
subbasins include the Albemarle-Chowan, Roanoke, Pamlico, and Neuse River basins. The Albe-
marle-Pamlico Sounds compose the second-largest estuarine system within the continental U.S.
The 1992 LC in the APB consisted primarily of forests (50%), agriculture (27%), and wetlands
(17%). The forest component is distributed as follows: deciduous (48%), conifer (33%), and mixed
(19%) (Vogelmann et al., 1998).
4.2 BACKGROUND
4.2.1 TRAC Measurements
The TRAC sunfleck profiling instrument consists of three quantum PAR sensors (LI-COR,
Lincoln, NE, Model LI-190SB) mounted on a wand with a built-in data logger (Leblanc et al.,
2002) (Figure 4.2). The instrument is hand-carried along a linear transect at a constant speed,
measuring the downwelling solar photosynthetic photon flux density (PPFD) in units of micromoles
per square meter per second. The data record light–dark transitions as the direct solar beam is
alternately transmitted and eclipsed by canopy elements (Figure 4.3). This record of sunflecks and
shadows is processed to yield a canopy gap size distribution and other canopy architectural param-
eters, including LAI and a foliage element clumping index.
From the downwelling solar flux recorded along a transect, the TRACWin software (Leblanc
et al., 2002) computes the following derived parameters describing forest canopy architecture: (1)
L1443_C04.fm Page 43 Saturday, June 5, 2004 10:17 AM
© 2004 by Taylor & Francis Group, LLC
44 REMOTE SENSING AND GIS ACCURACY ASSESSMENT
canopy gap size (physical dimension of a canopy gap), (2) canopy gap fraction (percentage of
canopy gaps),
(3)
foliage element clumping index,
W
e
(
q
), (4) plant area index (LAI, which includes
both foliage and woody material), and (5) LAI with clumping index (
W
e
) incorporated. Note that
in each case the parameters are for the particular solar zenith angle
q
at the time of data acquisition,
defining an inclined plane slicing the canopy between the moving instrument and the sun.
Parameters entered into the TRACWin software to invert measured PPFD to the derived output
parameters include the mean element width (the mean size of shadows cast by the canopy), the
needle-to-shoot area ratio (
g
) (within-shoot clumping index), woody-to-total area ratio (
a
), lati-
tude/longitude, and time.
Potential uncertainties were inherent in the first three parameters and will
be assessed in future computational error analyses.
Solar zenith and azimuth influence data quality. Optimal results are achieved with a solar zenith
angle
q
between 30 and 60 degrees. As
q
approaches the horizon (
q
> 60˚), the relationship between
LAI and light extinction becomes increasingly nonlinear. Similarly, best results are attained when
TRAC sampling is conducted with a solar azimuth perpendicular to the transect azimuth. Sky
condition is a significant factor for TRAC measurements. Clear, blue sky with unobstructed sun is
optimal. Overcast conditions are unsuitable; the methodology requires distinct sunflecks and shadows.
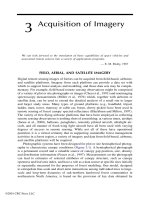
Figure 4.2
Photograph of (A) TRAC Instrument (length ~ 80 cm) and (B) PAR detectors (close-up).
Figure 4.3
TRAC transect in loblolly pine plantation (site: Hertford). Peaks (black spikes) are canopy gaps.
Computed parameters for this transect were gap fraction = 9%; clumping index (
W
e
) = 0.94; PAI =
3.07; L
e
= 4.4 (assuming
g
= 1.5,
a
= 0.1, and mean element width = 50 mm).
A
B
Photosynthetic photon flux density (PPFD)
(µmol/m
2
/s)
1300
100500
0
10 m
Position along transect (m)
L1443_C04.fm Page 44 Saturday, June 5, 2004 10:17 AM
© 2004 by Taylor & Francis Group, LLC
IN SITU
ESTIMATES OF FOREST LAI FOR MODIS DATA VALIDATION 45
The TRAC manual (Leblanc et al., 2002) lists the following as studies validating the TRAC
instrument and approach: Chen and Cihlar (1995), Chen (1996), Chen et al. (1997), Kucharik et
al. (1997), and Leblanc (2002). TRAC results were compared with direct destructive sampling,
which is generally regarded as the most accurate sampling technique.
4.2.2 Hemispherical Photography Measurements
Hemispherical photography is an indirect optical method that has been used in studies of forest
light transmission and canopy structure. Photographs taken upward from the forest floor with a
180˚ hemispherical (fish-eye) lens produce circular images that record the size, shape, and location
of gaps in the forest overstory. Photographs can be taken using 35-mm film cameras or digital
cameras. A properly classified fish-eye photograph provides a detailed map of sky visibility and
obstructions (sky map) relative to the location where the photograph was taken. Various software
programs, such as Gap Light Analyzer (GLA), were available to process film or digital fish-eye
camera images into a myriad of metrics that reveal information about the light regimes beneath
the canopy and the productivity of the plant canopy. These programs rely on an accurate projection
of a three-dimensional hemispherical coordinate system onto a two-dimensional surface (Figure
4.4). Accurate projection requires calibration information for the fish-eye lens that is used and any
spherical distortions associated with the lens. GLA used in this analysis was available for download
at (Frazer et al., 1999).
The calculation of canopy metrics depends on accurate measures of gap fraction as a function
of zenith angle and azimuth. The digital image can be divided into zenith and azimuth “sky
addresses” or sectors (Figure 4.5). Each sector can be described by a combined zenith angle and
azimuth value. Within a given sector, gap fraction is calculated with values between zero (totally
“obscured” sky) and one (totally “open” sky) and is defined as the proportion of unobscured sky
as seen from a position beneath the plant canopy (Delta-T Devices, 1998).
4.2.3 Combining TRAC and Hemispherical Photography
LAI calculated using hemispherical photography or other indirect optical methods does not
account for the nonrandomness of canopy foliage elements. Hence, the term
effective leaf area index
(L
e
) is used to refer to the leaf area index estimated from optical measurements including hemi-
spherical photography. L
e
typically underestimates “true” LAI (Chen et al., 1991). This underesti-
mation is due in part to nonrandomness in the canopy (i.e., foliage “clumping” at the scales of tree
Figure 4.4
Illustration of (A) a hemispherical coordinate system. Such a system is used to convert a hemi-
spherical photograph into a two-dimensional circular image (B), where the zenith () is in the center,
the horizon at the periphery, east is to the left, and west is to the right. In a equiangular hemispherical
projection, distance along a radius (r) is proportional to zenith angle (Rich, 1990).
W
E
N
N
θ
α
S
S
A
B
r
E
W
L1443_C04.fm Page 45 Saturday, June 5, 2004 10:17 AM
© 2004 by Taylor & Francis Group, LLC
46 REMOTE SENSING AND GIS ACCURACY ASSESSMENT
crown), whorls, branches, and shoots. The TRAC instrument was developed at the Canada Centre
for Remote Sensing (CCRS) to address canopy nonrandomness (Chen and Cihlar, 1995). In the
APB study, hemispherical photography (L
e
) and TRAC measurements (foliage clumping index)
were combined to provide a better estimate of LAI following the method of Leblanc et al. (2002).
4.2.4 Satellite Data
MODIS was launched in 1999 aboard the NASA Terra platform (EOS-AM) and in 2002 aboard
the Aqua platform (EOS-PM) and provides daily coverage of most of the earth (Justice et al., 1998;
Masuoka et al., 1998). MODIS sensor characteristics include a spectral range of 0.42 to 14.35
m
m
in 36 spectral bands, variable pixel sizes (250, 500, and 1000 m), and a revisit interval of 1 to 2
days. Landsat Enhanced Thematic Mapper Plus (ETM
+
) images were acquired at various dates
throughout the year and were used for site characterization and in subsequent analysis for linking
field measurements of LAI with MODIS LAI. ETM
+
data characteristics include a spectral range
of 0.45 to 12.5
m
m; pixel sizes of 30 m (multispectral), 15 m (panchromatic), and 60 m (thermal);
and a revisit interval of 16 d. They also play a vital role in linking meter-scale
in situ
LAI
measurements with kilometer-scale MODIS LAI imagery.
IKONOS is a high-spatial-resolution
commercial sensor that was launched in 1999 that provides 4.0-m multispectral (four bands, 0.45
to 0.88
m
m) and 1-m panchromatic data (0.45 to 0.90
m
m) with a potential revisit interval of 1 to 3 d.
4.2.5 MODIS LAI and NDVI Products
Numerous land, water, and atmospheric geophysical products are derived from MODIS radiance
measurements. Two MODIS land products established the primary time-series data for this research:
NDVI (MOD13Q1) (Huete et al., 1996) and LAI/FPAR (MOD15A2) (Knyazikhin et al., 1999). The
NDVI product was a 16-d composite at a nominal pixel size of 250 m. The LAI product was an 8-
d composite product with a pixel size of 1000 m. Both products were adjusted for atmospheric effects
and viewing geometry (bidirectional reflectance distribution function, BRDF). The NDVI product
used in this study was produced using the standard MODIS-NDVI algorithm (Huete et al., 1996).
Figure 4.5
Sky-sector mapping using GLA image analysis software. Eight zenith by 18 azimuth sectors are
shown.
L1443_C04.fm Page 46 Saturday, June 5, 2004 10:17 AM
© 2004 by Taylor & Francis Group, LLC
IN SITU
ESTIMATES OF FOREST LAI FOR MODIS DATA VALIDATION 47
The MODIS LAI product algorithms were considerably more complex. The primary approach
for calculating LAI involved the inversion of surface reflectance in two to seven spectral bands and
comparison of the output to biome-specific look-up tables derived from three-dimensional canopy
radiative transfer modeling. All terrestrial LC was assigned to six global biomes, each with distinct
canopy architectural properties that drove photon transport equations. The six biomes included
grasses and cereal crops, shrubs, broadleaf crops, savannas, broadleaf forests, and needle forests.
The secondary technique was invoked when insufficient high-quality data were available for a given
compositing period (e.g., cloud cover, sensor system malfunction) and calculated LAI based on
empirical relationships with vegetation indices. However, a deficiency inherent with the second
approach was that NDVI saturates at high leaf biomass (LAI values between 5 and 6). The
computational approach used for each pixel was included with the metadata distributed with each
data set.
4.3 METHODS
Here we describe a field sampling design and data acquisition protocol implemented in 2002
for measuring
in situ
forest canopy properties for the analysis of correspondence to MODIS satellite
NDVI and LAI products. The study objective was to acquire field measurement data to evaluate
LAI and NDVI products using
in situ
measurement data and indirectly using higher-spatial-resolu-
tion imagery sensors including Landsat Enhanced Thematic Mapper Plus (ETM
+
) and IKONOS.
4.3.1 Sampling Frame Design
Six long-term forested research sites were established in the APB (Table 4.1). The objective
was to collect ground-reference data using optical techniques to validate seasonal MODIS NDVI
and LAI products. Baseline forest biometrics were also measured for each site. Five sites were
located in the Piedmont physiographic region and one site (Hertford) in the coastal plain. The
Hertford and South Hill sites were composed of homogeneous conifer forest (loblolly pine),
Fairystone mixed deciduous forest (oak/hickory), and Umstead mixed conifer and mixed forest,
and both Duke and Appomattox sites contained homogeneous stands of conifer and deciduous
forest managed under varying silvicultural treatments (e.g., thinning). At Duke and South Hill,
university collaborators monitored LAI using direct means (destructive harvest and leaf litter); their
data were employed to validate the field optical techniques used in this study.
The fundamental field sampling units are referred to as quadrants and subplots (Figure 4.6). A
quadrant was a 100-
¥
100-m grid with five 100-m east–west TRAC sampling transects and five
interspersed transects for hemispherical photography (lines A–E). The TRAC transects were spaced
at 20-m intervals (north–south), as were the interleaved hemispherical photography sampling
transects. A subplot consisted of two 50-m transects intersecting at the 25-m center point. The two
Table 4.1
Location Summary for Six Validation Sites in the Albemarle-Pamlico Basin
Site State
Location
(lat., long.)
Elevation
(m)
Physiographic
Region Ownership Area
Appomattox VA 37.219, –78.879 165–215 Piedmont Private 1200 m
2
(144 ha)
Duke FACE NC 35.975, –79.094 165–180 Piedmont Private 1200 m
2
(144 ha)
Fairystone VA 36.772, –80.093 395–490 Upper Piedmont State 1200 m
2
(144 ha)
Hertford NC 36.383, –77.001 8–10 Coastal Plain Private 1200 m
2
(144 ha)
South Hill VA 36.681, –77.994 90 Piedmont Private 1200 m
2
(144 ha)
Umstead NC 35.854, –78.755 100–125 Piedmont State 1200 m
2
(144 ha)
L1443_C04.fm Page 47 Saturday, June 5, 2004 10:17 AM
© 2004 by Taylor & Francis Group, LLC
48 REMOTE SENSING AND GIS ACCURACY ASSESSMENT
transects were oriented at 45˚ and 135˚ to provide flexibility in capturing TRAC measurements
during favorable morning and afternoon solar zenith angles.
Quadrants were designed to approximate an ETM
+
3
¥
3 pixel window. Subplots were designed
to increase sample site density and were selected on the basis of ETM
+
NDVI values to sample
over the entire range of local variability. Quadrants and subplots were geographically located on
each LAI validation site using real-time (satellite) differentially corrected GPS to a horizontal
accuracy of
±
1 m. TRAC transects were marked every 10 m with a labeled, 46-cm wooden stake.
The stakes were used in TRAC measurements as walking-pace and distance markers. Hemispherical
photography transects were staked and marked at the 10-, 30-, 50-, 70-, and 90-m locations.
Hemispherical photographs were taken at these sampling points.
The APB quadrant design was similar to a measurement design used in a Siberian LAI study
in the coniferous forest of Krasnoyarsk, Russia (Leblanc et al., 2002). Here, each validation site
had a minimum of one quadrant. Multiple quadrants at Fairystone were established across a 1200-
¥
1200-m oak–hickory forest delineated on a georeferenced ETM
+
image to approximate a MODIS
pixel (1 km
2
), with a 100-m perimeter buffer to partially address spatial misregistration of a MODIS
pixel (Figure 4.7). The stand was quartered into 600-
¥
600-m units. The northwest corner of a
LAI sampling quadrant was assigned within each quarter block using a random number generator.
A SRS design was used to select ground reference data spanning the entire range of LAI–NDVI
values. Fairystone sites were stratified based on a NDVI surface map calculated from July 2001
ETM
+
imagery. Analysis of the resulting histogram allowed for the identification of pixels beyond
±
1 standard deviation. From these high/low NDVI regions, eight locations (four high, four low)
were randomly selected from each of the four 600-
¥
600-m units. Subplots were established at
these points to sample high or low and midrange NDVI regions within each of the four quadrants.
4.3.2 Biometric Mensuration
The measurement of crown closure was included in quadrant sampling to establish the rela-
tionship between LAI and NDVI. Wulder et al. (1998) found that the inclusion of this textural
information strengthened the LAI:NDVI relationship, thus increasing the accuracy of modeled LAI
estimates. Crown closure was estimated directly using two field-based techniques: the vertical tube
Figure 4.6
Quadrant and subplot designs used in the Albemarle-Pamlico Basin study area.
S
N
Quadrant
100 m
20 m
20 m
L1_0
L1_0
L2_0
L2_0
L1_50
L2_50
A_10 A_90
E_10
E_90
L3_0
L4_0
L5_0
L1_100
L2_100
L3_100
L4_100
L5_100
Hemi
TRAC
Sub
L1443_C04.fm Page 48 Saturday, June 5, 2004 10:17 AM
© 2004 by Taylor & Francis Group, LLC
IN SITU
ESTIMATES OF FOREST LAI FOR MODIS DATA VALIDATION 49
(Figure 4.8) and the spherical densiometer (Figure 4.9) (Becker et al., 2002). Measurement estimates
were also performed using the TRAC instrument and hemispherical photography.
Measurements of forest structural attributes (forest stand volume, basal area, and density) were
made at each quadrant and subplot using a point sampling method based on a 10-basal-area-factor
prism. Point sampling by prism is a plotless technique (point-centered) in which trees are tallied
on the basis of their size rather than on frequency of occurrence on a plot (Avery and Burkhart,
1983). Large trees at a distance had a higher probability of being tallied than small trees at that
same distance. Forest structural attributes measured on trees that fell within the prism angle of
view included (1) diameter at breast height (dbh) at 1.4 m, (2) tree height, (3) tree species, and (4)
crown position in the canopy (dominant, codominant, intermediate, or suppressed).
At each quadrant, forest structural attributes were sampled at the 10-, 50-, and 90-m stations
along the A, C, and E hemispherical photography transects (Table 4.2). Point sampling was per-
formed at the subplot 25-m transect intersection. Physical site descriptions were made at each
Figure 4.7
Multiple quadrant design used at the Fairystone and Umstead sites. The 1200-
¥
1200-m region
approximates a MODIS LAI pixel, with a 100-m buffer on each edge. Quadrants are randomly
located within each 600-
¥
600-m quarter.
Figure 4.8
Schematic of vertical tube used for crown closure estimation.
1200 m
100 m
Quadrant 1
Quadrant 4
Quadrant 2
Quadrant 3
N
S
Top View
Cross-hairs
Sighting Hole
Leveling
Bubbles
Bottom View
L1443_C04.fm Page 49 Saturday, June 5, 2004 10:17 AM
© 2004 by Taylor & Francis Group, LLC
50 REMOTE SENSING AND GIS ACCURACY ASSESSMENT
quadrant and subplot by recording slope, aspect, elevation, and soil type. Digital images were
recorded at the zero-meter station of each TRAC transect during each site visit for visual documen-
tation. Images were collected at 0˚, 45˚, and 90˚ from horizontal facing east along the transect line.
4.3.3 TRAC Measurements
The TRAC instrument was hand-carried at waist height (~ 1 to 1.5 m) along each transect at
a constant speed of 0.3 m/sec. The operator traversed 10 m between survey stakes in 30 sec,
monitoring speed by wristwatch. The spatial sampling interval at 32 Hz at a cruising speed of 0.3
m/sec was approximately 10 mm (i.e., 100 samples/m). To the degree possible, transects were
sampled during the time of day at which the solar azimuth was most perpendicular to the transect
azimuth. Normally, quadrants were traversed in an east–west direction, but if the solar azimuth at
the time of TRAC sampling was near 90˚ or 270˚
(early morning or late afternoon in summer),
quadrants were traversed on a north–south alignment.
PPFD measurements were made in an open area before and after the undercanopy data acqui-
sition for data normalization to the maximum solar input. Generally, large canopy gaps provided
an approximation of the above-canopy PPFD, used to define the above canopy solar flux at times
when access to open areas was limited. Under uniform sky conditions, above-canopy solar flux
Figure 4.9
Illustration of (A) a spherical densiometer 60˚ field of view and (B) convex spherical densiometer
(courtesy of Ben Meadows).
Table 4.2
Vegetation Summary for Six Validation Sites in the Albemarle-Pamlico Basin
Site Type % Over TPH
Under
TPH
Avg. Ht
(m)
Avg. dbh
(cm)
CC%
Dom
CC%
Sup
BA/H
(m
2
/ha)
Appomattox Pine 25 1250 3790 15.9 21.6 71 34 36.7
Hardwood 25 1255 — 21.3 24.3 —— 22.9
Pine-Thinned 50 313 — 16.9 23.2 —— 11.5
Duke Hardwood 30 ——— ————
Fairystone Hardwood 100 725–1190 — 15.5–19.5 8.5–11.5 ——12.6–13.1
Hertford Pine 100 1740 2830 14.3 18.5 71 29 37.3
South Hill Pine 100 ——— ————
Umstead Pine 30 ——— ————
Hardwood 70 ——— ————
Note:
Over TPH = trees per hectare for trees greater than 5.08 cm dbh; Under TPH = trees per hectare less
than 5.08 cm in dbh; Avg. Ht = average height; Avg dbh = average diameter at breast height; CC% Dom
= crown closure for dominant crown class determined by vertical tube method; CC% Sup = crown closure
for suppressed crown class determined by fixed radius plot method; BA/H = basal area per hectare.
AB
L1443_C04.fm Page 50 Saturday, June 5, 2004 10:17 AM
© 2004 by Taylor & Francis Group, LLC
IN SITU
ESTIMATES OF FOREST LAI FOR MODIS DATA VALIDATION 51
was interpolated between measured values. Under partially cloudy conditions, the operator stopped
recording photon flux during cloud eclipse of the solar beam.
Operators performed a check on the data in the field immediately after download to a portable
computer. Typically, this involved plotting the PPFD in graphical form and comparing the number
of segments collected to the number of 10-m intervals traversed. An important quality assurance
measure was the use of paper and computer forms for data entry. To ensure that all relevant ancillary
data (i.e., weather conditions, transect orientation, operator names, data file names) were captured
in the field, operators filled out paper forms on-site for TRAC, hemispherical photography, and
biometric measurements. These data forms were then entered into a computer database via pre-
scribed forms, preferably immediately after data collection. This was a simple but valuable step to
ensure that critical data acquisition and processing parameters were not inadvertently omitted from
field notes. The computer forms provided a user interface to the relational database containing all
the metadata for the APB project.
4.3.4 Hemispherical Photography
Two Nikon Coolpix 995 digital cameras with Nikon FC-E8 fish-eye converters were used in
conjunction with TRAC at all six APB research sites. Exposures were set to automatic with normal
file compression (approximately 1/8) selected at an image size of 1600
¥
1200 pixels. Hemispherical
images were not collected while the sun was above the horizon, unless the sky was uniformly
overcast. Images were primarily captured at dawn or dusk to avoid the issue of nonuniform
brightness, resulting in the foliage being “washed out” in the black-and-white binary image.
The camera was mounted on a tripod and leveled over each wooden stake along each A through
E photo transect. The height of the camera was adjusted to approximately breast height (1.4 m)
and leveled to ensure that the “true” horizon occurred at a 90˚ zenith angle in the digital photographic
image. The combination of two bubble levelers, one mounted on the tripod and the other on the
lens cap, ensured the capture of the “true” horizon in each photograph. Using a hand-held compass,
the camera was oriented to true north so that the azimuth values in the photograph corresponded
to the true orientation of the canopy architecture in the forest stand. Orientation did not affect any
of the whole-image canopy metrics (i.e., LAI, canopy openness, or site openness) calculated by
GLA. However, comparison of metrics derived by hemispherical photography, TRAC, densiometer,
or forest mensuration measurements required accurate image orientation.
After the images were captured in the field they were downloaded from the camera disk, placed
in a descriptive file directory structure, and renamed to reflect the site and transect point. A GLA
configuration file (image orientation, projection distortion and lens calibration, site location coor-
dinates, growing-season length, sky-region brightness, and atmospheric conditions) was created for
each site. Next, images were registered in a procedure that defined an image’s circular area and
location of north in the image. Image registration entailed entering pixel coordinates (image size-
and camera-dependent) for the initial and final X and Y points. The FC-E8 fish-eye lens used in
this study had an actual field of view greater than 180˚ (~185˚). The radius of the image was
reduced accordingly so that the 90˚ zenith angle represented the true horizon. Frazer et al. (2001)
described the procedure for calibrating a fish-eye lens. Calibration results were entered into the
GLA configuration file (Canham et al., 1994).
The analyst-determined threshold setting in GLA adjusted the number of black (“obscured”
sky) and white (“unobscured” sky) pixels in the working image. This was perhaps the most
subjective setting in the entire measurement process and potentially the largest source of error in
the calculation of LAI and other canopy metrics from hemispherical photographs. As a rule of
thumb, the threshold value was increased so that black pixels appeared that were not represented
by canopy elements in the registered color image. The threshold was then decreased from this point
until the black dots or blotches disappeared and the black-and-white working image was a reason-
able representation of the registered color image (Frazer et al., 1999).
L1443_C04.fm Page 51 Saturday, June 5, 2004 10:17 AM
© 2004 by Taylor & Francis Group, LLC
52 REMOTE SENSING AND GIS ACCURACY ASSESSMENT
4.3.5 Hemispherical Photography Quality Assurance
The height at which each hemispherical photograph was taken represented a potential source
of positional errors (~ 5 to 10 cm). At relatively level sampling points, the tripod legs and center
shaft were fully extended to attain a height that approximated breast height. However, at sites with
steep and/or uneven slopes, the camera height may have varied between repetitive measurement
dates due to variations in the extension of the tripod legs, possibly resulting in inclusion or exclusion
of near-lens vegetation.
Several comparisons of hemispherical photographic estimates of LAI with direct estimates in
broad leaf and conifer forest stands have been reported (Neumann et al., 1989; Chason, 1991; Chen
and Black, 1991; Deblonde et al., 1994; Fassnacht et al., 1994; Runyon et al., 1994). These
comparisons all showed that there was a high correlation between the indirect and direct methods,
but the indirect methods were biased low. This was because the clumping factor was not accounted
for using a random foliar distribution model (Chen et al., 1991).
To assess analyst repeatability, a set of 31 hemispherical photographic images collected in
eastern Oregon were analyzed and threshold values charted using SAS QC software (SAS, 1987).
Two analysts in the APB study repeatedly analyzed the 31 images to develop an ongoing quality
control assessment of precision compared to the Oregon assessment.
4.4 DISCUSSION
4.4.1 LAI Accuracy Assessment
Chen (1996) provided an estimate of errors in optical measurements of forest LAI using
combined TRAC and LiCOR 2000 PCA instruments. We assumed that the PCA was equivalent to
digital hemispherical photography for this discussion. Chen states that, based on error analysis,
carefully executed optical measurements can provide LAI accuracies of close to or better than 80%
compared to destructive sampling. The approximate errors accumulated as follows: PCA measure-
ments (3 to 5%); estimate of needle-to-shoot area ratio (
g
) (5 to 10%); estimate of foliage element
clumping index (3 to 10%); estimate of woody-to-total area ratio (5 to 12%). These factors sum
to an approximate total error of 15 to 40% in ground-based optical instrument estimates of LAI.
Chen (1996) also reports that the highest accuracy (~ 85%) (relative to destructive sampling)
“can be achieved by carefully operating the PCA and TRAC, improving the shoot sampling strategy
and the measurement of woody-to-total area ratio.” A crucial issue for this analysis was to better
understand the robustness of published values of needle-to-shoot area ratio (
g
) and woody-to-total
area ratio (
a
), because direct sampling of these quantities was logistically infeasible in this research
effort. Published values have been used in this analysis (Leblanc et al., 2002).
4.4.2 Hemispherical Photography
Figure 4.10 presents a chronosequence of hemispherical photographic images taken at the
midpoint (50 m) of the C transect at the Hertford site at five different dates in 2002. The images
were the registered black-and-white bitmap images produced by GLA. The date and LAI Ring 5
values were displayed to the right of each image. LAI Ring 5 represented a 0˚ to 75˚ field of view.
In the March 5, 2002, image, near-lens understory foliage was observed in the lower-left portion.
However, in subsequent images, the large-leafed obstruction was absent. The reason for the disap-
pearance of this understory image component was unclear. The tripod height may have been adjusted
to place the camera above the near-lens foliar obstruction, or perhaps field-crew effects may have
resulted in the disappearance of the obstruction. The presence of the near-lens foliage in the March
5 image may account for the somewhat elevated LAI value before leaf-out.
L1443_C04.fm Page 52 Saturday, June 5, 2004 10:17 AM
© 2004 by Taylor & Francis Group, LLC
IN SITU
ESTIMATES OF FOREST LAI FOR MODIS DATA VALIDATION 53
Figure 4.10
Chronosequence of hemispherical
photographs taken at the Hertford
site along transect C and the 50-m
midpoint. Dates and LAI Ring 5 val-
ues are shown to the right of each
image.
Hertford, VA - TRANSECT C-50
05 March 2002
LAI Ring 5 = 1.6
Hertford, VA - TRANSECT C-50
05 April 2002
LAI Ring 5 = 1.7
Hertford, VA - TRANSECT C-50
05 June 2002
LAI Ring 5 = 2.29
Hertford, VA - TRANSECT C-50
05 July 2002
LAI Ring 5 = 2.13
Hertford, VA - TRANSECT C-50
05 August 2002
LAI Ring 5 = 1.88
L1443_C04.fm Page 53 Saturday, June 5, 2004 10:17 AM
© 2004 by Taylor & Francis Group, LLC
54 REMOTE SENSING AND GIS ACCURACY ASSESSMENT
The orientation of the camera can be assessed by noting the position of the large tree bole that
originates from the five-o’clock position in the image. The April 9, 2002, image places the bole
closer to the 4:30 position. However, as mentioned previously, camera orientation does not affect
whole-image calculations of LAI or canopy openness. Orientation was important only if it became
necessary to match TRAC data with a particular sector of the hemispherical photograph.
L
e
values derived by hemispherical photography increased over the course of phenological
development at the Hertford site. A decrease in L
e
from 2.13 to 1.88 was observed between the
July 25 and August 5, 2002, images. The decrease may have partly been a result of the understory
removal operation that occurred between July 25 and 30, 2002. However, decreases of this mag-
nitude were observed at other APB sites in mid to late summer, when no understory canopy removal
was performed. The Hertford site was primarily coniferous forest. Needle loss due to the extreme
drought conditions experienced in the APB study area may partially account for the observed
decrease in L
e
.
4.4.3 Satellite Remote Sensing Issues
The MODIS LAI product was produced at 1-km
2
spatial resolution. Inherent in this product
were a number of spatial factors that may contribute to uncertainty in the final accuracy of this
analysis. MODIS pixels were nominally 1 km
2
at nadir but expanded considerably as the scan
moved off nadir toward the edges of the 2330-km-wide swath. As a result, off-nadir pixels sampled
a larger area on the ground than near-nadir pixels. The compositing scheme partially compensated
for this by preferentially selecting pixels closer to nadir. Mixed pixels contained more than one LC
type. In the APB study region, the landscape exhibits varying degrees of fragmentation, producing
a mosaic of parcels on the ground. Within a 1-km
2
block, agricultural, urbanized, and forested LC
types may be mixed to such a degree that assigning a single LAI value is questionable. There were
also angular effects to consider. The NDVI and LAI products were adjusted for the bidirectional
reflectance distribution function (BRDF; MODIS product MOD43). Still, angular effects produced
by variable viewing geometry may have degraded the accuracy or interpretability of the results.
An important issue was that of spatial scaling from
in situ
reference data measurements (m
2
)
to MODIS products (1 km
2
). ETM
+
data provided the link between
in situ
measurements and
MODIS measurements. Quadrants correspond to a ground region of a 3
¥
3 ETM
+
pixel window
(90
¥
90 m), and the subplots correspond to a region of approximately 2
¥
2 pixels (60
¥
60 m).
The Landsat data were precision-registered to ground coordinates using ground control points,
providing an accuracy between 0.5 and 1 pixel. Once the
in situ
data and Landsat image were
coregistered, an ETM
+
LAI map was generated by establishing a regression relationship between
in situ
LAI and Landsat NDVI. Then, the Landsat LAI map could be generalized from a 30-m
resolution to a 1-km
2
resolution. Overall accuracy was influenced by accuracy of coregistered data
sets, interpolation methods used to expand
in situ
measurements to ETM
+
NDVI maps, and the
spatial coarsening approach applied to scale the ETM
+
imagery to the MODIS scale of 1-km
2
pixels.
4.5 SUMMARY
Research efforts at the U.S. Environmental Protection Agency’s National Exposure Research
Laboratory and National Center for Environmental Assessment include development of remote
sensing methodologies for detection and identification of landscape change. This chapter describes
an approach and techniques for estimating forest LAI for validation of the MODIS LAI product,
in the field using ground-based optical instruments. Six permanent field validation sites were
established in the Albemarle-Pamlico Basin of North Carolina and Virginia for multitemporal
measurements of forest canopy and biometric properties that affect MODIS NDVI and LAI prod-
L1443_C04.fm Page 54 Saturday, June 5, 2004 10:17 AM
© 2004 by Taylor & Francis Group, LLC
IN SITU
ESTIMATES OF FOREST LAI FOR MODIS DATA VALIDATION 55
ucts. LAI field measurements were made using hemispherical photography and TRAC sunfleck
profiling in the landscape context of vegetation associations and physiography and in the temporal
context of the annual phenological cycle. Results of these field validation efforts will contribute to
a greater understanding of phenological dynamics evident in NDVI time series and will provide
valuable data for the validation of the MODIS LAI product.
ACKNOWLEDGMENTS
The authors express their sincere appreciation to Mark Murphy, Chris Murray and Maria
Maschauer for their assistance in the field. We thank Conghe Song for sharing of field instruments,
Malcolm Wilkins for research support, Paul Ringold for providing hemispherical photographic
images for use in the quality assurance and quality control aspects of the study, and Ross Lunetta,
David Holland, and Joe Knight for assistance in study design. International Paper Corporation,
Westvaco Corporation, the states of Virginia and North Carolina, Duke University, and North
Carolina State University provided access to sampling sites. We also thank three anonymous
reviewers for helpful comments on this manuscript. The U.S. Environmental Protection Agency
funded and partially conducted the research described in this chapter. It has been subject to the
Agency’s programmatic review and has been approved for publication. Mention of any trade names
or commercial products does not constitute endorsement or recommendation for use.
REFERENCES
Avery, T.E. and H.E. Burkhart,
Forest Measurements
, 3rd ed., McGraw-Hill, New York, 1983.
Becker, M.L., R.G. Congalton, R. Budd, and A. Fried, A GLOBE collaboration to develop land cover data
collection and analysis protocols,
J. Sci. Ed. Tech.
, 7, 85–96, 2002.
Burrows, S.N., S.T. Gower, M.K. Clayton, D.S. MacKay, D.E. Ahl, J.M. Norman, and G. Diak, Application
of geostatistics to characterize leaf area index (LAI) from flux tower to landscape scales using a cyclic
sampling design,
Ecosystems
, 5, 667–679, 2002.
Burton, A J., K.S. Pregitzer, and D.D. Reed, Leaf area and foliar biomass relationships in northern hardwood
forests located along an 800-km acid deposition gradient,
For. Sci.
, 37, 1041–1059, 1991.
Canham, C.D., A.C. Finzi, S.W. Pascala, and D.H. Burbank, Causes and consequences of resource heteroge-
neity in forests: interspecific variation in light transmission by canopy trees,
Can. J. For. Res.
, 24,
337–349, 1994.
Carlson, T.N. and D.A. Ripley, On the relation between NDVI, fractional vegetation cover, and leaf area index,
Remote Sens. Environ.
, 62, 241–252, 1997.
Chason, J.W., A comparison of direct and indirect methods for estimating forest canopy leaf area,
Agric. For.
Meteorol.
, 57, 107–128, 1991.
Chen, J.M., Optically-based methods for measuring seasonal variation of leaf area index in boreal conifer
stands,
Agric. For. Meteorol.
, 80, 135–163, 1996.
Chen, J.M. and T.A. Black, Defining leaf area index for non-flat leaves,
Plant Cell Environ.
, 15, 421–429, 1992.
Chen, J.M. and T.A. Black, Measuring leaf area index of plant canopies with branch architecture,
Agric. For.
Meteorol.
, 57, 1–12, 1991.
Chen, J.M., T.A. Black, and R.S. Adams, Evaluation of hemispherical photography for determining plant area
index and geometry of a forest stand,
Agric. For. Meteorol.
, 56, 129–143, 1991.
Chen, J.M. and J. Cihlar, Plant canopy gap-size analysis theory for improving optical measurements of leaf-
area index,
Appl. Optics
, 34, 6211–6222, 1995.
Chen, J.M., P.M. Rich, S.T. Gower, J.M. Norman, and S. Plummer, Leaf area index of boreal forests: theory,
techniques, and measurements,
J. Geophys. Res.
, 102(D24), 29429–29443, 1997.
Deblonde, G., M. Penner, and A. Royer, Measuring leaf area index with the LI-COR LAI-2000 in pine stands,
Ecology
, 75, 1507–1511, 1994.
Delta-T Devices, Ltd., Hemiview User Manual (2.1), Cambridge, U.K., 1998.
L1443_C04.fm Page 55 Saturday, June 5, 2004 10:17 AM
© 2004 by Taylor & Francis Group, LLC
56 REMOTE SENSING AND GIS ACCURACY ASSESSMENT
Eidenshink, J.C. and R.H. Haas, Analyzing vegetation dynamics of land systems with satellite data,
Geocarto
Int.
, 7, 53–61, 1992.
Fassnacht, K.S. and S.T. Gower, Interrelationships among the edaphic and stand characteristics, leaf area
index, and above-ground net primary production of upland forest ecosystems in north central Wis-
consin,
Can. J. For. Res.
, 27, 1058–1067, 1997.
Fassnacht, K.S., S.T. Gower, J.M. Norman, and R.E. McMurtrie, A comparison of optical and direct methods
for estimating foliage surface area index in forests,
Agric. For. Meteorol.
, 71, 183–207, 1994.
Frazer, G.W., C.D. Canham, and K.P. Lertzman, Gap Light Analyzer (GLA): Imaging software to extract
canopy structure and gap light transmission indices from true-color fisheye photographs, users manual
and program documentation (Version 2), Simon Frazer University, Burnaby, British Columbia, Canada,
Simon Frazer University and the Institute of Ecosystem Studies, 1999.
Frazer, G.W., R.A. Fournier, J.A.Trofymow, and R.J. Hall, A comparison of digital and film fisheye photog-
raphy for analysis of forest canopy structure and gap light transmission,
Agric. For. Meteorol.
, 109,
249–263, 2001.
Geron, C.D., A.B. Guenther, and T.E. Pierce, An improved model for estimating emissions of volatile organic
compounds from forests in the eastern United States,
J. Geophys. Res.
, 99, 12773–12791, 1994.
Gholz, H.L., Environmental limits on aboveground net primary production, leaf area and biomass in vegetation
zones of the Pacific Northwest,
Ecology
, 53, 469–481, 1982.
Gower, S.T., K.A. Vogt, and C.C. Grier, Carbon dynamics of Rocky Mountain Douglas-fir: influence of water
and nutrient availability,
Ecological Monogr.
, 62, 43–65, 1992.
Huete, A., Justice, C.O., and W. van Leeuwen, MODIS Vegetation Index (MOD13) Algorithm Theoretical
Basis Document (Version 2), 1–142, 1996.
Jenkins, J.C., S.V. Kicklighter, J.D. Ollinger, J.D. Aber, and J.M. Melillo, Sources of variability in net primary
production predictions at a regional scale: a comparison using PnET-II and TEM 4.0 in Northeastern
US forests,
Ecosystems
, 2, 555–570, 1999.
Johnsen, K.H., D. Wear, R. Oren, R.O. Teskey, F. Sanchez, R. Will, J. Butnor, D. Markewitz, D. Richter, T.
Rials, H.L. Allen, J. Seiler, D. Ellsworth, C. Maier, G. Katul, and P.M. Dougherty, Meeting global
policy commitments: carbon sequestration and southern pine forests,
J. For.
, 99, 14–21, 2001.
Justice, C.O., E. Vermote, J.R.G. Townshend, R. Defries, D.P. Roy, D.K. Hall, V.V. Salomonson, J.L. Privette,
G. Riggs, A. Strahler, W. Lucht, R.B. Myneni, Y. Knyazikhin, S.W. Running, R.R. Nemani, Z. Wan,
A.R. Huete, W. van Leeuwen, R.E. Wolfe, L. Giglio, J.P. Muller, P. Lewis, and M.J. Barnsely, The
Moderate Resolution Imaging Spectroradiometer (MODIS): land remote sensing for global change
research,
IEEE Trans. Geosci. Rem. Sens.
, 36, 1228–1249, 1998.
Knyazikhin, Y., J. Glassy, J.L. Privette, Y. Tian, A. Lotsch, Y. Zhang, Y. Wang, J.T. Morisette, P. Votava, R.B.
Myneni, R.R. Nemani, and S.W. Running, MODIS Leaf Area Index (LAI) and Fraction of Photosyn-
thetically Active Radiation Absorbed by Vegetation (FPAR) Product (MOD15) Algorithm Theoretical
Basis Document, a, 1999.
Kucharik, C.J., J. M. Norman, and L.M. Murdock, Characterizing canopy nonrandomness with a multiband
vegetation imager (MVI),
J. Geophys. Res.
, 102, 29455–29473, 1997.
Leblanc, S.G., Correction to the plant canopy gap size analysis theory used by the Tracing Radiation and
Architecture of Canopies (TRAC) instrument,
Appl. Optics
, 41 (36), 7667–7670, 2002.
Leblanc, S.G., J.M. Chen, and M. Kwong,
Tracing Radiation and Architecture of Canopies: TRAC Manual
(Version 2.1.3), 3rd Wave Engineering, Nepean, Ontario, Canada, 2002.
Lunetta, R.S., J.S. Iiames, J. Knight, R.G. Congalton, and T.H. Mace, An assessment of reference data
variability using a “Virtual Field Reference Database,”
Photogram. Eng. Remote Sens.,
67, 707–715,
2001.
Masuoka, E., A. Fleig, R.E. Wolfe, and F. Patt, Key characteristics of MODIS data products,
IEEE Trans.
Geosci. Remote Sens.
, 36, 1313–1323, 1998.
Neumann, H.H., G. Den Hartog, and R.H. Shaw, Leaf area measurements based on hemispheric photographs
and leaf-litter collection in a deciduous forest during autumn leaf-fall,
Agric. For. Meteorol.
, 45,
325–345, 1989.
Privette, J.L., R.B. Myneni, Y. Knyazikhin, M. Mukelabai, G. Rogerts, Y. Tian, Y. Wang, and S.G. Leblanc,
Early spatial and temporal validation of MODIS LAI product in the Southern Africa Kalahari,
Remote
Sens. Environ
., 83, 232–243, 2002.
Rich, P.M., Characterizing plant canopies with hemispherical photographs,
Rem. Sens. Rev.,
5, 13–29. 1990.
L1443_C04.fm Page 56 Saturday, June 5, 2004 10:17 AM
© 2004 by Taylor & Francis Group, LLC
IN SITU
ESTIMATES OF FOREST LAI FOR MODIS DATA VALIDATION 57
Running, S.W., D.L. Peterson, M.A. Spanner, and K.A. Tewber, Remote sensing of coniferous forests leaf-
area,
Ecology
, 67, 273–276, 1986.
Runyon, J., R.H. Waring, S.N. Goward, and J.M. Welles, Environmental limits on net primary production and
light use efficiency across the Oregon Transect,
Ecol. Appl.
, 4, 226–237, 1994.
SAS (Statistical Analysis Software),
SAS/Graph Guide for Personal Computers
, Version 6, SAS Institute, Inc.,
Cary, NC, 1987.
Tian, Y., C.E. Woodcock, Y. Wang, J.L. Privette, N.L. Shabanov, Y. Zhang, W. Buermann, B. Veikkanen, T.
Hame, Y. Knyazikhin, and R.B. Myneni, Multiscale analysis and MODIS LAI product. II. sampling
strategy,
Remote Sens. Environ.
, 83, 431–441, 2002.
Verchot, L.V., E.C. Frankling, and J.W. Gilliam, Effects of agricultural runoff dispersion on nitrate reduction
in forested filter zone soils,
Soil Sci. Soc. Am. J.
, 62, 1719–1724, 1998.
Vogelmann, J. E., T. Sohl, S.M. Howard, and D.M. Shaw, Regional land cover characterization using Landsat
Thematic Mapper data and ancillary data sources,
Environ. Monitor. Assess.
, 51, 415–428, 1998.
Wulder, M.A., F.L. Ellsworth, S.E. Franklin, and M.B. Lavigne, Aerial image texture information in the
estimation of northern deciduous and mixed wood forest Leaf Area Index (LAI),
Remote Sens.
Environ.
, 64, 64–76, 1998.
L1443_C04.fm Page 57 Saturday, June 5, 2004 10:17 AM
© 2004 by Taylor & Francis Group, LLC