Remote Sensing and GIS Accuracy Assessment - Chapter 6 potx
Bạn đang xem bản rút gọn của tài liệu. Xem và tải ngay bản đầy đủ của tài liệu tại đây (468.89 KB, 16 trang )
75
CHAPTER
6
Participatory Reference Data Collection Methods for
Accuracy Assessment of Land-Cover Change Maps
John Sydenstricker-Neto, Andrea Wright Parmenter, and Stephen D. DeGloria
CONTENTS
6.1 Introduction 75
6.1.1 Study Objectives 77
6.1.2 Study Area 77
6.2 Methods 78
6.2.1 Imagery 78
6.2.2 Reference Data Collection 79
6.2.3 Data Processing 80
6.2.4 Image Classification 81
6.2.5 Accuracy Assessment 81
6.3 Results and Discussion 82
6.3.1 Classified Imagery and Land-Cover Change 82
6.3.2 Map Accuracy Assessment 84
6.3.3 Bringing Users into the Map 85
6.4 Conclusions 86
6.5 Summary 87
Acknowledgments 88
References 88
6.1 INTRODUCTION
Development strategies aimed at settling the landless poor and integrating Amazonia into the
Brazilian national economy have led to the deforestation of between 23 and 50 million ha of primary
forest. Over 75% of the deforestation has occurred within 50 km of paved roads (Skole and Tucker,
1993; INPE, 1998; Linden, 2000). Of the cleared areas, the dominant land-use (LU) practice
continues to be conversion to low-productivity livestock pasture (Fearnside, 1987; Serrão and
Toledo, 1990). Meanwhile, local farmers and new migrants to Amazonia continue to clear primary
forest for transitory food, cash crops, and pasture systems and eventually abandon the land as it
loses productivity. Though there are disagreements on the benefits and consequences of this practice
L1443_C06.fm Page 75 Saturday, June 5, 2004 10:21 AM
© 2004 by Taylor & Francis Group, LLC
76 REMOTE SENSING AND GIS ACCURACY ASSESSMENT
from economic, agronomic, and environmental perspectives, there is a need to link land-cover (LC)
change in Amazonia with more global externalities.
Rehabilitating the productivity of abandoned pasture lands has the potential to convert large
areas from sources to sinks of carbon (C) while providing for the well-being of people in the region
and preserving the world’s largest undisturbed area of primary tropical rainforest (Fernandes et al.,
1997). Primary forests and actively growing secondary forests sequester more C, cycle nutrients
more efficiently, and support more biodiversity than abandoned pastures (Fearnside, 1996; Fearnside
and Guimaraes, 1996). Results from research on LU options for agriculture in Amazonia point to
agrosilvopastoral LU systems involving rotations of adapted crops, pasture species, and selected
trees as being particularly appropriate for settlers of western Amazonia (Sanchez and Benites, 1987;
Szott et al., 1991; Fernandes and Matos, 1995). Coupled with policies that encourage the sustain-
ability of these options and target LU intensifications, much of the vast western Amazonia could
be preserved in its natural state (Sanchez, 1987; Vosti et al., 2000).
Many studies have focused on characterizing the spatial extent, pattern, and dynamics of
deforestation in the region using various forms of remotely sensed data and analytical methods
(Boyd et al., 1996; Roberts et al., 1998; Alves et al., 1999; Peralta and Mather, 2000). Given the
importance of secondary forests for sequestering C, the focus of more recent investigations in the
region has been on developing spectral models and analytical techniques in remote sensing to
improve our ability to map these secondary forests and pastures in both space and time, primarily
in support of global C modeling (Lucas et al., 1993; Mausel et al., 1993; Foody et al., 1996;
Steininger, 1996; Asner et al., 1999; Kimes et al., 1999).
The need to better integrate the human and biophysical dimensions with the remote sensing of
LC change in the region has been reported extensively (Moran et al., 1994; Frohn et al., 1996;
Rignot et al., 1997; Liverman et al., 1998; Moran and Brondizio, 1998; Rindfuss and Stern, 1998;
Wood and Skole, 1998; McCracken et al., 1999; Vosti et al., 2000; -
bonn.de/ihdp/lucc/). Most investigations that integrate remote sensing, agroecological, or socioeco-
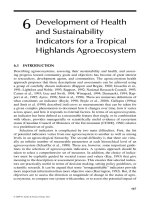
Plate 6.1
(See color insert following page 114.) Land-cover classification for three time periods between
1986 and 1999.
1986 MSS
N
1994 TM 1999 ETM
Kilometers
Scale 1:75,000
Parcel Boundaries
Secondary Forest
Forest
Crops
Pasture
Bare Soil
Water
Transition
101
L1443_C06.fm Page 76 Saturday, June 5, 2004 10:21 AM
© 2004 by Taylor & Francis Group, LLC
PARTICIPATORY REFERENCE DATA COLLECTION METHODS FOR ACCURACY ASSESSMENT 77
nomic dimensions focus on the prediction of deforestation rates and the estimation of land-
cover/land-use (LCLU) change at a regional scale.
Local stakeholders have seldom been involved in remote sensing research in the area. This is
unfortunate because municipal authorities and local organizations represent a window of opportu-
nity to improve frontier governance (Nepstad et al., 2002). These stakeholders have been increas-
ingly called upon to provide new services or fill gaps in services previously provided by federal
and state government. Small-scale farmer associations are key local organizations because some
of the obstacles to changing current land use patterns and minimizing deforestation cannot be
instituted by farmers working individually but are likely to require group effort (Sydenstricker-
Neto, 1997; Ostrom, 1999).
6.1.1 Study Objectives
The objectives of our study were to: (1) determine LC change in the recent colonization area
(1986–1999) of Machadinho D’Oeste, Rondonia, Brazil; (2) engage community stakeholders in
the processes of mapping and assessing the accuracy of LC maps; and (3) evaluate the relevance
of LC maps (inventory) for understanding community-based LU dynamics in the study area. The
objectives were defined to compare stakeholder estimates and perceptions of LC change in the
region to what could be measured through the classification of multispectral, multitemporal,
remotely sensed data. We were interested in learning whether there would be increased efficiencies,
quality, and ownership of the inventory and evaluation process by constructively engaging stake-
holders in local communities and farmer associations. In this chapter, we focus our presentation
on characterizing and mapping LC change between 1994 and 1999.
6.1.2 Study Area
Established in 1988, the municipality of Machadinho D’Oeste (8502 km
2
) is located in the
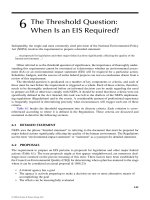
northeast portion of the State of Rondonia, western Brazilian Amazonia (Figure 6.1). The village
of Machadinho D’Oeste is 150 km from the nearest paved road (BR-364 and cities of Ariquemes
and Jaru) and 400 km from Porto Velho, the state capital. When first settled, the majority of the
area was originally composed of untitled public lands. A portion of the area also included old,
privately owned rubber estates (
seringais
), which were expropriated (Sydenstricker-Neto, 1992).
The most recent occupation of the region occurred during the mid-1980s with the development
of the Machadinho Colonization Project (PA Machadinho) by the National Institute for Colonization
and Agrarian Reform (INCRA). In 1984, the first parcels in the south of the municipality were
delivered to migrant farmers, and since then the area has experienced recurrent migration inflows.
From hundreds of inhabitants in the early 1980s, Machadinho’s 1986 population was estimated to
be 8,000, and in 1991 it had increased to 16,756 (Sydenstricker-Neto and Torres, 1991; Syden-
stricker-Neto, 1992; IBGE, 1994). In 2000, the demographic census counted 22,739 residents. This
amounted to an annual population increase during the decade of the 1990s of 3.5%. Although
Machadinho is an agricultural area by definition, 48% of its population lives in the urban area
(IBGE, 2001).
Despite the importance of colonization in Machadinho, forest reserves comprise 1541 km
2
, or
18.1%, of its area. Most of these reserves became state extractive reserves in 1995, but there are
also state forests for sustained use. Almost the entire area of the reserves is covered with primary
forest (Olmos et al., 1999).
In biophysical terms, Machadinho’s landscape combines areas of altiplano with areas at lower
elevation between 100 and 200 m above sea level. The major forest cover types are tropical
semideciduous forest and tropical flood plain forest. The weather is hot and humid with an average
annual temperature of 24
∞
C and relative humidity between 80 and 85%. A well-defined dry season
occurs between June and August and annual precipitation is above 2000 mm. The soils have medium
L1443_C06.fm Page 77 Saturday, June 5, 2004 10:21 AM
© 2004 by Taylor & Francis Group, LLC
78 REMOTE SENSING AND GIS ACCURACY ASSESSMENT
to low fertility and most of them require high inputs for agriculture development
(EMBRAPA/SNLCS, 1982; Brasil, MIRAD-INCRA e SEPLAN – Projeto RADAMBRASIL, 1985).
The study area is 215,000 ha and is divided between the municipalities of Machadinho D’Oeste
(66%) and the north of Vale do Anari (34%). It includes more recent colonization areas, but its
core comprises the first phase (land tracts 1 and 2) of the former Machadinho Settlement settled
in 1984 and 1985. These two land tracts have a total area of 119,400 ha. The land tracts have
multiple uses: 3,000 ha are designated for urban development, 35,165 ha are in extractive reserves,
and 81,235 ha are divided into 1,742 parcels (average size 46 ha) distributed to migrant farmers
by INCRA (Sydenstricker-Neto, 1992).
6.2 METHODS
6.2.1 Imagery
Landsat Multi-Spectral Scanner (MSS), Thematic Mapper (TM), and Enhanced Thematic Map-
per (ETM
+
) digital images were acquired for the study area (path 231/row 67) for one date in 1986,
1994, and 1999. The 1994 and 1999 TM images were 30-m resolution and the 1986 MSS image
was resampled to 30 m to match the TM images. The images were acquired during the dry season
(July or August) of each year to minimize cloud cover. The Landsat images used for LC analysis
were the best available archived scenes.
The 1986 MSS image (August 10) and the 1999 ETM
+
image (August 6) were obtained from
the Tropical Rainforest Information Center (TRFIC) at Michigan State University. The 1994 TM
image (July 15) was provided by the Center for Development and Regional Planning (CEDEPLAR)
at the Federal University of Minas Gerais (UFMG) in Brazil. Although a TM image for the 1986
date was available, random offset striping made this scene unusable. The MSS image acquired on
the same date was used instead, though thin clouds obscured part of the study area.
Figure 6.1
Legal Amazonia, Rondonia, and study area, Brazil.
Machadinho D Oeste and Vale do Anari
Rondonia
Legal Amazonia
Area
Village of
Machadinho
Study Area
50 0 50
Scale 1:2,500,000
Kilometers
N
Machadinho D Oeste
Vale do Anari
L1443_C06.fm Page 78 Saturday, June 5, 2004 10:21 AM
© 2004 by Taylor & Francis Group, LLC
PARTICIPATORY REFERENCE DATA COLLECTION METHODS FOR ACCURACY ASSESSMENT 79
The geometrically corrected 1999 ETM
+
image provided by TRFIC had the highest geometric
accuracy as determined using Global Positioning System (GPS) coordinates collected in the field
and resulting in a root mean square error (RMSE) of less than one pixel. Therefore, we coregistered
the 1986 and 1994 images to the “base” 1999 ETM
+
image using recognizable fixed objects (such
as road intersections) in ERDAS Imagine 8.4. We used nine “fixed” locations, known as ground
control points (GCPs), to register both images. For the 1986 and 1994 MSS images, the RMSEs
were 0.54 and 0.47 pixels, respectively.
Additional image processing included the derivation of tasseled-cap indices for each image.
Tasseled-cap transformed spectral bands 1, 2, and 3 (indices of brightness, greenness, and wetness,
respectively) were calculated for the TM images using Landsat-5 coefficients published by Crist
et al. (1986). Although Huang et al. (2002) recommended using a reflectance-based tasseled-cap
transformation for Landsat 7 (ETM
+
) based on at-satellite reflectance, those recommended tasseled-
cap coefficients for Landsat 7 were not published at the time of this study. Tasseled-cap bands 1
and 2 (brightness and greenness) were calculated for the MSS image using coefficients published
by Kauth and Thomas (1976). These investigators have shown tasseled-cap indices to be useful in
differentiating vegetation types on the landscape, and the tasseled-cap indices were therefore
included in this analysis of mapping LC. Image stacks of the raw spectral bands and tasseled-cap
bands were created in ERDAS Imagine 8.4. This resulted in one 6-band image for 1986 (MSS
spectral bands 1, 2, 3, 4, and tasseled-cap bands 1 and 2), a 10-band image for 1994 (TM spectral
bands 1–7 and tasseled-cap bands 1, 2, and 3), and an 11-band image for 1999 (ETM
+
spectral
bands 1–8 and tasseled-cap bands 1–3). The 15-m panchromatic band in the 1999 ETM
+
image
was not used in this analysis.
6.2.2 Reference Data Collection
As in many remote areas in developing countries, data sources for producing and assessing
accuracy of LC maps for our study area were limited. Upon project initiation (2000) no suitable
LC reference data were available. Historical aerial photographs were not available for discriminating
between LC types for our study area. In this context, satellite imagery was the only spatially
referenced data source for producing reliable LC maps for the area.
Because we wanted to document LC change from the early stages of human settlement and
development (beginning in 1985), when major forest conversion projects were established, our
objective was to compile retrospective data to develop and validate a time series of LC maps. The
challenge of compiling retrospective data became an opportunity to engage community stakeholders
in the mapping process and “bring farmers into the map.” We decided to enlist the help of farmers,
who are very knowledgeable about land occupation practices and the major forces of land use
dynamics, to be our source for contemporary and retrospective data collection. Also, by engaging
the locals early in the process, we could examine the advantages and limitations of this strategy
for future resource inventory projects in the region conducted by researchers and local stakeholders.
We utilized a seven-category LC classification scheme as defined in Table 6.1. The level of
detail of this classification scheme is similar to that of others used in the region and should permit
some level of comparative analysis with collaborators and stakeholders (Rignot et al., 1997; de
Moraes et al., 1998).
In August 2000, with the assistance of members of nine small-scale farmer associations in the
study area, we collected field data to assist in the development of spectral models of each cover
type for image classification and to validate the resulting LC maps. All associations that we
contacted participated in the mapping project. Initially, we met with the leadership of each asso-
ciation and presented our research goals and objectives, answered questions, and invited members
of each association to participate in the study. After developing mutual trust and actively engaging
the association, data collection groups were formed averaging 12 individuals per association (total
over 100 individuals). Special effort was made to include individuals in each group who were long-
L1443_C06.fm Page 79 Saturday, June 5, 2004 10:21 AM
© 2004 by Taylor & Francis Group, LLC
80 REMOTE SENSING AND GIS ACCURACY ASSESSMENT
term residents and who were knowledgeable about historical LU practices in the region. Nearly
half of the members in each of the nine groups were farmers who settled prior to 1986.
An introductory meeting was conducted with each group to provide a hard copy (false-color
composite) of the 1999 ETM
+
image with parcel boundaries overlaid and to solicit comments and
observations regarding farm locations, significance of color tones on the image, and clarification
of LU practices and associated cover types. All participants were then asked to indicate retrospective
and current LU for their parcels and for other parcels with which they were familiar. Any questions
that could not be answered by individuals were referred to the group for discussion, elaboration,
and decision making. For each identified cover type, we annotated and labeled polygons on stable
acetate overlaid on the false-color composite image. Each polygon consisted of a homogeneous
area labeled as one of seven LC types for each year corresponding to the dates of the Landsat
images used in the study.
Notes were taken during the interview process to indicate the date each farmer started using
the land, areas of the identified LC types for each of the 3 years considered in the study (1986,
1994, 1999), changes over time, level of uncertainty expressed by participants while providing
information for each annotated polygon, and other information farmers considered relevant. After
each meeting, the research team traveled the main roads in the area just mapped by the farmer
association and compared the identified polygons with what could be observed. The differences
between the cover type provided by the farmers and what was observed were minimal. In areas
where such meetings could not be organized, the research team traveled the feeder roads and
annotated the contemporary LC types that could be confidently identified.
Field data were collected for over 1500 polygons, including all seven LC types of interest. We
considered this to be an adequate sample for image classification and validation of our maps.
Although an effort was made to ensure all land cover types were well represented in the database,
some types such as bare soil were represented by a relatively small sample sizes (
n
< 200 pixels).
6.2.3 Data Processing
More than 1000 polygons identified during the farmer association interviews were screen-
digitized and field notes about the polygons were compiled into a table of attributes. Independent
random samples of polygons for each of the seven land-cover types were selected for use in image
classifier training and land-cover map validation. Although the number of homogenous polygons
annotated in the field was large, polygons varied greatly in size from
<
5 to
>
1000 ha and were
not evenly distributed among the seven cover types (Table 6.2). For cover types that had a large
number of polygons, half of the polygons were used for classifier training and half for map
validation. For two cover types, however, the polygon samples were so large in area (and therefore
contained so many pixels) that they could not be used effectively because of software limitations.
The primary forest and pasture cover type polygons were therefore randomly subdivided so that
only one half of the pixels were set aside for both classifier training and for map validation (i.e.,
one quarter of the total eligible data pixels were used for each part of the analysis). However, this
approach did not yield a sufficient number of sample polygons for some of the more rare cover
Table 6.1
Land-Cover Classification Scheme and Definitions
Land Cover Definition
Primary forest Mature forest with at least 20 years growth
Secondary forest Secondary succession at any height and less than 20 years growth
Transition Area recently cleared, burned, or unburned and not currently in use
Pasture Area planted with grass, ranging from overgrazed to bushy
Crops Area with agriculture, including perennial and annual crops
Bare soil Area with no vegetation or low, sparse vegetation
Water Waterbody, including major rivers, water streams, and reservoirs
L1443_C06.fm Page 80 Saturday, June 5, 2004 10:21 AM
© 2004 by Taylor & Francis Group, LLC
PARTICIPATORY REFERENCE DATA COLLECTION METHODS FOR ACCURACY ASSESSMENT 81
types (i.e.,
<
1% land area). To address this issue, we randomly sampled individual pixels within
these polygons of the rare cover types and equally partitioned the pixels into the two groups used
for classifier training and map validation.
6.2.4 Image Classification
Spectral signature files were generated to be used in supervised classification using a maximum
likelihood algorithm. The spectral signatures included both image and tasseled-cap bands created
for each image of each analysis year. LC maps were produced for each of the 3 years containing
all seven LC types in each of the resulting maps. Postclassification 3
¥
3 pixel majority convolution
filter was applied to all three LC maps to eliminate some of the speckled pattern (noise) of individual
pixels. The result of this filter was to eliminate pixels that differed in LC type from their neighbors,
which tended thereby to eliminate both rare cover types and those that exist in small patches on
the landscape (such as crops). However, we concluded that the filtering process introduced an
unreasonable amount of homogeneity onto the landscape and obscured valuable information
relevant to the spatial pattern of important cover types within our unit of analysis, which was the
land parcel. All subsequent analyses were performed on the unfiltered LC maps for all three dates
of imagery.
6.2.5 Accuracy Assessment
We assessed the accuracy of the three LC maps at the pixel level using a proportional sampling
scheme based on the distribution of validation sample points (pixels) for each of the cover types
in the study. This methodology was efficiently applied in this study because the distribution of our
field-collected validation sample points was representative of the distribution in area of each cover
type in the study area (Table 6.2).
The proportional sample of pixels used for the accuracy assessment for each year was selected
by first taking into account the cover type having the smallest area based on the number of validation
pixels we had for that cover type. Once the number of pixels in the validation data set was determined
for the cover type occupying the smallest area, the total number of validation pixels to be used for
each analysis year was calculated by the general formula:
S
t
=
N
s
/
P
s
(6.1)
where
S
t
= the total number of validation pixels to be sampled for use in accuracy assessment,
N
s
= the number of pixels in the land cover type with the smallest number of validation pixels, and
P
s
= the proportion of the classified map predicted to be the cover type with the smallest amount
of validation pixels.
Table 6.2
Number of Pixels Sampled for Classifier Training and Map
Validation for the 1999 Image
Land-Cover
Class
Total No.
of Polygons
Total No.
of Pixels
No. of Pixels/Polygons
Mean Variance
Forest 189 16,755 89 5,349
Secondary forest 108 3,060 28 401
Transition 43 10,054 33 917
Crops 306 2,693 63 1,358
Pasture 261 4,496 17 120
Bare soil 17 140 8 18
Water 106 1,705 16 244
Total 1,030 38,903 38 2,089
L1443_C06.fm Page 81 Saturday, June 5, 2004 10:21 AM
© 2004 by Taylor & Francis Group, LLC
82 REMOTE SENSING AND GIS ACCURACY ASSESSMENT
The total number of validation pixels to be used to assess the accuracy for each cover type was
then calculated by the general formula:
V
c
=
S
t
¥
P
c
(6.2)
where
V
c
= the total number of validation pixels to be used for a specific cover type,
S
t
= the total
number of validation pixels to be sampled for use in accuracy assessment, and
P
c
= the proportion
of the classified map predicted to be that cover type.
To illustrate this proportional sampling accuracy method, we describe the forest cover type for
the 1999 map. The cover type with the smallest number of validation pixels in 1999 was the bare
soil cover type with a total of 79 validation pixels (
N
s
). Of the total number of pixels in the 1999
classified map (8,970,395), the bare soil cover type was predicted to be 201,267 pixels, or a
proportion of 0.0224 of the total classified map (
P
s
). Using Equation 6.1 above, the resulting sample
size of validation pixels to be used for accuracy assessment of the 1999 LC map (
S
t
) was 3,521
pixels. In the 1999 map, the forest cover type was predicted to cover 68.6% of the classified map
(i.e., 6,155,275 pixels out of 8,970,395 total pixels). Using Equation 6.2 above, the sample size of
validation pixels to be used for the forest cover type (
V
c
) was then 2,414 (i.e. 3,521
¥
0.686).
Once the validation sample sizes were chosen for each cover type, a standard accuracy assess-
ment was performed whereby the cover type of each of the validation pixels was compared with
the corresponding cover type on the classified map. Agreement and disagreement of the validation
data set pixels with the pixels on the classified map were calculated in the form of an error matrix
wherein the producer’s, user’s, and overall accuracy were evaluated.
6.3 RESULTS AND DISCUSSION
6.3.1 Classified Imagery and Land-Cover Change
Presentation and discussion of accuracy assessment results will focus only on the 1994 and
1999 LC maps. (The 1986 map was not directly comparable because it was based on coarser
resolution and resampled MSS data and because it contained cirrus cloud cover over parts of the
study.) A visual comparison of 1986–1999 LC maps shows significant change. Plate 6.1 presents
the classified imagery with parcel boundaries overlaid for a portion of the study area near one of
the major feeder roads. In 1986, approximately 2 years after migrant settlement, only some initial
clearing was observed near roads; however, 13 years later (1999) there were significant open areas
and only a small number of parcels that remained mostly covered with primary forest. The extensive
deforestation illustrated in Plate 6.1 is confirmed by the numeric data presented in Table 6.3. In
1994, 147,380 ha, or 68.5% of the total study area (215,000 ha), was covered in primary forest.
Table 6.3
Land-Cover Change in Study Area, Rondonia 1994–1999
Class
Area (ha)
Change in Area
1994–1999 (ha)
Percentage of Area
Percentage of
Change 1994–19991994 1999 1994 1999
Forest 147,380 117,573 –29,806 68.5 54.6 –20.2
Secondary forest 27,759 30,732 2,973 12.9 14.3 10.7
Transition 2,234 5,555 3,321 1.0 2.6 148.6
Crops 12,072 27,833 15,760 5.6 12.9 130.5
Pasture 16,253 22,386 6,133 7.6 10.4 37.7
Bare soil 5,183 6,823 1,640 2.4 3.2 31.6
Water 4,251 4,252 1 2.0 2.0 0.0
Total 215,132 215,154 100.0 100.0
L1443_C06.fm Page 82 Saturday, June 5, 2004 10:21 AM
© 2004 by Taylor & Francis Group, LLC
PARTICIPATORY REFERENCE DATA COLLECTION METHODS FOR ACCURACY ASSESSMENT 83
The amount of primary forest decreased in 1999 by 30,000 ha, a negative change of 20.2% in
primary forested area. The area of deforestation observed between 1994 and 1999 was more than
twice that estimated for the 1986 to 1994 period (not shown). This represented a 4.5 times increase
compared to the 1986–1994 deforestation rate. Table 6.3 presents the change in LC for 1994–1999
as both percentage of area and percentage of change.
All the nonforest cover types increased in area between 1994 and 1999. This was largely at the
expense of primary forest. Increases in secondary forest had the dominant “gain” in area during
this period, with a total increase in area of almost 31,000 ha in 1999, followed by slightly smaller
increases in crops and pasture (27,832 ha and 22,386 ha, respectively). The most significant
increases on a proportional basis occurred with the crops and pasture cover types; both increased
over 200% during this time period.
The increase in pasture area was inflated by a tremendous deforestation event totaling approx-
imately 5000 ha in 1995 in the southeastern portion of the study site. Subsequent to clearing, the
area was partially planted with grass and later divided into small-scale farm parcels in 1995 to
1996, creating a new settlement called Pedra Redonda. The most important and broadly distributed
crop among the small-scale farms was coffee
(Coffea robusta)
, which received special incentives
through subsidized federal government loans and the promotional campaign conducted by the State
of Rondonia “Plant Coffee” (1995 to 1999).
The LC change matrix provides more detailed change information, including the distribution
of deforested areas into different agricultural uses (Table 6.4). For 1994 to 1999 we determined
that 61.1% of the area did not undergo LC change. This metric was calculated by summing the
percentages along the major diagonal of the matrix. Note that primary forest showed the greatest
decrease in area while concurrently exhibiting the largest area unchanged (48.9%), due to the large
area occupied by this cover type. For the remaining cover types, the change was significantly greater
(as shown throughout the diagonal of the matrix) because of the proportionally smaller area occupied
by these cover types.
The 8.3% conversion rate of primary forest to secondary forest indicates that some recently
deforested areas remained in relative abandonment, allowing vegetation to partially recover in a
relatively short period of time (Table 6.4). An increase in classes such as transition and bare soil
also indicates the same trend of new areas incorporated into farming and their partial abandonment
as well. Of areas that were primary and secondary forest in 1994, crops were the most dominate
change category (> 8%) followed by pasture (
<
4%). While the change in LC mapped from the
image classification fits with what we expect to see in the region, it is important to differentiate
(when possible) real change from misclassification. Potential errors associated with the mapping
are discussed below.
Table 6.4
Land-Cover Change Matrix and Transitions in Study Area, Rondonia 1994–1999
1994
1999
Total
percentage
Total
area (ha)Forest
Sec.
Forest Transition Crops Pasture
Bare
Soil Water
Forest 48.9
8.3 1.8 5.9 2.3 1.2 0.0 68.5 147,380
Sec. forest
4.8
3.5
0.3 2.5 1.3 0.5 0.0 12.9 27,759
Transition
0.1 0.2
0.0
0.4 0.2 0.1 0.0 1.0 2,234
Crops
0.3 1.2 0.2
2.1
1.4 0.4 0.0 5.6 12,072
Pasture
0.2 0.7 0.1 1.3
4.5
0.8 0.0 7.6 16,253
Bare soil
0.3 0.4 0.1 0.8 0.7
0.2
0.0 2.4 5,183
Water
0.0 0.0 0.0 0.0 0.0 0.0
2.0
2.0 4,251
Total percentage
54.6 14.3 2.6 12.9 10.4 3.2 2.0 100.0
Total area (ha)
117,553 30,731 5,554 27,833 22,386 6,823 4,252 215,132
Note:
No change 1994–1999: 61.1%.
L1443_C06.fm Page 83 Saturday, June 5, 2004 10:21 AM
© 2004 by Taylor & Francis Group, LLC
84 REMOTE SENSING AND GIS ACCURACY ASSESSMENT
6.3.2 Map Accuracy Assessment
The user’s accuracy is summarized in Table 6.5. The increase in overall map accuracies for each
subsequent year in the analysis was attributed to several factors. First, we used three different sensors
(MSS, TM, and ETM
+
), which introduced increased spatial and spectral resolution of the sensors
over time. Second, the 1986 MSS image had clouds that introduced some classification errors. Third,
collecting retrospective data was a challenge because interviewees sometimes had difficulty recalling
LC and associated LU practices over the study period. In general, retrospective LU information had
a higher level of uncertainty than for time periods closer to the date of the interview.
Despite these difficulties, however, overall accuracy was between 85 and 89% for 1986 and
1999, respectively. Accuracy for specific classes ranged between 50 and 90%, achieving
≥
96%
for primary forest in 1999. Some bare soil (1999) and crops (1986) classes were particularly difficult
to map and attained accuracies below 30%. The sample size for these particular cover types was
relatively small, which may have contributed to this poor outcome. When coupled with the fact
that areas of bare soil and crops tend to be small in the study area (
£
1.0 ha), the lower accuracies
were not unexpected for these classes. Error matrices for 1994 and 1999 are presented in Tables
6.6 and 6.7, respectively. The overall accuracy for 1999 was 89.0% (Kappa 0.78). With the exception
of bare soil, all the remaining classes had user’s accuracies that ranged from 57.5 to 96.7% and
producer’s accuracies between 66.5 and 100.0%. The overall accuracy for the 1994 land-cover map
was 88.3%. In general, accuracy for specific cover types ranges between 50 and 90%, achieving a
high of 96.7% for primary forest in 1999. The bare soil (1999) accuracy was below 30%; however,
the limited proportion of training sample pixels relative to the total amount of pixels comprising
the study area for this specific class may have contributed to this poor outcome.
Table 6.5 User’s Accuracy in Study Area,
Rondonia 1986–1999
Classified Data 1986 1994 1999
Forest 89.8% 93.5% 96.7%
Secondary forest 45.5% 63.1% 77.4%
Transition 42.9% 75.0% 57.5%
Crops 25.0% 53.6% 67.5%
Pasture 80.0% 77.5% 89.6%
Bare Soil — 66.7% 28.7%
Water 100.0% 100.0% 93.6%
Overall accuracy 84.6% 88.3% 89.0%
Kappa statistic 0.52 0.69 0.78
Table 6.6
Error Matrix for the Land-Cover Map in Study Area, Rondonia 1994
Classified Data
Reference Data
User’s
AccuracyForest
Sec.
Forest Transition Crops Pasture
Bare
Soil Water Total
Forest 1218
76 0 5 0 1 3 1303 93.5%
Secondary forest
40
82
0 6 1 1 0 130 63.1%
Transition
00
9
3 0 0 0 12 75.0%
Crops
915 1
30
0 1 0 56 53.6%
Pasture
15 0 0 6
79
1 1 102 77.5%
Bare soil
40 0 5 0
18
0 27 66.7%
Water
00 0 000
25
25 100.0%
Total
1286 173 10 55 80 22 29 1655
Producer’s accuracy
94.7% 47.4% 90.0% 54.6% 98.8% 81.8% 86.2%
Note:
Overall classification accuracy = 88.3%. Kappa statistic = 0.69.
L1443_C06.fm Page 84 Saturday, June 5, 2004 10:21 AM
© 2004 by Taylor & Francis Group, LLC
PARTICIPATORY REFERENCE DATA COLLECTION METHODS FOR ACCURACY ASSESSMENT 85
The pattern of misclassification and confusion between LC classes is similar for both the 1994
and 1999 error matrices (Table 6.6 and Table 6.7), although different image sensors (TM and ETM
+
)
were used. Confusion between primary and secondary forest was expected because our classification
scheme did not separate secondary forest for different successional stages. Some of the polygons
delineated in the field as secondary forest exceeded 12 years of regrowth and closely resembled
semideciduous primary forest. Accordingly, there was probably some spectral overlap between “old”
secondary forest and the semideciduous primary forest. Confusion between secondary forest and
crops occurred because many coffee areas were shaded with native species such as rubber tree
(Hevea
brasiliensis)
, freijó
(Cordia goeldiana)
, and Spanish cedar
(Cedrela odorata,)
or included pioneer
species such as embaúba
(Cecropia
spp.). Therefore, shaded crops appeared as partially forested areas.
Despite the lack of homogeneity within the “transition” LC class, confusion with other cover
types (crops, pasture, and bare soil) was minimal. Confusion most likely occurred because the
transition cover type was not particularly unique (Table 6.6 and Table 6.7). The confusion seen in
the error matrices between pasture and bare soil and the confusion between bare soil and recently
planted coffee areas were expected. Overgrazed pasture had little vegetative matter, allowing these
areas easily to be misclassified as bare soil. Also, it was unlikely that spectral reflectance by coffee
plants less than 0.5 m tall planted in a 3-
¥
3-m spacing was detected and discriminated from the
surrounding soil background, resulting in confusion between young coffee and bare soil. Water,
although spectrally distinct, was easily biased along edge pixels. This was particularly true in the
case of small and circuitous watercourses in mixed systems.
6.3.3 Bringing Users into the Map
Initially, the local farmers expressed substantial distrust and skepticism about the mapping
project; however, trust was established throughout the mapping process and a good working rela-
tionship was established. To best present our findings, we organized community meetings in the
areas of the farmer associations involved earlier in the process. Participation in these meetings ranged
from as few as six individuals to packed rooms with more than 30 people. These meetings inten-
tionally included the broader community and farmers who had not taken part in the data collection.
Each farmer that had provided input during the data collection phase of the study received a color
copy of the 1999 LC mapping results. Additional meetings were arranged with agricultural extension
agents, leaders of the local rural labor union, municipal officials, and middle school students.
Upon examination, farmers provided verbal confirmation of our estimates and errors. Specific
concerns closely resembled the classification errors shown in the accuracy assessment matrices
(Table 6.6 and Table 6.7). More than 30 farmers who did not participate in the data collection
process compared their estimates of LC for their individual parcels to the statistics generated from
Table 6.7
Error Matrix for the Land-Cover Map in Study Area, Rondonia 1999
Classified Data
Reference Data
User’s
AccuracyForest
Sec.
Forest Transition Crops Pasture
Bare
Soil Water Total
Forest 2370
73 0 3 0 0 6 2452 96.7%
Secondary forest
44
233
0 12 8 4 0 301 77.4%
Transition
00
54
19 5 16 0 94 57.5%
Crops
058 0
206
14 21 6 305 67.5%
Pasture
07 0 5
198
9 2 221 89.6%
Bare soil
00 0 64 7
29
1 101 28.7%
Water
02 0 1 00
44
47 93.6%
Total
2414 373 54 310 232 79 59 3521
Producer’s accuracy
98.2% 62.5% 100.0% 66.5% 85.3% 36.7% 74.6%
Note:
Overall classification accuracy = 89.0%. Kappa statistic = 0.78.
L1443_C06.fm Page 85 Saturday, June 5, 2004 10:21 AM
© 2004 by Taylor & Francis Group, LLC
86 REMOTE SENSING AND GIS ACCURACY ASSESSMENT
the LC maps. In all cases, the general patterns were the same and differences in LC class areas
were small. Relevant ideas provided by local farmers were that the map provided a common ground
to engage participants in a discussion on environmental awareness and appreciation and that the
maps became an instrument of empowerment to local communities. For example, farmers were
shocked at the significant changes in LC over time for the whole area (1994 to 1999). This stimulated
a debate on the incentives for forest conversion vs. the constraints imposed by the agricultural
systems adopted by farmers.
Areas with perennial crops increased dramatically over the years of the study, with coffee
becoming the single most important cash crop. Consequently, farmers tended to decrease the amount
of land planted with annual subsistence crops such as rice, maize, beans, and cassava. As a result,
food security became an issue for some communities. Although new areas would typically come
into production within 2 years, the incentives were to expand areas of pasture. An important
economic incentive was the dramatic drop in coffee prices worldwide. In the 2001–2002 season,
sale prices of coffee in Machadinho D’Oeste were only half of the market value 2 years earlier.
Many small farms were not entirely harvested and many farmers reported that they were very
inclined to change areas with old coffee trees into pasture. However, the decline in coffee prices
motivated enlightened discussions on the economic and environmental dangers of converting most
of the land into pasture.
The importance of common forest reserves in the region and the potential and constraints of
fostering forest conservation were discussed extensively. There was great appreciation for the fact
that the map clearly indicated that the major water resources were within the forest reserves that
had not been cleared. Identification of secondary forest along major water streams within the settled
areas stimulated a debate on stream bank erosion and nutrient loss into rivers. The general agreement
was that farmers went too far in clearing the land and needed to focus efforts on reforesting the
areas around the rivers. Farmers voiced the reasons, incentives, and constraints they face in trying
to deliberately reforest areas along the water streams. In most of the reported cases of forest
recovery, natural regrowth was happening, rather than seeded reforestation. The reported lack of
available water in areas in which farmers had irrigated their coffee was a surprise to the researchers.
Two outcomes contributed greatly to farmer empowerment. First, our map offered a synoptic
perspective of development patterns that farmers had not entirely realized previously. Farmers felt
that having a deeper knowledge of what was happening in their area would enable them to better
respond to local needs and contribute to statewide discussions on promoting environmental sus-
tainability. Second, farmers voiced the collective opinion that their participation in the mapping
project contributed to better organizing themselves into interest groups. The explicit acknowledg-
ment in the LC map legends of the local associations’ contributions was a source of pride within
the broader community.
6.4 CONCLUSIONS
Visual inspection and comparison of LC maps with other data sources enabled us to conclude
that our efforts provided good estimation of LC change in the study area. The study area changed
over the 13-year study period from a typical new colonization area in its early stage, where higher
proportions of forests and areas in transition dominate, to one in which these cover types are
diminished in area in comparison to the proportional increase in crops and pasture. Statistically
based evaluations (error matrices) demonstrated acceptable levels of accuracy with classification
errors that were easily explainable and understandable. Participation and input from local farmers
was very useful in producing cover maps and proved to be an extremely effective means for
collecting classifier training and validation data in areas where other sources were not available.
Follow-up meetings with farmers were very constructive for addressing conservation issues with
regional and global implications.
L1443_C06.fm Page 86 Saturday, June 5, 2004 10:21 AM
© 2004 by Taylor & Francis Group, LLC
PARTICIPATORY REFERENCE DATA COLLECTION METHODS FOR ACCURACY ASSESSMENT 87
Study weaknesses included the intrinsic limitations imposed by the use of the different satellite
sensors (i.e., MSS, TM, and ETM
+
). Also, reference data sizes for some cover classes were relatively
small and interviewees expressed greater levels of uncertainty in retrospective data reconstruction
than for the current time period. Despite these constraints in data collection, we were confident
that they did not represent an extra burden compared to the challenge of obtaining good levels of
agreement among remote sensing specialists when using other techniques such as high-resolution
videography. The application of an integrated field data collection process would have enhanced
the quality of our data. Such an integrated process would comprise simultaneous collection of
remotely sensed ground data and household socioeconomic surveys on LU/LC to facilitate direct
comparison between data sources.
The level of detail of our classification scheme was similar to that used by other investigators
in the region, and our map accuracies compared favorably with their results (Rignot et al., 1997;
de Moraes et al., 1998). For local stakeholders, however, our classification scheme was not suffi-
ciently detailed. Stakeholders would most like to clearly distinguish specialty crops such as cacao,
coffee, and shade coffee, which would not be practical with the resolution of these data sets.
6.5 SUMMARY
This study assessed LC change in a recent colonization area in the municipalities of Machadinho
D’Oeste and Vale do Anari, State of Rondonia, Brazil. Landsat MSS, TM, and ETM
+
data were
used to create maps of LC conditions for 1986, 1994, and 1999. Images were obtained in July/August
(dry season) and field data were collected during August 2000 with the assistance of nine local farm
associations and approximately 100 independent farmers. At meetings with the associations, hard
copy false-color composites of imagery data with parcel boundaries were presented to individual
landowners. Each individual provided historical and contemporary LU for known areas. Polygons
were annotated and labeled on stable acetate for each cover type, corresponding to the seven-category
classification scheme. Notes were taken during the interview process to indicate the dates of land
clearing, cover type, and level of uncertainty expressed by the participants.
Approximately 1000 polygons were field-annotated and random samples were selected for
classifier training and map validation. Spectral signature files were generated from training polygons
and used in a supervised classification using maximum likelihood classification. Overall accuracy
for each year ranged between 85 and 95% (Kappa 0.52–0.78). LC changes were consistent with
the trends observed in the study area and reported by others. The participatory process involving
local farmers was crucial for achieving the objectives of the study. The specific protocol developed
for data collection should be applicable in a wide range of cases and contexts.
The building of trust with the local stakeholders is important with contested issues such as
deforestation in the tropics. Systematic data collection among farmers (the primary land users)
provided a valuable source of information based on their direct observation in the field and historical
data not directly available through other sources. This procedure provided greater confidence for
interpreting and understanding classification errors. Finally, the process itself empowered local
farmers and provided a forum for discussing land use processes in the region, including challenges
to alleviate poverty, increase agrosilvopastoral farming systems, arrest deforestation, and study its
implications for developing more effective land use policies.
Including the local stakeholders in the research was a very effective process for evaluating LC
change in the region. For stakeholders and researchers, the mapping and reporting process fosters
better understanding of the patterns and processes of environmental change in the study area. We
foresee that participatory mapping projects such as the one reported in this chapter have the potential
to become an important planning device for regional-scale development in Brazil. With greater
economic opportunities and stronger institutions at the local level, society is likely to improve the
ability to identify and adopt more environmentally sound LU activities.
L1443_C06.fm Page 87 Saturday, June 5, 2004 10:21 AM
© 2004 by Taylor & Francis Group, LLC
88 REMOTE SENSING AND GIS ACCURACY ASSESSMENT
ACKNOWLEDGMENTS
We acknowledge the Brazilian farmer associations in Machadinho D’Oeste and associates in
the Center for Development and Regional Planning (CEDEPLAR) and Center for Remote Sensing
(CSR), Federal University of Minas Gerais (UFMG). The Brazilian National Council for Scientific
and Technological Research (CNPq), the Teresa Heinz Scholars for Environmental Research pro-
gram, the Rural Sociological Society (RSS), and the World Wildlife Fund (WWF, Brazil) provided
major financial support. At Cornell University, project sponsors included Cornell International
Institute for Food, Agriculture, and Development (CIIFAD), Department of Crop and Soil Sciences,
Department of Development Sociology and Graduate Field of Development Sociology, Einaudi
Center for International Studies, Latin American Studies Program (LASP), Institute for Resource
Information Systems (IRIS), and the Population Development Program (PDP). In addition, the
Tropical Rain Forest Information Center (TRFIC) at Michigan State University provided the satellite
imagery without which this study would not have been possible.
REFERENCES
Alves, D.S., J.L.G. Pereira, C.L. DeSouza, J.V. Soares, and F. Yamaguchi, Characterizing land use change in
central Rondonia using Landsat TM imagery,
Int. J. Remote Sens.
, 20, 28–77, 1999.
Asnet, G.P., A.R. Townsend, and M.M.C. Bustamante, Spectrometry of pasture condition and biogeochemistry
in the Central Amazon,
Geophysical Research Letters,
26, 2769–2772, 1999.
Boyd, D.S., G.M. Foody, P.J. Curran, R.M. Lucas, and M. Honzak, An assessment of radiance in Landsat TM
middle and thermal infrared wavebands for detection of tropical forest regeneration,
Int. J. Remote
Sens.
17, 249–261, 1996.
Brasil, MIRAD-INCRA e SEPLAN-Projeto RADAMBRASIL, Estudo da Vegetação e do Inventário Florestal,
Projeto de Assentamento Machadinho, Glebas 1 e 2, Goiânia, GO, Brazil, 1985.
Crist, E.P., R. Laurin, and R.C. Cicone, Vegetation and Soils Information Contained in Transformed Thematic
Mapper Data, in Proceedings of IGARSS’ 1986 Symposium, Ecological Society of America Publi-
cations, Division, ESA SP-254, 1986.
de Moraes, J.F.L, F. Seyler, C.C. Cerri, and B. Volkoff, Land cover mapping and carbon pool estimates in
Rondonia, Brazil,
Int. J. Remote Sens.
, 19, 921–934, 1998.
EMBRAPA/SNLCS, Levantamento de Reconhecimento de Média Intensidade dos Solos e Avaliação da
Aptidão Agrícola das Terras em 100.000 Hectares da Gleba Machadinho, no Município de Ariquemes,
Rondônia, Boletim de Pesquisa n. 16, EMBRAPA/SNLCS, Rio de Janeiro, RJ, Brazil, 1982.
Fearnside, P.M., The causes of deforestation in the Brazilian Amazon, in
The Geophysiology of Amazonia:
Vegetation and Climate Interactions,
Dickenson, R.E.,
Ed., John Wiley, New York, 1987.
Fearnside, P.M., Amazonian deforestation and global warming: carbon stocks in vegetation replacing Brazil’s
Amazon forest,
Forest Ecol. Manage.
, 80, 21–34, 1996.
Fearnside, P.M. and W.M. Guimaraes, Carbon uptake by secondary forests in Brazilian Amazon,
Forest Ecol.
Manage.,
80, 35–46, 1996.
Fernandes, E.C.M. and J.C. Matos, Agroforestry strategies for alleviating soil chemical constraints to food
and fiber production in the Brazilian Amazon, in
Chemistry of the Amazon: Biodiversity, Natural
Products, and Environmental Issues
, Seidl, P.R. et al., Eds., American Chemical Society, Washington,
DC, 1995.
Fernandes, E.C.M., Y. Biot., C. Castilla, A.C. Canto, J.C. Matos, S. Garcia, R. Perin, and E. Wandelli, The
impact of selective logging and forest conversion for subsistence agriculture and pastures on terrestrial
nutrient dynamics in the Amazon,
Ciência Cultura
, 49, 34–47, 1997.
Foody, G.M., G. Palubinskas, R.M. Lucas, P.J. Curran, and M. Honzak, Identifying terrestrial carbon sinks:
classification of successional stages in regenerating tropical forest from Landsat TM data,
Remote
Sens. Environ.
, 55, 205–216, 1996.
Frohn, R.C., K.C. McGwire, V.H. Dales, and J.E. Estes, Using satellite remote sensing to evaluate a socio-
economic and ecological model of deforestation in Rondonia, Brazil,
Int. J. Remote Sens.
, 17,
3233–3255, 1996.
L1443_C06.fm Page 88 Saturday, June 5, 2004 10:21 AM
© 2004 by Taylor & Francis Group, LLC
PARTICIPATORY REFERENCE DATA COLLECTION METHODS FOR ACCURACY ASSESSMENT 89
Huang, C., B. Wylie, L. Yang, C. Homer, and G. Zylstra, Derivation of a tasseled cap transformation based
on Landsat 7 at-satellite reflectance,
Int. J. Remote Sens.,
23, 1741–1748, 2002.
IBGE. Censo Demográfico 1991 – Rondônia
,
Instituto Brasileiro de Geografia e Estatística (IBGE), Rio de
Janeiro, RJ, Brazil, 1994.
IBGE. Censo Demográfico 2000, available at Instituto Brasileiro de Geografia e Estatística (IBGE) Web site,
, December 2001.
INPE. Deflorestamento da Amazônia 1995-1997, Instituto Nacional de Pesquisas Espaciais (INPE), São José
dos Campos, SP, Brazil, 1998.
Kauth, R.J. and G.S. Thomas, The Tasselled Cap — a graphic description of the spectral-temporal development
of agricultural crops as seen by Landsat, in
Symposium on Machine Processing of Remotely Sensed
Data,
IEEE, 76CH 1103 – IMPRESO, 1976, pp. 41–51.
Kimes, D.S., R.F. Nelson, W.A. Salas, and D.L. Skole, Mapping secondary tropical forest and forest age from
SPOT HRV data,
Int. J. Remote Sens.
, 20, 3625–3640, 1999.
Linden, E., The road to disaster,
Time
, October 16, 2000, pp. 97–98.
Liverman, D., E.F. Moran, R.R. Rindfuss, and P.C. Stern, Eds.,
People and Pixels: Linking Remote Sensing
and Social Science
, National Academy Press, Washington, DC, 1998.
Lucas, R.M., M. Honzak, G.M. Foody, P.J. Curran, and C. Corves, Characterizing tropical secondary forests
using multi-temporal Landsat sensor imagery,
Int. J. Remote Sens.
, 14, 3061–3067, 1993.
Mausel, P., Y. Wu, Y. Li, E. Moran, and E. Brondizio, Spectral identification of successional stages following
deforestation in the Amazon,
Geocarto Int.
, 8, 61–71, 1993.
McCracken, S.D., E. Brondizio, D. Nelson, E.F. Moran, A.D. Siqueira, and C. Rodriquez-Pedraza, Remote
sensing and GIS at farm level: demography and deforestation in the Brazilian Amazon,
Photogram.
Eng. Remote Sens.
, 65, 1311–1320, 1999.
Moran, E.F. and E. Brondizio, Land-use change after deforestation in Amazonia, in
People and Pixels: Linking
Remote Sensing and Social Science
, Liverman, D. et al., Eds., National Academy Press, Washington,
DC, 1998.
Moran, E.F., E. Brondizio, P. Mausel, and Y. Wu, Integrating Amazonian vegetation, land use, and satellite
data,
Bioscience
, 44, 329–338, 1994.
Nepstad, D., D. McGrath, A. Alencar, A.C. Barros, G. Carvalho, M. Santilli, and M. del C. Vera Diaz, Frontier
governance in Amazonia,
Science
, 295, 629–631, 2002.
Olmos, F., A.P. de Queiroz Filho, and C.A. Lisboa, As Unidades de Conservação de Rondônia,
Rondônia/SEPLAN/PLANAFLORO/PNUD, Porto Velho, RO, Brazil, 1999.
Ostrom, E., Self-Governance and Forest Resources, Occasional Paper 20, Center for International Forestry
Research, Jakarta, Indonesia, 1999.
Peralta, P. and P. Mather, An analysis of deforestation patterns in the extractive reserves of Acre, Amazonia,
from satellite imagery: a landscape ecological approach,
Int. J. Remote Sens.
, 21, 2555–2570, 2000.
Rignot, E., W. Salas, and D. L. Skole, Mapping deforestation and secondary growth in Rondonia, Brazil, using
imaging radar and Thematic Mapper data,
Remote Sens. Environ.
, 59, 167–179, 1997.
Rindfuss, R.R. and P.C. Stern, Linking Remote Sensing and Social Science: The Need and the Challenges,
in
People and Pixels: Linking Remote Sensing and Social Science
, Liverman, D. et al., Eds., National
Academy Press, Washington, DC, 1998.
Roberts, D.A., G.T. Batista, J.L.G. Pereira, E.K. Waller, and B.W. Nelson, Change Identification Using
Multitemporal Spectral Mixture Analysis: Applications in Eastern Amazonia, in
Remote Sensing
Change Detection: Environmental Monitoring Methods and Applications,
Lunetta, R.S. and C.D.
Elvidge, Eds., Ann Arbor Press, Chelsea, MI, 1998.
Sanchez, P.A., Soil Productivity and Sustainability in Agroforestry Systems, in
Agroforestry: A Decade of
Development
, Steppler, H.A. and P.K.R. Nair, Eds., Institute Council for Research in Agroforestry,
Nairobi, Kenya, 1987.
Sanchez, P.A. and J.R. Benites, Low input cropping for acid soils of the humid tropics,
Science
, 238,
1521–1527, 1987.
Serrão, E.A.S. and J.M. Toledo, The Search for Sustainability in Amazonian Pastures, in
Alternatives to
Deforestation: Steps Toward Sustainable Use of the Amazon Rain Forest
, Anderson, A.B., Ed.,
Columbia University Press, New York, 1990.
Skole, D.L. and C.J. Tucker, Tropical deforestation and habitat fragmentation in the Amazon: satellite data
from 1978–1988,
Science
, 260, 1905–1910, 1993.
L1443_C06.fm Page 89 Saturday, June 5, 2004 10:21 AM
© 2004 by Taylor & Francis Group, LLC
90 REMOTE SENSING AND GIS ACCURACY ASSESSMENT
Steininger, M.K., Tropical secondary forest regrowth in the Amazon: age, area, and change estimation with
Thematic Mapper data,
Int. J. Remote Sens.
, 17, 9–27, 1996.
Sydenstricker-Neto, J., Organizações Locais e Sustentabilidade nos Trópicos Úmidos: Um Estudo Exploratório,
Documentos de Trabalho
,
EMBRAPA-IFPRI, Rio Branco, AC, Brazil, 1997.
Sydenstricker-Neto, J., Parceleiros de Machadinho: História Migratória e as Interações entre a Dinâmica
Demográfica e o Ciclo Agrícola em Rondônia, M.A. thesis, State University of Campinas (UNI-
CAMP), Campinas, SP, Brazil, 1992.
Sydenstricker-Neto, J. and H.G. Torres, Mobilidade de migrantes: autonomia ou subordinação na Amazônia?,
Revista Brasileira de Estudos de População
, 8, 33–54, 1991.
Szott, L.T., E.C.M. Fernandes, and P.A. Sanchez, Soil-plant interactions in agroforestry systems.
For. Ecol.
Manage.
, 45, 127–152, 1991.
Vosti, S.A., J. Witcover, C.L. Carpentier, S.J. Magalhães de Oliveira, and J. Carvalho dos Santos, Intensifying
Small-Scale Agriculture in the Western Brazilian Amazon: Issues, Implications and Implementation,
in
Tradeoffs or Synergies?: Agricultural Intensification, Economic Development and the Environment
,
Lee, D. and C. Barrett, Eds., CAB International, Wallingford, U.K., 2000.
Wood, C.H. and D. Skole, Linking Satellite, Census, and Survey Data to Study Deforestation in the Brazilian
Amazon, in
People and Pixels: Linking Remote Sensing and Social Science
, Liverman, D. et al., Eds.,
National Academy Press, Washington, DC, 1998.
L1443_C06.fm Page 90 Saturday, June 5, 2004 10:21 AM
© 2004 by Taylor & Francis Group, LLC