Hydroblasting and Coating of Steel Structures 2011 Part 8 ppsx
Bạn đang xem bản rút gọn của tài liệu. Xem và tải ngay bản đầy đủ của tài liệu tại đây (522.29 KB, 20 trang )
128 Hydroblasting and Coating
of’
Steel
Structures
TabIe
5.12
Time
to
failure
by
blistering
for
linings
(Mitsehke,
2001).
~
~~~
Chloride level
in pg/cm2
Time to blistering
in
weeks at various temperatures
8
8°C
77°C
66°C 54°C 43°C
0.6
1.4
3.9
5.3
7.6
0.6
1.4
3.9
5.3
7.6
0.6
1.4
3.9
5.3
7.6
0.6
1.4
3.9
5.3
7.6
0.6
1.4
3.9
5.3
7.6
0.6
1.4
3.9
5.3
7.6
>56
>56
>56
>56
>56
3
6
6
5
2
36
3
1.5
1.5
1.5
>56
>56
>56
>56
>56
1.5
1.5
1.5
1.5
1.5
3643
3643
3
23
3
Epoxy novolac,
DPT
320
pm
>56
>56
>56 >56
>56
>56
>56
>56
36 >56
Epoxy,
DFT
193
pm
26-36 >56
26-36
>56
26-36 >56
26 >56
2
4
Epoxy,
DFT
239
pm
11
12
7
12
3 7
3
7
1.5
3
Epoxy
novolac.
DFT
262
pm
>56 >56
>56
>56
>56 >56
>
56
>56
>56
>56
Epoxy,
DFT
2
52 pm
>56 >56
1.5 4
1.5
3
1.5
10
1.5
3
Epoxy,
DFT
2 52
pm
256 >56
43-56
>56
3
>56
23
>56
3
43-56
>56
>56
>56
>56
>56
>56
>56
>56
>56
>56
>56
>56
>56
>56
>56 >56
>56 >56
10
>56
>56 >56
>56
>56
>56
>56
>56 >56
5
3
>56
>56
>56
>56
>56 >56
>
56
>56
256 >56
>56 >56
>56 >56
>56 >56
>56
>56
>56
>56
>56 >56
456 >56
>56
>56
>56 >56
>56
>56
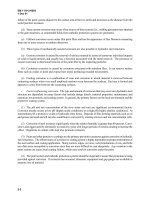
The very extensive study performed by Soltz
(1991)
also contains an investigation
about the effect of chloride-contaminated abrasives on the coating performance.
However, the major criterion for salt content is the safe or permissible, respectively,
salt level that prevents under-rusting or blistering of the applied paint system. There
Surface Quality Aspects
129
12
hloride
level
in
Fg/cm2
-0
-64
-a
-125
$9
tj6
2
n
5
-16
-250
z
B
c
$3
0
0
900
1800
2700
3600
4500
Time
of
testing in
hours
Figure
5.5
The efJect
oj
chloride level
on
blistering in coal tar epoxy coatings
(Soltz.
19
91).
Table
5.13
Institution
Permissible chloride levels
on
steel substrates.
Permissible chloride content in p,g/cm2
NASA
5
US
Navy (non-immersion service)'
5
US
Navy (immersion service)'
3
NORSOK (immersion ~ervice)~
2
Hempel (non-immersion service)' 19.5
Hempel (immersion service)'
6.9
'
Cited in Appleman
(2002).
'
NORSOK
Standard M-501,1999.
Hempel Paints.
are different values available in the literature; some are summarised in Tables
5.13
and 5.14, and in Fig.
5.6.
It must be considered that these global values may be mod-
ified for certain applications and coating systems: in those cases paint manufactur-
ers should be consulted. Zinc-based systems are far less vulnerable to salt
concentration than are barrier systems, for example. Thresholds for chlorides and
sulphates also depend on dry film thickness
(DFT)
of
the applied paints (Table 5.14).
Further information
is
provided by Alblas and van London (1997). It is important to
realise that each different coating/substrate system is likely
to
have various param-
eters, including the chloride levels it can tolerate, that are unique to itself.
5.4.3
Substrate Cleanliness after Surface Preparation
A
number of investigations were performed in order to evaluate the chloride content
of
steel substrates prepared
by
different surface preparation methods: this includes the
studies of Allen (1997), Brevoort (1988), Dupuy (2001), Porsgren and Applegren
130
Hydroblasting and Coating
of
Steel Structures
Table
5.14
Critical salt thresholds that result in early paint deterioration (Appleman,
2002;
Morcillo and Simancas,
1997).
Coating system
DFT in
Fm Salt thresholds in Fglcm2
Chloride
(Cl)
Sulphate
(SO4)
Unknown
Unknown
Unknown
Unknown
Unknown
Unknown
Unknown
Epoxy phenolic
Epoxy polyamide
Coal tar epoxy
Fusion-bonded epoxy
Tank lining epoxy
Epoxy mastic
12 5-22 5
25-35
7-1
1
thin films
100-1
50
130-180
one coat
three coats
254
60-190
-
-
two coats
7-30
>1
6-2 5
7
6-30
5-10
1
5
50
<3
10-20
7
-
70-300
9-3
5
16
58.8
100-250
50-100
-
-
-
-
-
-
-
N
E
Y
30
c
c
0
c
2
E
20
8
6
Q)
0
c
(I)
0
10
-
n
surface condition critical concentration
before
0
after 1
-
Morcillo (Chemistry)
2
-
BSRA
(Chlor rubber)
4
-
Swedisch Corr
lnst
5
-
Dekker (Epoxy)
sspc
9,-07
(ps/cm2)
3
-
Weldon (Vinyl. EPOXY)
Chlor rubber. 1.3
.
I I
I
I
-Hand brush $edle gun UHP (Dw2) UHP (Dw3) Grit blasting
14+5(1-2pg/Cm2)1 Method
of
treatment
Figure
5.6
Permissible and realised chloride levels in ballast tanks (measurements: Allen,
1997).
(2000),
Kuljian and Melhuish (1999), Morris
(2000),
Trotter (2001),
NSRP
(1998)
and van der Kaaden (1994). Some results are summarised in Tables 5.15 and 5.16.
A
notable reduction in chloride level could be noted
if
wet blasting and hydroblasting
were applied.
In
both cases the water flow involved
in
the preparation process entered
pores, pits, pockets, etc. and swept the salt away. This mechanism was verified
by
results of SEM-inspections
of
hydroblasted surfaces (Trotter, 200
1).
Mechanical
methods, such as needle gunning or wire brushing, did not remove soluble salts with
the same reliability. Striking features were the high values for soluble iron, potassium
Surface
Quality
Aspects
13
1
Table
5.15
Chloride levels measured after different pre-treatment methods (Forsgren and
Applegren,
2000).
Method
Chloride level in
pg/cm2
Bresle
(
10
min)
SSM
(10
s)
SSM
(10
min)
No
pre-treatment
44.8 47.5 61.3
54.8 72.8 96.3
24.8
15.2
-
1
-
1
I
-
1
-
Wet
blasting
1.6 1.4 2.7
1.6
0.7
2.0
0
1.7 3.1
3.2 1.5 4.1
Hydroblasting
1.6 15.2
-
0.8
1.8 4.2
0 2.4 4.6
1.2
0.1
2.1
2.4 4.8 10.3
1.2
0
1.0
0
0 0.8
Wire brush
28.8
16.0
23.2
17.6
63.5
-
32.6 58.9
15.2 25.0
18.1 30.3
Needle
gun
27.6
19.9
42.6
26.8 41.3 96.1
29.6 20.6 31.5
21.2 20.9 35.0
Dry
grit blasting
4.4
8.3 14.8
6.8
10.8 16.5
'
No
measurements.
and chloride after grit blasting inTable 5.17. Obviously. rust and sea salt could not be
removed efficiently by this method.
A
study that included other salts (sulphates, phos-
phates, nitrates)
was
performed by Howlett and Dupuy (1993).
This
study showed the
same trends as for the chlorides (see Table 5.16). It
was
further found that grit blasting
did not remove chlorides to safe levels 50% of the time.
Conductivity readings (which characterise not only chloride content, but
all
dissolved salts) from hydroblasted surfaces were reported
by
Kuljian and
Melhuish (1999). In most cases, conductivity levels dropped significantly after
hydroblasting: 75%
of
all readings were under
20
yS/cm,
and 95% are under
40
pS/cm. Results
of
this study are shown in Fig. 5.7. Interesting results were
132
Hydroblasting and
Coating
of
Steel
Structures
Table 5.16 Surface contaminant results from different preparation methods (Howlett
and
Dupuy,
1993).
Substrate
Contaminant Salt level
in
surface preparation method given in &cm2
Uncleaned Grit-blasted Hydroblasted Hydro-abrasive blasted
A-36
steel with Sulphates
40
3
0
4
mill scale Phosphates
0
0
0
3
Chlorides
2 2
1
0
Nitrates
0
6
0
6
A-285 Grade
3
Sulphates
5
5
0
1
steel
with mill
Phosphates
0
1
0
6
scale Chlorides
4
3
1 1
Nitrates
0
11
1
3
Rustedwater Sulphates
5
2
1
2
service pipe Phosphates
1
2
0
6
Chlorides
28
32
1
0
Nitrates
6
1
1
8
Intact coating Sulphates 8
4
0 0
on water Phosphates
0
2
0
3
service
pipe Chlorides
6
1
1
0
Nitrates
4
2
1
5
H2S scrubber Sulphates
39
7
0
3
plate Phosphates
0 0
0
2
Chlorides
12 8
0
1
Nitrates
0
1
0
3
Heat exchanger Sulphates
7
4
0
0
shell Phosphates
0 0 0
7
Chlorides
17 31
0 0
Nitrates
0
3
0
6
Table 5.17 Soluble substances on prepared surfaces (Navy
Sea
System Comm., 1997).
Element Soluble substance in p,glcm2
Hydroblasting Grit-blasting
Nickel
Zinc
Manganese
Magnesium
Calcium
Copper
Aluminium
Lead
Iron
Potassium
Sodium
Chloride
Sulphate
Total
0.006
0.063
0.003
0.021
0.121
0.033
0.003
0.015
0.018
0.414
0.855
0.846
0.211
2.611 (100%)
0.057
1.512
0.031
0.672
1.989
0.250
0.352
0.045
9.450
0.513
42.03
62.55
1.260
120.71 (4623%)
Surface Quality Aspects
13
3
360
E
300
5
2
2
180
8
.G
240
>
c
-0
c
120
c
0
(I)
60
0
0
initial
0
after hydroblasting
applicatiodlocation:
1
-freeboard
2
-
FwD
pocket top level
3
-
FwD
pocket mid level
5
-
freeboard
6
-
hull
frame
7
-tank
-
-
-
4
-
hull
-
-
7
-
-
I
I
lml
I
obtained with seawater as the blasting medium. It was confirmed that a second-
ary fresh water blast was required in that case in order to guarantee a sufficiently
clean surface.
5.5
Embedded Abrasive Particles
5.5.1
General Problem and Particle Estimation
Embedded grit is commonplace
on
grit-blasted surfaces and the prevention of this
phenomenon during hydroblasting is becoming one of the most critical arguments.
Embedded particles may act as separators between substrate and coating system,
similar to dust. It was shown in a study by Soltz
(1
99
1)
that this applied to larger size
grit particles if they were left
on
surfaces and then painted over. If abrasive particles
are notably contaminated with salts they may even cause rusting and blistering.
This can happen even with small amounts of fine dust (Soltz, 1991). Certain studies
were performed to investigate particle embedment during grit blasting, mainly by
applying the following methods:
0
0
0
0
low-power stereo zoom microscope (Fairfull and Weldon, 2001);
the secondary electron-mode of SEM (Fairfull and Weldon, 2001; Momber
et
al.,
2002a); see Fig. 5.8(a);
the back-scattered mode of SEM (Amada
et
al.,
1999; Momber
et
al.,
2002a,b); see Fig. 5.8(b);
EDXA-plots from SEM-imaging (Momber, 2002b); see Fig.
5.9.
It was noted that the first method delivers generally much lower values than the SEM
back-scatter images showed.
134
Hydroblasting and Coating
of
Steel
Structures
(a) Secondary electron mode.
(b)
Back-scattered mode, same image as (a).
(c) Back-scattered mode.
Figure
5.8
SEM-irnnges
of
ernbeddedgrit (Mornber
et
al.,
20024
5.5.2
Quantification and Influence on Coating Performance
Experimental results showed that grit embedment depended mainly on impact angle
and abrasive type. The impact angle influence is shown in Fig. 5.10; an increase in
the embedment could be noted as increased impact angle. Maximum embedment
occurred at a 90” impact angle (Amada
et
al.,
1999). The dependence of embedment
on the abrasive type is illustrated in Table 5.18; the dramatically different results for
the investigated abrasives illustrate the effect of grit type and morphology. It seemed
that slag material (except nickel slag) was very sensitive to grit embedment.
Experiments with copper slag showed that the comminution (breakdown) behaviour
of individual particles during the impact of the steel surface seemed to play an
important role. It was apparent that the embedment was not simply due to discrete
particles embedded in the substrate, but rather to extreme breakdown of the slag
abrasive into minute particles, or a physical smearing of the grit over the surface
(Fairfull and Weldon, 2001). A special effect was grit ‘overblasting’ due to multiple
grit-blasting steps. This phenomenon applied to the grit blasting of already blasted
surfaces (as usually occurring in grit blasting of deteriorated coatings or rusted steel
surfaces).
As
shown in Table 5.24, ‘overblasting’ increased the contamination level
due to additional grit embedment.
Surface Quality Aspects
1
3
5
6000
-
m
C
+
2
0
(a) Untreated surface.
9000
1
I
0
2
4
6
8
X-ray energy in keV
(b) Grit-blasted suface.
3
0
C
7
2000
3000J
V
4nnn
I
Ai
'"""1
h
0
2
4
6
8
X-ray energy in keV
Figure
5.9
EDXA
plots illustrating embedded grit residue (Mombel;
2002).
substrate: mild steel
abrasive: alumina
#20
40
60
80
1
Blasting angle in
Figure
5.10
Blasting mgle influence on grit embedment (measurements: Amada
et
al
1999).
136
Hydroblasting and Coating
OJ
Steel Structures
Table
5.18
Weldon,
2001).
Embedment
of
grit particles in a carbon steel (measurements: Fairfull and
~~ ~
Abrasive type Embedment
in
%
Staurolite
0.1
Iron
oxide
0.7
Silica sand 2.9
S-1
grit
4.1
Olivine
15.1
Copper
slag
41.5
Garnet
A
2.1
Garnet
B
4.7
Coal
slag
A
11.1
Coal
slag
B
25.3
Nickel
slag 1.2
.,-
rn
\
coating: plasma sprayed alumina
substrate:
steel
54
5*
.,-
rn
c
0
u)
.c
0
0
2
4
6
8
Area covered
by
embedded grit in
YO
0
Figure
5.11
Influence
of
particle embedment on adhesion strength (measurements: GriJJltith
et
al
1999).
Embedded grit reduced the adhesion of the subsequent coating to the substrate.
Figure
5.11
shows measurements
of
the adhesion strength
as
a function of the
amount of embedded grits. The adhesion strength significantly reduced as the sub-
strate surface contained embedded grit particles.
5.6
Wettability
of
Steel Substrates
Wettability
of
a
substrate influences the performance
of
coating formation (Griffith
et
al.,
199
7).
Wettability is usually given in terms
of
contact angle of a liquid
drop
to
the substrate (compare Fig.
5.19).
A
liquid drop spread measurement technique as
introduced by Momber
et
al.
(2002a) can also be applied to estimate the wettability
of
eroded surfaces. The Captive Drop Technique
(CDT)
as
shown
in
Fig.
5.12
can be
Surface Quality Aspects
13
7
VT
=
4.2, 8.5,
16.9
mm/s
needle
m
m
m-
m
E.
Q.
0)
c
:
6-
average spread distance
Figure
5.12
Drop spread distance measurement testing (Momber
et
al
20024
(scale: needle outside diameter
is
1.5
mm).
used for the generation and placement of the corresponding drops. The drop liquid
is usually Cyclohexane which performs better than water. After the drop has been
placed, a contact measuring machine consisting of video camera and computer is
used for measuring the spread distance under equilibrium conditions. The larger the
spread distance, the better the wettability of the surface. Results of the measure-
ments are displayed in Fig.
5.13.
These results are from hydroblasting tests on plain
substrate material (no coating was removed). Note that wettability decreased as
average roughness increased. This trend was also valid for other roughness param-
eters. However, wettability was unexpectedly low for high hydroblasting traverse
rates, and the general relationship failed in these cases. This discrepancy was
explained by Momber
et
al.
(2002a) through microcrack formation in the substrate.
138
Hydroblasting
and
Coating
of
Steel
Structures
For high traverse rates, the local exposure time was not sufficient to form a net of
intersecting fatigue cracks, and no material removal occurred. These aspects were
discussed in more detail by Momber
et
al.
(2002b).
5.7
Roughness
and
Profile of Substrates
5.7.7
lnfluence
of
Roughness
on
Coating
Adhesion
IS0
8502
states the profile of a surface as one
of
the three major properties that
influence coating performance. Substrate roughness is frequently specified
by
paint
manufacturers, but not by all. An example specification reads as follows: ‘For stain-
less steel: homogeneous and dense angular profile according to
IS0
Comparator
“Medium”
(G)
or
Rz
=
50
pm,
respectively.’ (Hempadur
45141).
Many paint data
sheets specify the average maximum roughness
RYS
rather than the global average
roughness
(R,).
Methods of how
to
evaluate substrate roughness are outlined in
IS0
8503:
0
0
microscope
(IS0
8503-3):
0
stylus
instrument
(IS0
8503-4).
profile comparator
(IS0
8503-1.
IS0
8503-2);
Table
5.19
provides a comparison between comparator values and corresponding
roughness values. According
to
those definitions, the Specification mentioned above
would require a fine comparator profile. However, comparator profiles are basically
developed for steel abrasives, in detail for steel shot (comparator profile
‘S’),
and steel
grit (comparator profile
‘G’).
Despite this limitation, comparators are used through-
out the corrosion protection industry to evaluate profiles formed by other, non-
metallic abrasive materials. Many commercial portable stylus instruments read the
following profile parameters:
R,,
Rz
and
R,,,
(RY).
These parameters are illustrated
in Fig.
5.14.
However, the arithmetical mean roughness
(R,)
is not specified in coat-
ing sheets: the two other parameters are.
Roughness and profile notably affect adhesion between substrate and coating to
be applied. Respective investigations were performed by Griffith
et
al.
(1997)
and
Hofinger
et
al.
(2002): two examples are presented
in
Table
5.20
and Fig.
5.15,
respectively. Griffith
et
al.
(1997)
found that adherence of plasma sprayed alumina
coatings to steel substrates improved
if
substrate average roughness (Fig.
5.1
5).
Table
5.19
Steel substrate profile parameters.
Comparator level
Profile
(Ry5)l
in
p,m
Fine 2
5-60
Medium 61-100
Coarse 101-125
‘Ryg
denotes the average
of
five in-line measurements.
Surface Quality Aspects
139
&ax
A
/
Figure
5.14
Surface roughness (profile) parameters (Hempel
Book
of Paints).
Table
5.20
Roughness effect on interface fracture energy (Hofinger
et
al.,
2002).
Roughness
R,
in
pm
Roughness
RZ
in
pm
Interface fracture energy
in
N/m
1.3
2.2
4.8
9.6
15.4
29.7
500
?
30
530 50
580
2
40
average peak slope and peak spacing of the profile increased. However, the
relationship for the peak spacing failed if a certain value for the peak spacing
(ca. 250 km) was exceeded. If this case occurred, adhesion between substrate and
coating reduced. Therefore, profile parameters must be optimised in order to
obtain a maximum adhesion. Hofinger
et
al.
(2002)
performed fracture experi-
ments on interfaces between steel substrates and plasma sprayed coatings.
As
their
results showed, a higher amount of energy was required to separate coating and
substrate as substrate roughness increased (Table 5.20). Morcillo
et
al.
(1989)
investigated the effect of numerous parameters on roughness influence and found
that there is a critical surface profile, the value of which is determined by the envi-
ronment along with the type and thickness
of
the coating system.
As
the coating
system increased in thickness, the effect of the surface profile on coating perform-
ance diminished. The critical surface profile was found to be a function of the
aggressiveness of the environment
-
a more aggressive environment resulted in
a lower critical profile.
140
Hydroblasting and Coating
of
Steel
Structures
9-
6-
3-
0
substrate: carbon steel
coating: plasma sprayed alumina
12
l?
z
.o
C
C
u)
a,
c
s
""'I"I"
5.7.2 Influence
of
Roughness on Paint Consumption
Paint consumption can be approximated as follows (Richardt,
1998):
DFT
1
c
p-
lo.&
XC'
Here, DFT denotes dry film thickness.
S,
is the solid by volume that indicates what
is left on the surface as a dry film after the solvents
of
the applied coating mate-
rial have evaporated: this parameter is specified
in
most paint data sheets. The
parameter
xc
is finally a
loss
correction factor, depending on specified DFT,
applied method, substrate surface geometry and profile, wind conditions, etc. The
dependence of
xc
on application method and substrate profile is listed in
Table
5.21.
It can be seen that paint consumption increases
if
profiled surfaces
are painted instead of surfaces without profiles. It is mainly for that reason that
paint manufacturers sometimes specify a maximum substrate roughness for cer-
tain types of coatings.
5.7.3 Surface
Profiles
on Remaining Coatings
If
hydroblasting is used to remove deteriorated parts
of
a coating system and to
expose tightly adhering coating layers it imparts a profile on the intact paint. This is
shown in Fig. 5.3(a). These profiles can be measured using profile tapes; results
of
such measurements are listed in Table
5.22.
As
seen, the profiles of the coating sur-
faces ranged form 33 to
107
pm. This was an excellent profile (on paint) to accept
overcoats of anti-corrosive coatings
(NSRP,
1998).
Surface
Quality
Aspects
141
Table
5.21
DFT
in
pm
Roller
/
brush method Airless spray method
(one coat)
Paint
loss
correction factor
Xc
(Richardt,
1998).
Surface without Surface
with
Surface without Surface with
profiles
profiles
profiles profiles
1-2
5
0.57
26-50
0.62
51-100
-
>loo
-
0.54 0.44
0.59
0.48
-
0.57
-
0.62
0.42
0.46
0.54
0.59
Table
5.22
standad
ASTM
D
4417,
Method
C).
Results
of
profile readings on exposed intact coatings
(NSRP,
1998)
(testing
Location Profile in
pm
USS
Double
Eagle
Over anti-corrosive
Over anticorrosive
43
33
Over
anti-corrosive
43
Trinmar offshore pumping station
Tank
16.
over bare metal
Tank
16,
over bare metal
Tank
16. over primer
Tank
16.
over primer
Tank
16,
over top coat
Tank
16,
over top coat
Tank
16, over
top
coat
Tank
16,
ovcr
top
coat
Tank
19.
over bare metal
Tank
19.
over bare metal
Tank
19,
over primer
Tank
19,
over top coat
Tank
19,
over top coat
102
112
102
96
66
91
48
46
86
107
96
104
43
5.7.4
Profiles
on
Hydroblasted Steel Substrates
It is often believed that hydroblasting cannot ‘appreciably impart a profile on steel.’
(NSRP.
1998). However, this statement
is
not generally true, and certain investiga-
tions were performed dealing with the use
of
high-speed water jets as a profiling
method (Taylor, 1995; Knapp and Taylor, 1996; Miller and Swenson, 1999:
Momber
et
al.,
2002a). Miller and Swenson (1999) found that material removal of
the substrate might occur during hydroblasting under certain process conditions.
Examples are shown in Fig. 5.16; notable surface modifications can be seen as
results of the hydroblasting process.
142
Hydroblasting and Coating
of
Steel Structures
(a) Right: untreated; left: hydroblasted. (b) Right: hydroblasted; left: grit-blasted.
Figure
5.16
Hydroblasted steel surfaces (low-carbon steel).
Results of profile readings on hydroblasted virgin steel samples are summarised in
Table 5.23. Similar values were reported by Taylor (1995).
As
can be seen, hydro-
blasting formed a notable profile on the substrate. However, performance rates were
very
slow
in these cases. It was shown that roughness parameters of a substrate pro-
filed by hydroblasting depended on specific material removal (in g/cm2): the higher
the material removal, the higher are the roughness values (Momber
et
al.,
2002a).
Hydroblasted surfaces showed narrower spacing between profile peaks as compared
to the grit-blasted samples. This is a very important issue because it is known that
narrow peak spacing increases the adhesion to applied coatings (Griffith
et
al.,
1999). The adhesion properties of hydroblasted steel substrates were investigated in
some detail by Knapp and Taylor (1996). The adhesion strength measured after
hydroblasting was equal or even superior to values measured after grit-blasting.
Typical adhesion strength readings are displayed in Fig. 5.17(a). It was also found
that the standard deviation of strength readings was rather low for hydroblasting
(Fig. 5.17(b)); it is conclusive that hydroblasting delivers a desired adhesion over a
given cross section with a higher probability than grit-blasting. It may, however, be
noted that these tests were performed at very high operating pressures of
p
=
345
MPa
which is beyond the capacity of on-site plunger pumps. Nevertheless, the results
were very promising and hydroblasting has a certain future capability to profile
virgin steel surfaces.
5.7.5
Profiles
on
'Overblasted' Steel Substrates
Further interesting aspects associated with grit-blasting are illustrated in Figs. 5.18
and 5.19. Figure 5.18 shows the influence of multiple grit-blasting ('overblasting')
on the roughness values of steel substrates. The virgin steel is denoted
'O',
grit-
blasted steel is denoted
'I',
and twice grit-blasted steel is denoted '11'. Note that
-
as
expected
-
a single grit-blasting step (as performed during the new building of a
ship) increased any roughness parameter, whereas the second grit-blasting step
Surface Quality Aspects
143
Table 5.23
sure: 200-275 MPa).
Specimen Roughness parameter in
pm
Results
of
hydroblasting profiling tests (Momber
et
al.,
2002a) (operating pres-
(preparation method)
Ra
Rmax
Rz
RS
Rt
RP
Untreated 0.80 9.50 7.83 1.17 16.35 5.27
Grit-blasting
1
2.27 18.40 15.90 2.73 19.23 8.80
Grit-blasting 2 1.87 15.00 12.77
2.27 15.43
6.67
Grit-blasting
+
hydroblasting
1
8.00 52.20 44.30 33.10 52.67 22.00
Grit-blasting
+
hydroblasting 2 8.13 55.60
44.00 32.41
57.83 23.73
Grit-blasting+ hydroblasting 3 8.87
60.27 50.17
36.73 62.13 26.13
Hydroblasting
1
9.77 63.23
51.00 38.20
64.30 29.33
Hydroblasting 2 8.50
51.40 45.73
34.57 52.03 22.27
Hydroblasting
3
9.20
55.07 49.40 36.87
62.17 28.13
Hydroblasting 4 6.77
52.50 41.27
29.33 52.77 23.37
Hydroblasting 5
7.77 52.60
43.87 31.97 53.33 22.60
Hydroblasting 6 7.43
52.17 43.57 31.87
54.43 23.27
Hydroblasting 7 6.10
50.03 35.83 26.27
51.17 19.87
Hydroblasting 8 8.60
54.87 46.17
34.70 57.63 25.93
Hydroblasting 9
8.47 56.30
46.27 34.33 59.33 25.53
Hydroblasting 10
7.83 55.30
46.20 33.87
56.77 26.43
(a) Absolute bond strength.
(b) Strength standard deviation.
'""
1
preparation method: base material:
0
hydroblasting
"4
0
grit-blasting
Inconel71 8
preparation method:
0
hydroblasting
0
grit-blasting
r
._
:I
substrate: Mar-M 509
r
10
12345
678910
Test number
123456789
Test number
Figure 5.17 Adhesion testing on substratesprofkd by hydroblasting (Knapp and Taylor; 1996).
(as performed during the stripping
of
worn coatings or rust) again decreased the
roughness. Although these are preliminary results it may be possible that grit-
blasting affects the original profile in a negative way. Similar relationships are shown
in
Fig.
5.19
which displays results of comparative contact angle measurements.
144
Hydroblasting
and
Coating of Steel Structures
400
I
Experimental condition
00
01
OII
II
%ax
Rz
Ra
Rs
Rt
Roughness parameter
n
i
RP
Figure
5.18
Multipass grit-blasting effect
on
profile roughness (Mombe,:
2002).
Considering a non-porous material, an increase in the contact angle may be
the result of an increase in surface roughness according to Wenzel’s (1939)
formulation:
rR
=
~
COS
e,
A,.
Here,
r,
is a so-called roughness factor considering the profile of a rough surface,
is the contact angle of the rough surface,
AR
is the true (rough) surface, and
A,
is a perfectly smooth surface (in the case discussed here this is the surface
of
the untreated surface). For a completely smooth (untreated) surface,
rR
=
1
and
OR
=
8,.
It can be seen from Eq. (5.2) that the contact angle increased as the
roughness factor increased. From Fig. 5.19, it can be seen that contact angle at
the twice grit-blasted steel surface was lower than the contact angle at the ini-
tially eroded surface. Therefore, roughness decreased. The exact values are given
in Table
5.24.
This ‘overblasting’ caused the surface to have a high number of flat
regions, a lower peak to valley height and a significant number of laps and tears
due to the folding and plastic deformation. This was verified by comparative
SEM-studies (Momber, 2002b). Other authors (Griffith, 2001) described similar
phenomena.
5.8
Aspects
of
Substrate Surface Integrity
Substrate surface integrity may include surface properties, namely hardness, resid-
ual stresses and fatigue limit. The liquid drop technique has been used in the labora-
tory for surface integrity enhancement for several years. Corresponding studies were
Surface Quality Aspects
145
(a) Plain, untreated surface
(eA=
145").
(b)
Grit-blasted surface
(0,
=
169").
(c) Twice grit-blasted surface
(eA=
141").
Figure
5.19
Advancing contact angles on steel surfaces (Mombel:
2002).
146
Hydroblasting
and
Coating
of
Steel Structures
Table
5.24
Results
of
grit
'overblasting' (Momber,
2002).
Parameter Test condition
Untreated One grit-blasting
Two
grit-blasting
(0)
step
(1)
step
(11)'
Contact angle (advancing)
tlA
in
Contact angle (receding)
OR
in
Contact angle (equilibrium)
Be
in
'
Roughness factor
rR
Grit contamination in
%,
RZ
in
pm
R,
in
pm
Rs
in
pm
R,
in pm
RP
in pm
R,,,
in
Pm
145.4
131.9
130.7
1.0
0
9.50
4
3.50
7.83
2
2.87
0.80
4
0.30
1.17
4
0.03
16.35
4
5.80
5.27
4
2.63
168.9
157.8
137.3
1.13
6.6
18.40
2
0.90
15.90
2
0.10
2.27
2
0.43
2.73
t
0.27
19.23
4
1.47
8.80
Z
1.60
140.6
11
7.4
135.3
1.09
7.4
15.00
-t
1.20
12.77% 0.47
1.87
2
0.07
2.27
%
0.07
15.43% 1.03
6.67% 0.37
'
Overblasting.
IATA limit
E
120
C
traverse rate: 25.4
mmls
'E
90
.I
passes:
1
to
3
substrate:
AI
2024-T3 Alclad
100
120 140
160
Operating pressure in MPa
Figure
5.20
Arc height deflection
on
hydroblasted composites (Harbaugh and Stone,
1993).
performed, among others, by Colosimo
et
al.
(2000),
Haferkamp
et
al.
(1989)
and
Tonshoff
et
al.
(199
5).
Water jets can induce residual compressive stresses due to
plastic
flow
on the surface of metals. Test series that addressed this issue was run by
Harbaugh and Stone
(1993)
on aircraft coatings and substrates with operating pres-
sures up to
152
MPa. Arc height deflections from Almen stripes hit by the water jets
were determined for plain and coated aluminium alloys and related to residual
stresses created in the material during hydroblasting. Some examples are shown
in Fig.
5.20.
Deflections were less than
38
pm
for coated specimens, and less than
76
pm for plain metals. However,
a
critical threshold of
127
pm was
in
no
case
Surface Quality Aspects
147
Figure
600
m
z
._
c
400
2
=I
a
c
-
-
0
baseline
0
hydroblasted
0
9
200
7
0
5
10
20
Number
of
hydroblasting cycles
sults of fatigue tests
on
hydroblasted fuselage sections (Volkmal;
992).
exceeded. This agreed with results obtained
by
Volkmar (1992). The higher values
for the uncoated material can be explained through additional energy dissipation
during coating deformation and removal.
Fatigue life becomes a problem
if
water jets are applied to sensitive structures, such
as airplane fuselage or wings. Holographic and strain gauge measurements performed
during fatigue and vibration tests
on
airplane fuselages have shown that induced
fatigue life reduction is below critical levels for
100
mm
stand-off distance between
nozzle exit and surface (Volkmar, 1992). Cycle tests
on
a hydraulic testing machine
evidenced that fatigue is not a concern. Representative results are plotted in Fig.
5.2
1.
(These tests have been performed with rather low operating pressures of
50
ma.)