Land Use Change and Mountain Biodiversity - Chapter 9 potx
Bạn đang xem bản rút gọn của tài liệu. Xem và tải ngay bản đầy đủ của tài liệu tại đây (789.38 KB, 17 trang )
119
9
Grazing Impact on Vegetation
Structure and Plant Species
Richness in an Old-Field
Succession of the Venezuelan
Páramos
Lina Sarmiento
INTRODUCTION
Páramos occupy the alpine belt of northern
South America, between 3000 and 4800 masl.
Giant rosettes of the genera
Espeletia
, together
with sclerophilous shrubs and bunch grasses,
dominate the vegetation. In pre-Columbian
times, the páramo was almost exclusively used
for hunting and gathering (Wagner 1978), and
only after the arrival of the Spanish, and mainly
during the 18th century, did it begin to be exten-
sively grazed by introduced domestic animals,
mainly cattle, horses, and mules. Consequently,
the páramo evolved until recent times without
domestic herbivory. Many plant species, mostly
the endemic ones, probably did not develop
specific adaptations to this kind of disturbance
and are potentially sensitive.
The carrying capacity of the Venezuelan
páramos is low. The main offering of forage is
concentrated in small marshes and fens situated
in the valley bottoms or in areas with poor
drainage and dominated by palatable grasses
and sedges (Molinillo and Monasterio 1997).
The more widespread páramo vegetation, in
which dwarf shrubs, rosette plants, and tussock
grasses predominate, presents a lower availabil-
ity of forage (Molinillo and Monasterio 1997).
In the wetter páramos of Colombia, where the
cover of tussock grasses is higher and more
continuous than in Venezuela, the palatability
of the vegetation is commonly improved by
burning (Hofstede et al. 1995), but in the drier
páramos of Venezuela, where grasses are less
abundant, burning is not practiced, and the strat-
egy of the farmers is to develop a closer rela-
tionship between agricultural activities and cat-
tle management, complementing the natural
sources of forage with crop residues, fodder,
and grazing on fallow plots (Molinillo and
Monasterio 2002).
To analyze the human impact on páramo
vegetation, it is essential to differentiate the
Andean and high-Andean ecological belts
(Monasterio 1980). In the Andean belt (3000 to
4000 m), night frosts are concentrated during
the dry season, allowing crops to develop dur-
ing the rainy season. In Venezuela, a rapid pro-
cess of agricultural expansion is taking place in
this belt, with potatoes as the main cash crop
and livestock husbandry as a complementary
activity. The high-Andean belt (above 4000 m),
where frosts occur throughout the year, is not
suitable for cropping and is only used for exten-
sive grazing. Nevertheless, these two belts are
not managed independently, and continuous
animal displacements occur between them.
Animals used as draft power in agriculture and
milking cows are maintained temporally in the
Andean belt, where crop residues and fodder
are used to complement their diet (Molinillo
and Monasterio 1997; Pérez 2000).
Long-fallow agriculture is still practiced in
some areas of the Andean belt. This agricultural
3523_book.fm Page 119 Tuesday, November 22, 2005 11:23 AM
Copyright © 2006 Taylor & Francis Group, LLC
120
Land Use Change and Mountain Biodiversity
system generates a landscape mosaic of areas
under cultivation, under natural vegetation and
at different stages of the fallow period, which
can last from 5 to more than 10 years. Fallow
areas are important sources of forage for
domestic animals maintained in the agricultural
belt (Pérez 2000). Fallow agriculture provides
a unique opportunity to analyze the rate and
mechanisms of páramo regeneration after agri-
cultural disturbance, an essential knowledge to
evaluate the reversibility of human impacts and
to design future strategies for páramo restora-
tion and management.
Our general objective is to assess if
páramo regeneration after agricultural distur-
bance is affected by grazing and to evaluate
this activity as to whether or not it can be
compatible with páramo restoration plans.
From the literature, it is well known that her-
bivory causes a pronounced impact on cover,
structure, and diversity of plant communities,
affecting the functioning of the ecosystems
and the environmental services that they pro-
vide (Milchunas et al. 1988; Huntly 1991; Pac-
ala and Crawley 1992; Gough and Grace
1998). Herbivory also affects the rates of suc-
cession and can produce divergence in succes-
sional pathways (Davidson 1993; Van Oene et
al. 1999). Nevertheless, the specific conse-
quences of grazing depend on herbivore den-
sity and on the characteristics of each partic-
ular system, such as the level of soil fertility,
the importance of competition for light as a
driving successional force, and the sensitivity
and adaptive mechanisms of the dominant and
subordinate species. As the vegetation
response to grazing depends on so many dif-
ferent factors, it is necessary to perform spe-
cific studies in each ecosystem to design par-
ticular management strategies to preserve
ecosystem biodiversity and functioning.
In the páramos, some studies were carried
out on the effect of grazing on vegetation, but
most of them were based on comparing veg-
etation relevés between sites with different
grazing intensities. Few data come from
experimental exclusions, except the unrepli-
cated 1-year experiment of Molinillo and
Monasterio (1997). Moreover, in most of the
studies, it is not possible to differentiate the
impact of grazing from that of burning. We
did not find specific studies on the effect of
grazing on páramo regeneration after agricul-
tural disturbance.
The objective of this study is to assess the
impact of grazing on páramo secondary succes-
sion, including the effect on (1) general ecosys-
tem attributes such as plant biomass, height, and
percentage of bare soil, (2) the life-form spec-
trum of vegetation, (3) plant species richness,
(4) individual plant species, including identifi-
cation of the more susceptible and tolerant ones
in different stages of the succession, and (5) the
probability of invasion by introduced species
more adapted to this kind of disturbance. With
these aims, an exclosure experiment was con-
ducted over a period of 4 years in plots at two
different stages of páramo succession.
METHODOLOGY
S
TUDY
A
REA
The study was carried out in the Páramo de
Gavidia, located in the northern Andes in Ven-
ezuela, at 8º40 latitude N and 70º55 longitude
W. The area lies within the Sierra Nevada de
Mérida National Park, at 3400 masl and is a
narrow glacial valley, with well-drained incep-
tisols (
Ustic Humitropept
) of a sandy-loam tex-
ture, low pH (4.25 to 5.5), and high content of
organic matter (up to 20%) (Abadin et al.
2002). Agriculture is practiced on steep slopes
and also on small colluvial and alluvial depos-
its in the valley bottom. The precipitation
regime is unimodal, with the dry season
between December and March. The mean tem-
perature ranges between 9 and 5ºC, depending
on the altitude, and the mean annual precipita-
tion is 1300 mm.
A present population of 400 inhabitants
established the settlement at the end of the 19th
century, giving the valley a relatively short land
use history (Smith 1995). The land-use system
is long-fallow agriculture. Potatoes are grown
during an agricultural phase lasting from 1 to
3 years. The agricultural practices include the
incorporation of the successional vegetation as
a green manure and mineral fertilization with
an average dose of 300 kg N ha
–1
a
–1
. After
cultivation, the fields are abandoned, and the
fallow period begins. The current average fal-
3523_book.fm Page 120 Tuesday, November 22, 2005 11:23 AM
Copyright © 2006 Taylor & Francis Group, LLC
Grazing Impact on Vegetation Structure and Richness in the Venezuelan Páramos
121
low length is 4.6 years, but there is a large
variability, with times ranging from 2 to more
than 15 years (Sarmiento et al. 2002). During
the fallow period, fields are used for extensive
grazing, mainly by cattle and horses.
V
EGETATION
D
YNAMICS
DURING
O
LD
-
F
IELD
S
UCCESSION
: M
AIN
T
RENDS
A previous study on plant succession, carried
out by Sarmiento et al. (2003), indicated that,
as in other extreme environments, succession in
the páramo proceeds as an
autosuccession
; the
characteristic species of the mature ecosystem
colonize very early and succession takes place
more by changes in the abundance of these spe-
cies than by a true replacement. Only a few
herbaceous, mostly introduced species (e.g.
Rumex acetosella
) act as strict pioneers and
strongly dominate the early stages. Then they
undergo a progressive decline, whereas native
forbs (e.g.
Lupinus meridanus
) and grasses (e.g.
Trisetum irazuense
) have their peaks of abun-
dance at intermediate stages (4 to 5 years). The
characteristic páramo life-forms, sclerophilous
shrubs (e.g.
Baccharis prunifolia, Hypericum
laricifolium
) and giant rosettes (e.g.
Espeletia
schultzii
), appear very early and gradually
increase in abundance, becoming dominant after
only 7 to 8 years. Vegetation regeneration takes
place relatively fast, but despite a rapid reestab-
lishment of the general physiognomy of the eco-
system, the high diversity of the natural páramo
is not reached in the current successional times
(Sarmiento et al. 2003).
E
XPERIMENTAL
D
ESIGN
Eight areas were selected in different parts of
the valley: four had just been abandoned after
potato cultivation (early plots), and four had
already passed through 5 years of grazed suc-
cession (intermediate plots). In each area, an
enclosure of 200 m
2
was established and
divided into two parts, each of 100 m
2
(20 m
×
5 m). One of these parts was excluded from
grazing, and the other was grazed for 1 h every
3 weeks, equivalent to a stocking rate of 0.4
cows ha
1
, considering that a cow grazes 12 h
per day. The experiment lasted 4 years, from
February 1998 to November 2001, and, in total,
60 different events of grazing were carried out.
Controlled grazing was preferred instead of free
grazing, to have an identical stocking rate in all
the repetitions.
V
EGETATION
S
AMPLING
Twice a year, during the dry and rainy seasons
(in March and October), the vegetation was
sampled in the grazed and excluded part of each
plot, for a total of eight sequential samplings
during the 4 years of the experiment (8 sam-
pling dates
×
8 plots
×
2 treatments = 128 veg-
etation relevés). The first sampling was carried
out just before the start of the experiment. The
point intercept method was used (Greig-Smith
1983). Five parallel lines of 20 m length were
located at 1-m intervals. Along these lines a pin
(diameter, 2.5 mm) was placed vertically every
meter, and the contacts of each species in height
intervals of 10 cm were recorded.
Using the data obtained from the point
intercept method, the biovolume per species,
the percentage of bare soil, and the weighted
height of the vegetation were calculated. The
biovolume was computed as the sum of all the
contacts of the species in the 100 points. The
average weighted height of the vegetation was
calculated by weighing the number of contacts
in each 10 cm by the height of the stratum. The
percentage of bare soil was calculated from the
points that no species touched.
Slope, stoniness, soil texture, and soil total
C and N were also measured to characterize the
different plots.
A
NALYSIS
OF
THE
D
ATA
Biovolume data can be transformed into bio-
mass using coefficients for each species. The
relative abundance of the species is different
when data are expressed in one or the other of
these units, as the coefficients to transform bio-
volume to biomass are different for each spe-
cies, depending on architecture, wood density,
specific leaf area, vertical distribution, etc.
These coefficients were established for each
species from simultaneous measurements of
biovolume and biomass in several plots of 2500
cm
2
(20 plots by species in average), selected
to include a large variation in species
3523_book.fm Page 121 Tuesday, November 22, 2005 11:23 AM
Copyright © 2006 Taylor & Francis Group, LLC
122
Land Use Change and Mountain Biodiversity
abundance. The relationship between biovol-
ume and biomass was linear for all the species,
and the regression coefficient was always sig-
nificant. The best correlation was obtained for
Acaena elongata
(
r
2
= 0.90,
p
< 0.0001) and
the worst for
Poa annua
(
r
2
= 0.50,
p
= 0.049).
The coefficients were obtained forcing the lin-
ear regression to the origin. Values oscillate in
the range from 39 to 1774 g m
–2
, which means
that a biovolume of 1 (100 touches in 100
points) corresponds to a biomass of 1774 g m
–2
for the species with the largest coefficient
(
Espeletia schultzii
). As biovolume can be
higher than 1, this coefficient does not represent
a top limit to biomass. For some less-abundant
species, coefficients were not available, and we
used those of the more similar species in terms
of architecture.
A repeated-measures statistical analysis
(GLM) was carried out to test the overall sig-
nificance of the differences and to identify the
effect of the different factors. The age of the
plot (young and intermediate) was considered
as the between-subject factor; treatment (grazed
and excluded) and time (eight sampling occa-
sions) were the within-subject factors. Addi-
tionally, paired t-tests were used to compare the
mean values between the grazed and excluded
treatments over the 4 years. For these paired
tests, each pair consisted of the mean values of
the grazed and ungrazed treatments of the same
plot for a given variable. Statistical analyses
were carried out using SPSS (version 7.5). Bio-
mass data were log +1 transformed for the sta-
tistical tests.
An index of damage by grazing (ID) was
calculated for the different species from their
relative abundance in the grazed (G) and
ungrazed treatments (NG):
(NG-G)/G
≤
0.5
ID = 2, very positively affected
0.5 < (NG-G)/G < 0.1
ID = 1, positively affected
0.1
≤
(NG-G)/G
≤
0.1
ID = 0, not affected
0.1 < (NG-G)/G < 0.5
ID = +1, negatively affected
(NG-G)/G
≥
0.5
ID = +2, severely affected
RESULTS
P
LANT
B
IOMASS
, V
EGETATION
H
EIGHT
,
AND
P
ERCENTAGE
OF
B
ARE
S
OIL
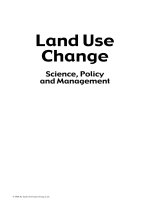
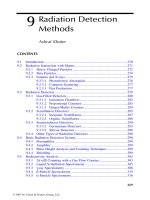
The effect of grazing on aboveground biomass,
vegetation height, and cover is presented in Fig-
ure 9.1, and the results of the repeated-measures
analysis is shown in Table 9.1. It can be
observed that: (1) The total aboveground bio-
mass was significantly lower in the young, com-
pared to the intermediate plots (age effect).
(2) Grazing significantly reduced plant biomass
(grazing effect). (3) The effect of grazing was
similar in the two successional ages (graz-
ing–age interaction). (4) Biomass changed sig-
nificantly over time (time effect). (5) The effect
of time was different in the two successional
ages (time–age interaction). (6) In the grazing
treatment, biomass increased at a faster rate
than in the excluded one (grazing–time interac-
tion). (7) The effect of grazing over time was
similar in both successional ages (graz-
ing–time–age interaction). On the average in
the 4 years of the experiment, aboveground bio-
mass was 338 g m
–2
and 585 g m
–2
in the grazed
and ungrazed young plots, and 606 g m
–2
and
878 g m
–2
in the grazed and ungrazed interme-
diate plots, respectively (Table 9.2). The final
biomass in the grazed young plots was higher
than the initial biomass in the intermediate
plots, indicating that the stocking rate in our
experiment was probably lower than that exist-
ing before the enclosures were made.
Another clear consequence of grazing was
the significant reduction in the weighed height
of the vegetation. For this variable, no signifi-
cant differences were detected between young
and intermediate plots (Table 9.1). In the grazed
young plots, the vegetation remained very low
during the 4 years of the experiment (weighed
average = 8.8 cm) compared to the ungrazed
plots in which the weighed height increased
from 7 to 20 cm. In the intermediate plots, the
height increased in both treatments but more in
the ungrazed one, passing from 8.5 to 15 cm
under grazing and to 19 cm under ungrazed
conditions.
The percentage of bare soil was also very
sensitive to grazing. At the beginning of the
experiment, 57% of the surface was uncovered
3523_book.fm Page 122 Tuesday, November 22, 2005 11:23 AM
Copyright © 2006 Taylor & Francis Group, LLC
Grazing Impact on Vegetation Structure and Richness in the Venezuelan Páramos
123
in the young plots and 49% in the intermediate
plots (Figure 9.1). After 6 months, the percent-
ages of bare soil decreased in all cases but
remained higher in the grazed treatment. On
average, the percentages of bare soil were 4 and
10 in the ungrazed and grazed young plots, and
11 and 25 in the intermediate ungrazed and
grazed plots, respectively. Differences between
grazed and ungrazed treatments were signifi-
cant but not between young and intermediate
plots. However, a very significant interaction
was found between grazing and time, indicating
that the reduction in the percentage of bare soil
occurred faster in the ungrazed treatment for
both ages. The high percentage of bare soil at
the beginning of the experiment in the young
plots is due to their recent abandonment after
harvest. In the case of the intermediate plots,
the high percentage of bare soil at the first sam-
pling date indicates, again, a possible higher
grazing pressure before the installation of the
experiment.
FIGURE 9.1
(A) Aboveground biomass, (B) weighted height of the vegetation, and (C) percentage of bare
soil in the excluded and grazed treatments. The bars of error represent the average standard deviation
.
1600
1200
800
400
20
15
10
60
40
20
0
0 1 2 3 4 5 6 7 8 9
5
Biomass (g m
−
2
)
Vegetation height (cm)
% of bare soil
Time in fallow (years)
Ungrazed
Grazed
A
B
C
3523_book.fm Page 123 Tuesday, November 22, 2005 11:23 AM
Copyright © 2006 Taylor & Francis Group, LLC
124
Land Use Change and Mountain Biodiversity
TABLE 9.1
Effects of age (young vs. intermediate plots), grazing (treatments), and time (consecutive
sampling dates during 4 years) on several vegetation parameters using a repeated-measures
analysis
Source
Parameter
Age Grazing
Grazing
×
Age Time
Time
×
Age Grazing
×
Time
Grazing
×
Time
×
Age
df
1
1
1
7
7
7
7
Biomass F
P
5.95
*
49.29
**
0.47
ns
14.46
**
2.18
*
4.93
**
1.47
ns
Height F
P
2.91
ns
33.96
**
1.61
ns
9.03
**
1.12
ns
6.05
**
1.94
ns
Percentage of
bare soil
F
P
5.17
ns
32.65
**
0.17
ns
13.42
**
2.30
*
6.20
**
1.44
ns
Percentage forbs F
P
28.75
*8
0.05
ns
3.45
ns
6.35
**
2.03
ns
2.26
*
1.69
ns
Percentage
grasses
F
P
0.40
ns
0.98
ns
3.35
ns
1.53
ns
1.84
ns
5.24
**
1.34
ns
Percentage shrubs F
P
11.91
*
0.36
ns
0.00
ns
17.73
**
14.09
**
1.05
ns
0.38
ns
Percentage
rosettes
F
P
24.23
*8
0.05
ns
0.03
ns
2.61
*
0.22
ns
1.59
ns
1.97
ns
Species richness F
P
5.12
*
21.03
**
3.43
ns
14.97
**
4.55
**
2.88
*
0.51
ns
*
Significant at
p
< .05.
**
Significant at
p
< .001.
TABLE 9.2
Total aboveground biomass and its distribution among the different life-forms in the
ungrazed (NG) and grazed (G) treatments
1–4 years
5–8 years
NG
g m
–2
(%)
G
g m
–2
(%)
NG
g m
–2
(%)
G
g m
–2
(%)
Total
aboveground
585
a
(100) 338
b
(100) 878
c
(100) 606
a
(100)
Forbs 370
a
(63
a
) 206
b
(61
a
)87
c
(10
b
)62
d
(10
b
)
Grasses 123
a
(21
a
)70
b
(21
a
) 119
a
(14
a
)50
b
(8
b
)
Shrubs 82
a
(14
a
)48
b
(14
a
) 358
c
(41
b
) 204
d
(34
b
)
Giant rosettes 9
a
(2
a
)15
a
(4
a
) 314
b
(36
b
) 291
b
(48
c
)
Note: Values are the average over the 4 years of the experiment, excluding the first sampling.
a–d
Different letters indicate significant differences between treatments (p < 0.05; t-test for dependent samples).
3523_book.fm Page 124 Tuesday, November 22, 2005 11:23 AM
Copyright © 2006 Taylor & Francis Group, LLC
Grazing Impact on Vegetation Structure and Richness in the Venezuelan Páramos 125
LIFE-FORM SPECTRUM OF THE
V
EGETATION
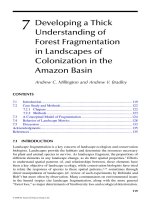
The relative contribution of the main life-forms
(forbs, grasses, giant rosettes, and shrubs) to the
total aboveground biomass is shown in Figure
9.2. In Table 9.1, the results of the repeated-
measures analysis are shown and in Table 9.2,
the mean values over the study period. The rel-
ative contribution of forbs to the total above-
ground biomass experienced a clear and signif-
icant decrease over time, whereas shrubs and
rosettes increased. No significant temporal
trends were detected using the repeated-mea-
sures analysis in the percentage of grasses (age
and time effects not significant).
Despite the reduction in total biomass by
grazing, the repeated-measures analysis shows
that the effect of grazing on the life-form spec-
trum was not significant, indicating a propor-
tional reduction in the biomass of the four life-
forms. Nevertheless, for forbs and grasses, there
is an interaction between grazing and time
(Table 9.1). The comparison of the mean values
over time (Table 9.2), using a t-test for depen-
dent samples, shows that grazing did not change
the perceptual contribution of the different life-
forms in the young plots. However, in the inter-
mediate plots, grazing caused a significant
reduction in the percentage of grasses (from 14
to 8% of total aboveground biomass) and an
increase in giant rosettes (from 36 to 48%).
It is rather surprising that grasses and forbs,
the main targets of herbivory, do not experience
a more important proportional decrease in bio-
mass. An explanation will arise from the anal-
ysis of the response of the individual species.
PLANT SPECIES RICHNESS
The method used to quantify plant species rich-
ness (100 points in 100 m
–2
) underestimates the
total number of species in the plot, as curves of
numbers of species do not saturate after 100
points (results not shown). Consequently, val-
ues have to be interpreted only comparatively.
The maximum number of species recorded in
a particular plot was 23, which is low compared
to the almost 200 species reported for the whole
valley.
FIGURE 9.2 Percentage of the total aboveground biomass represented by the different life-forms in the
excluded and grazed treatments. The bars of error represent the average standard deviation.
80
60
40
20
80
60
40
20
% of total biomass
123456789 123456789
Time in fallow (years)
Shrubs Rosettes
GrassesForbs
Ungrazed
Grazed
3523_book.fm Page 125 Tuesday, November 22, 2005 11:23 AM
Copyright © 2006 Taylor & Francis Group, LLC
126 Land Use Change and Mountain Biodiversity
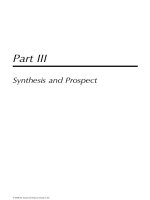
There is a significant effect of age and time
on plant species richness (Figure 9.3 and
Table 9.1), indicating that diversity increases
during succession. The rate of increase was sig-
nificantly higher in the young compared to the
intermediate plots. In the intermediate plots, the
most important change in the number of species
was between the first and the second samplings,
when the number of species increased from an
average of 8 to an average of 16 as a conse-
quence of fencing out the plots.
Grazing produced a statistically significant
but slight reduction in plant species richness
(Table 9.1), but it is remarkable that richness
did not differ at the last sampling date, suggest-
ing that the effect of grazing at this stocking
rate could be only temporal (Figure 9.3). The
initial richness of the intermediate plots, at the
first sampling date, was lower than at the end
point of the young plots, again suggesting a
higher grazing pressure before the start of the
experiment. Consequently, a bigger effect of
grazing on plant richness could be expected at
higher grazing pressures.
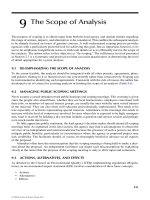
To analyze the factors that influence plant
diversity in this old-field succession, a multiple
regression (forward stepwise) was carried out
using plant richness as dependent variable, and
successional time, percentage of bare soil, total
aboveground biomass, weighed height of the
vegetation, stoniness, slope, soil texture, total
soil nitrogen, and soil total carbon as indepen-
dent variables. The forward stepwise procedure
selected four variables that explained 69% of
the variability in plant richness. The included
variables were: biomass (B, in g m
–2
), which
explains 47% of the variability, slope of the plot
(S, in degrees), which explains an additional
11% of the variability, bare soil (BS, in %),
which explains 7%, and successional age (SA,
in years), which explains 3.6% more. The inclu-
sion of further variables did not significantly
increase the total amount of variance explained.
The equation for the multiple regression is:
Richness =
5.02 + 0.06 B + 0.11 S – 0.07 BS + 0.41 SA
A logarithmic function of plant biomass
explains more variability (74%) than the mul-
tiple lineal regression (Figure 9.4).
RESPONSE OF INDIVIDUAL SPECIES
Over the whole experiment, 61 species were
recorded: 17 grasses, 33 forbs, 10 shrubs, and
1 giant rosette. Among these, 28 had a very low
abundance and will not be considered further.
The successional behavior of the 33 other spe-
cies and their response to grazing is presented
in Table 9.3, including the consumption prefer-
ence by cattle of the different plant species,
according to Molinillo and Monasterio (1997),
complemented with personal observations.
FIGURE 9.3 Species richness in the excluded and grazed treatments. The bar of error represents the average
standard deviaion.
20
15
10
5
0
Number of species
123456789
Time in fallow (years)
Ungrazed
Grazed
3523_book.fm Page 126 Tuesday, November 22, 2005 11:23 AM
Copyright © 2006 Taylor & Francis Group, LLC
Grazing Impact on Vegetation Structure and Richness in the Venezuelan Páramos 127
There are contrasting successional patterns
(Table 9.3 and Figure 9.5). A group of species
was more abundant in early succession com-
pared to intermediate succession: Rumex ace-
tosella, Erodium cicutarium, Gnaphalium ele-
gans, Penisetum clandestinum, Bromus
carinatus, Poa annua, Lachemilla moritziana,
and Lupinus meridanus; all of them, except the
last two, introduced species. Another group of
species was more abundant during the interme-
diate succession: Espeletia schultzii, Acaena
elongata, Aciachne pulvinata, Hypericum lari-
cifolium, Oenothera epilobifolia, Orthosanthus
chimboracensis, Brachypodium mexicanum,
and Nassella linerifolia, all of them native spe-
cies. The rest of the species did not present
significant differences between young and
intermediate plots.
In Figure 9.5, the successional behavior of
some representative species can be observed.
For example, Rumex acetosella decreased reg-
ularly with time, with a very significant effect
of age and time (Table 9.4). Lachemilla moritz-
iana and Trisetum irazuens have their peaks of
abundance after 2 and 4 years of succession,
respectively, with very regular curves of
increase and posterior decrease in abundance.
Other species, such as Espeletia schultzii and
Hypericum laricoides, showed a progressive
and significant increase in abundance with time.
Analyzing the effect of grazing on above-
ground biomass (absolute values in Table 9.3),
it can be observed that only four species sig-
nificantly increased their biomass and can be
considered as promoted by grazing: Aciachne
pulvinata, Erodium cicutarium, Penisetum
clandestinum, and Poa annua. Three of these
species are introduced. Twelve species
decreased their biomass and can be considered
as damaged by grazing: Acaena elongata, Bac-
charis prunifolia, Brachypodium mexicanum,
Gamochaeta americana, Geranium
chamaense, Hypericum laricifolium,
Lachemilla moritziana, Nassella linerifolia,
Noticastrum marginatum, Rumex acetosella,
Sisyrinchium tinctorum, and Trisetum irazue-
nse. The remaining 17 species listed in Table
9.3 did not show a significant change in biom-
ass and can be considered as not affected by
grazing. In this unaffected group, there are sev-
eral grasses, such as Agrostis jahnii, Agrostis
trichodes, and Vulpia myurus, that are con-
sumed by animals but with an intermediate
preference; the only giant rosette recorded,
Espeletia schultzii, which is not consumed by
cattle; a legume, Lupinus meridanus, rejected
due to its toxic composition; and several forbs
that are not consumed by animals, such as
Gnaphalium elegans and Gnaphalium meri-
danum.
Apart from the absolute changes in bio-
mass, grazing also affected the relative pro-
portion between species (values in parentheses
in Table 9.3). These relative changes give addi-
tional information concerning the structural
transformation of the vegetation. Several
FIGURE 9.4 Relationships between plant biomass and richness using the data of all vegetation samplings.
A logarithmic function was adjusted to the points (p < 0.001).
20
25
15
10
5
0
Number of species
0 500 1000 1500 2000
Biomass (gm
−2
)
r
2
= 0.74
3523_book.fm Page 127 Tuesday, November 22, 2005 11:23 AM
Copyright © 2006 Taylor & Francis Group, LLC
128 Land Use Change and Mountain Biodiversity
trends are possible: (1) a reduction in biomass
not accompanied by a reduction in the relative
contribution of the species, (2) a reduction in
biomass and in the relative contribution of the
species, (3) a reduction in biomass but an
increase in the relative contribution of the spe-
TABLE 9.3
Aboveground biomass and perceptual contribution (in parentheses) of the main species in
the ungrazed (NG) and grazed (G) treatments
Species P LF
Biomass
1–4 years
g m
–2
(%)
Biomass
5–8 years
g m
–2
(%) ID
NG G NG G
Acaena elongata 3 S 7.8
a
(1.2
a
) 3.9
b
(1.2
a
) 68.8
c
(7.1
b
) 40.2
d
(6.6
b
)
0
Aciachne pulvinata 5 G 0.1
a
(0.0
a
) 0.0
a
(0.0
a
) 7.8
b
(0.8
b
) 12.9
c
(2.1
c
)2
Agrostis jahnii 2 G 22.4
a
(3.4
a
) 13.9
a
(4.1
a
) 5.3
ab
(0.6
ab
) 3.3
b
(0.5
b
)0
Agrostis trichodes 2 G 11.9
a
(1.8
ac
) 3.2
b
(0.9
b
) 35.1
a
(3.6
ab
) 13.5
a
(2.2
c
)+1
Baccharis prunifolia 5 S 67.7
ab
(10.4
a
) 44.0
a
(13.0
b
) 91.8
b
(9.4
ab
) 43.6
a
(7.2
ab
)0
Brachypodium mexicanum 1 G 0.0
a
(0.0
a
) 0.0
a
(0.0
a
) 2.9
b
(0.3
b
) 0.0
a
(0.0
a
)+2
Bromus carinatus 1 G 22.1
a
(3.4
a
) 18.2
a
(5.4
a
) 4.5
b
(0.5
b
) 1.1
c
(0.2
c
)0
Erodium cicutarium — F 0.3
a
(0.0
a
) 2.6
b
(0.8
b
) 0.0
a
(0.0
a
) 0.0
a
(0.0
a
)2
Espeletia schultzii 5 R 10.8
a
(1.6
a
) 15.2
a
(4.5
b
) 349.1
b
(35.7
b
) 291.4
b
(48.0
c
)2
Gamochaeta americana 4 F 8.1
a
(1.2
a
) 2.6
b
(0.8
ab
) 6.0
a
(0.6
b
) 2.6
a
(0.4
b
)+1
Geranium chamaense 3 F 16.0
a
(2.5
a
) 7.1
bc
(2.1
ab
) 8.4
b
(0.9
bc
) 3.5
c
(0.6
c
)+1
Gnaphalium elegans 4 F 3.5
ab
(0.5
ab
) 0.3
a
(0.1
a
) 0.0
b
(0.0
b
) 0.0
b
(0.0
b
)+2
Gnaphalium meridanum 4 F 1.4
a
(0.2
ab
) 0.5
a
(0.2
ab
) 0.9
a
(0.1
b
) 1.1
a
(0.2
a
)1
Hypericum laricifolium 5 S 16.0
a
(2.5
a
) 2.7
b
(0.8
b
) 210.2
c
(21.5
c
) 108.0
d
(17.8
c
)+1
Lachemilla moritziana 3 F 42.5
a
(6.5
a
) 33.0
b
(9.8
b
) 13.3
c
(1.4
c
) 8.7
d
(1.4
c
)1
Laennecia mima 5 F 2.5
a
(0.4
a
) 1.1
a
(0.3
a
) 0.2
a
(0.0
a)
0.1
a
(0.0
a
)+1
Lupinus meridanus 5 F 14.1
a
(2.1
a
) 7.4
ab
(2.2
a
) 2.2
b
(0.2
b
) 1.5
b
(0.3
b
)0
Nassella linerifolia 1 G 1.2
a
(0.2
a
) 0.0
b
(0.0
b
) 30.4
c
(3.1
c
) 1.0
a
(0.2
a
)+2
Nassella mexicana 2 G 4.6
a
(0.7
a
) 0.0
a
(0.0
a
) 1.4
a
(0.1
a
) 0.2
a
(0.0
a
)+2
Nassella mucronata 1 G 1.1
a
(0.2
a
) 0.1
a
(0.0
a
) 0.0
a
(0.0
a
) 0.0
a
(0.0
a
)+1
Noticastrum marginatum — F 0.9
a
(0.1
ab
) 0.3
a
(0.1
a
) 2.8
b
(0.3
b
) 1.7
a
(0.3
ab
)+1
Oenothera epilobifolia — F 0.0
a
(0.0
a
) 0.8
a
(0.2
ab
) 3.3
b
(0.3
b
) 3.5
b
(0.6
c
)2
Orthosanthus chimboracensis 5 F 0.5
a
(0.1
a
) 0.4
a
(0.1
a
) 5.7
b
(0.6
b
) 4.5
b
(0.7
b
)1
Oxylobus glanduliferus 5 F 0.4
ab
(0.1
ab
) 0.1
a
(0.1
b
) 2.1
ab
(0.1
a
) 1.8
b
(0.3
a
)0
Paspalum pygmaeum 1 G 0.2
a
(0.0
a
) 0.3
a
(0.1
a
) 0.5
a
(0.1
a
) 1.0
a
(0.2
a
)2
Penisetum clandestinum 1 G 0.1
a
(0.0
a
) 10.1
b
(3.0
b
) 0.0
a
(0.0
a
) 0.0
a
(0.0
a
)2
Poa annua 2 G 2.8
a
(0.4
a
) 5.2
b
(1.6
b
) 0.0
c
(0.0
c
) 0.0
c
(0.0
c
)2
Rumex acetosella 3 F 320.4
a
(49.7
a
) 148.2
b
(43.5
a
) 44.9
c
(4.6
b
) 31.4
d
(5.1
b
)0
Sisyrinchium tinctorum 5 F 5.7
a
(0.9
a
) 1.8
bc
(0.5
a
) 8.6
a
(0.9
a
) 3.7
c
(0.6
a
)+1
Stevia elatior 5 F 1.1
a
(0.2
a
) 0.6
a
(0.2
a
) 1.2
a
(0.1
a
) 0.5
a
(0.1
a
)0
Stevia lucida 5 S 0.0
a
(0.0
a
) 0.0
a
(0.0
a
) 15.4
b
(1.6
b
) 9.5
b
(1.6
b
)0
Trisetum irazuense 1 G 42.8
a
(6.6
a
) 3.5
b
(1.0
b
) 28.2
a
(2.9
a
) 2.5
b
(0.4
b
)+2
Vulpia myurus 3 G 17.0
a
(2.6
a
) 8.2
a
(2.4
a
) 12.2
a
(1.2
a
) 9.4
a
(1.5
a
)0
Note: The values are averages for the 4 years of the experiment. The values of the palatability index were taken from
Molinillo and Monasterio (1997), and completed or modified using personal observations.
P is an index of palatability in a relative scale 1 = preferred, 2 = good, 3 = regular, 4 = insufficient, 5 = rejected. Life-form
(LF) abbreviations are F = forb, G = grass, S = shrub, R = giant rosette. The index of damage (ID) is: +2 = very positively
affected, +1 = positively affected, 0 = not affected, 1 = negatively affected, and 2 = very negatively affected.
a–d
Different letters indicate significant differences between treatments (p < .05, t-test for dependent samples).
3523_book.fm Page 128 Tuesday, November 22, 2005 11:23 AM
Copyright © 2006 Taylor & Francis Group, LLC
Grazing Impact on Vegetation Structure and Richness in the Venezuelan Páramos 129
cies, (4) an increase in the absolute and pro-
portional biomass, and (5) no change in bio-
mass but an increase in proportion. Situation
1 indicates that the species is consumed or
damaged as a function of its biomass, without
a preferential positive or negative selection.
This is the case of Rumex acetosella (see also
Figure 9.5), Acaena elongata, Baccharis
prunifolia, and Hypericum laricoides
(Figure 9.5), among others. Situation 2 indi-
cates a preferential consumption or damage,
as is the case with only three species: Trisetum
irazuens (Figure 9.5), Brachypodium mexi-
canum, and Nassella linerifolia (Figure 9.5),
all tall grasses with a very high palatability
and accessibility to animals. Situation 3 indi-
cates a little negative selection and is only
found in the case of Noticastrum marginatum.
Situation 4 indicates that the effect of grazing
is positive, as in the case of Poa annua, Aci-
achne pulvinata (Figure 9.5), Erodium cicu-
tarium, and Penisetum clandestinum (Figure
9.5). Situation 5 indicates that the species is
not consumed or damaged by animals but indi-
rectly favored as its proportion in the total
biomass increased. This is the case of Espele-
tia schultzii (Figure 9.5), whose biomass
remained constant but increased its relative
contribution from 36 to 48% in the intermedi-
ate plots. Another species with the same
behavior is Oenothera epilobifolia, a prostrate
forb.
The last column of Table 9.3 presents the
index of damage by grazing. The more fragile
species are grasses with a high palatability, such
as Trisetum irazuense, Brachypodium mexi-
FIGURE 9.5 Percentage of the total biomass of some representative species along the 4 years of the study
in the excluded and grazed treatments. The bars of error represent the average standard deviation.
100
80
60
40
20
0
16
12
8
4
0
12
8
4
0
30
20
10
0
0 2 4 6 8 0 2 4 6 8 10
% o
f
tota
l
b
iomass
12
8
4
0
45
30
15
0
6
4
2
0
6
4
2
0
Time (
y
ears)
Rumex acetosella Trisetum irazuense
Espeletia schultziiLachemilla moritziana
Penisetum clandestinum Nassella linerifolia
Hypericum laricifolium Aciachne pulvinata
3523_book.fm Page 129 Tuesday, November 22, 2005 11:23 AM
Copyright © 2006 Taylor & Francis Group, LLC
130 Land Use Change and Mountain Biodiversity
canum, and Nassella linerifolia, which are
preferentially consumed by cattle but appar-
ently do not have efficient mechanisms to resist
this kind of disturbance. The shrub Hypericum
laricoides also appears as a fragile species,
probably due to trampling.
Data in Table 9.3 also suggest that the intro-
duced species Bromus carinatus and Penisetum
clandestinum, and in a lesser measure, the
native species Agrostis jahnii, are good sources
of forage. These species have a high palatability
but do not suffer significant damage when
grazed.
Some species that are not negatively
affected by grazing are Espeletia schultzii,
Rumex acetosella, Paspalum pygmaeum, Stevia
lucida, and Vulpia myurus. Espeletia schultzii
is rejected by cattle and is not sensitive to tram-
pling. Paspalum pygmaeum evades grazing by
its creeping habit. Rumex acetosella, a Euro-
pean weed, is not preferentially selected but, as
it is the most abundant species at the beginning
of the succession, it represents an important
percentage of animal diets. Nevertheless the
growth form of this species (a rhizomatous
herb) allows it to tolerate grazing.
Table 9.3 shows that the lack of response
to grazing of the grasses, as a life-form, is due
to a very contrasting response of the individual
species. Caespitose grasses (such as Penisetum
clandestinum and Aciachne pulvinata) and
creeping grasses (such as Poa annua and
Paspalum pygmaeum) are favored by grazing,
probably because they are tolerant, as does Pen-
isetum clandestinum, or because they have
mechanisms of evasion, as does Aciachne pulvi-
nata, a thorny prostrate species, or Paspalum
pygmaeum, a very small species that concen-
trates its biomass in 1 or 2 cm above the soil
surface. On the other hand, tall grasses (such
as Trisetum irazuense and Bromus carinatus)
are preferentially consumed.
TABLE 9.4
Effects of age (young vs. intermediate plots), grazing (treatments), and time (consecutive
sampling dates during 4 years) on several vegetation parameters using a repeated-measures
analysis
Parameter Age Grazing
Grazing
a
Age Time
Time
a
Age
Grazing
a
Time
Grazing
a
Time
a
Age
df 1 1 1 7 7 7 7
Rumex
acetosella
F
P
85.5
**
0.17
ns
4.31
ns
6.49
**
2.32
*
2.41
*
1.67
ns
Lachemilla
moritziana
F
P
10.48
*
7.47
*
2.13
ns
11.28
**
1.57
ns
1.14
ns
0.34
ns
Trisetum
irazuense
F
P
0.04
ns
11.84
*
0.28
ns
1.51
ns
3.87
*
1.12
ns
3.84
*
Penisetum
clandestinum
F
P
3.38
ns
3.61
ns
3.61
ns
4.35
*
4.35
*
4.27
*
4.27
*
Espeletia
schultzii
F
P
45.58
**
0.03
ns
0.07
ns
2.49
*
0.31
ns
1.60
ns
2.25
*
Hypericum
laricifolium
F
P
11.41
*
3.50
ns
0.35
ns
4.21
*
1.72
ns
2.26
*
0.51
ns
Nassella
linerifolia
F
P
2.86
ns
5.10
*
2.91
ns
0.29
ns
0.54
ns
1.26
ns
1.36
ns
Aciachne
pulvinata
F
P
1.16
ns
1.33
ns
1.51
ns
1.29
ns
1.15
ns
0.84
ns
1.27
ns
Poa annua F
P
15.19
*
3.67
ns
3.44
ns
9.90
**
9.89
**
3.17
*
2.9
*
*
Significant at p < .05.
**
Significant at p < .001.
3523_book.fm Page 130 Tuesday, November 22, 2005 11:23 AM
Copyright © 2006 Taylor & Francis Group, LLC
Grazing Impact on Vegetation Structure and Richness in the Venezuelan Páramos 131
DISCUSSION
The aboveground biomass after 8 to 9 years of
succession (606 and 878 g m
–2
on average for
the grazed and ungrazed treatment, respec-
tively) lies in the low part of the range reported
by Hofstede (1995) for several Colombian
páramos (735 to 3486 g m
–2
). This difference
can be explained considering that our plots are
still in a relatively early successional phase and
that Venezuelan páramos are drier and probably
less productive than the Colombian ones. Our
estimations are closer to the values reported by
Ramsay and Oxley (2001) for a grassland
páramo in Ecuador (800 g m
–2
), but this kind
of páramo does not have giant rosettes and
shrubs, which account for an important part of
the total aboveground biomass in late succes-
sion in Venezuela. In the same area of our
study, Montilla et al. (2002) measured, using
harvest techniques, a total aboveground biom-
ass of 952 g m
–2
in a 12-year successional plot,
in the same order of magnitude as the figures
obtained using the biovolume–biomass coeffi-
cients in the 9-year plots, a result that partially
validates our method.
One of the most noticeable effects of graz-
ing in this secondary succession was the reduc-
tion of plant aboveground biomass under exten-
sive grazing. Other studies in the páramo
confirm this trend; for example, Hofstede
(1995) reported a total aboveground biomass of
3486 g m
–2
in an undisturbed Colombian
páramo, compared to 2567 g m
–2
in a similar
but extensively grazed area. This 26% reduction
in biomass can be compared to the 30 to 40%
reduction found in this study. Furthermore,
Molinillo and Monasterio (1997) also reported
an increase in biovolume of 52% after 1 year
of grazing exclusion for a Venezuelan
rosette–shrub páramo community.
A decrease in biomass is not an obvious or
generalized response of vegetation to grazing.
For example, in natural alpine grasslands in the
Alps, Körner (1999) found that very extensive
grazing had a positive effect on biomass due to
the stimulation of nutrient cycling. An increase
in biomass, production, richness, or other eco-
system properties under moderate disturbance
is reported in many ecosystems and is explained
by the intermediate disturbance hypothesis.
However, at a high intensity of disturbance, the
normal response is a reduction in biomass due
to the diminution of the LAI and of the photo-
synthetic capacity of the vegetation. In the case
of the páramo, we have no evidences of a pos-
sible augmentation of biomass under very
extensive grazing, but our data suggest that the
deleterious effect occurs at relatively low graz-
ing pressure.
The stocking rate of this experiment, esti-
mated at 0.4 cows ha
–1
, can be considered as
high compared to the carrying capacity of 0.1
cows ha
–1
reported by Molinillo and Monasterio
(1997) for a drier rosette–shrub páramo and to
the mean animal stocking rate of the valley esti-
mated in 0.13 cows ha
–1
(Pérez 2000). Never-
theless, we consider that the effective stocking
rate was not as high as it seems. According to
Schmidt and Verweij (1992), the daily dry mat-
ter intake by adult cows grazing in páramo eco-
systems is around 11.8 kg. Assuming 12 h of
grazing per day, the consumption in 1 h can be
estimated in 980 g, or 9.8 g m
–2
for a 100-m
2
plot. This figure corresponds to a consumption
of 2 to 4% of the total aboveground bio-mass
per month, which is not a very high proportion
of the total biomass. In addition, the rotative
grazing method (only 1 h each, 3 weeks) prob-
ably allows vegetation to recover between two
consecutive events of grazing. Furthermore, our
results suggest that the stocking rate before the
installation of the fences was higher than under
the grazing treatment (lower biomass and rich-
ness and higher percentage of bare soil in the
initial intermediate plots compared with the final
point of the grazed young plots). Further
research is needed to arrive at more conclusive
results concerning the response of biomass and
other attributes to different intensities of grazing
in this ecosystem.
The decrease in plant biomass observed
under this stocking rate can have different con-
sequences for the functioning and stability of
the ecosystem, but an accurate prediction is
difficult to make because of the existence of
compensatory mechanisms and nonlinear pro-
cesses in ecosystems. As a first approximation,
we can predict that a reduction in biomass,
mainly in the photosynthetic one, may produce
a reduction in net primary production due to
less light interception. Consequently, a
3523_book.fm Page 131 Tuesday, November 22, 2005 11:23 AM
Copyright © 2006 Taylor & Francis Group, LLC
132 Land Use Change and Mountain Biodiversity
reduced amount of necromass would be incor-
porated into the soil, leading to a progressive
depletion in soil organic matter (SOM), which
in turn can reduce the soil’s capacity to retain
water and nutrients. However, trends in SOM
are only detectable in mean and long-term
studies, due to the large amount initially
present in these mountain soils. A decrease in
SOM, together with the increase in the pro-
portion of bare soil under grazing, could favor
erosive processes and could negatively affect
the sustainability of the system. This is the
case documented by Podwojewski et al. (2002)
in an intensive sheep-grazed páramo in Ecua-
dor, where a dramatic decrease of SOM took
place as a consequence of the decrease in plant
biomass, the exportation of sheep manure, and
by soil surface erosion favored by the
increased percentage of bare soil and the
mechanical effect of animals. Nevertheless, in
our case, contrabalancing processes can also
be taking place; for example, if the species
with higher nitrogen content were consumed
preferentially, litter quality and also decompo-
sition rates would decrease, compensating for
the reduction in the amount of litter. No defin-
itive conclusions concerning the effect of graz-
ing on ecosystem properties can be derived
from this experiment, and further experimental
work is necessary to test the consequences of
changes in quality and quantity of plant bio-
mass. Also, a simulation approach could give
further insights.
Only small changes were detected in the
life-form spectrum of the vegetation. Possible
trends toward a reduction in the proportion of
grasses and an increase in the proportion of
giant rosettes were observed at the end of the
experiment in the intermediate plots. In a
Colombian páramo, Hofstede (1995) observed
an increase in the density and biomass of giant
rosettes (Espeletia hartwegiana) as a conse-
quence of grazing and in absence of burning.
However, Verweij and Kok (1992) reported dif-
ferent results for the same species. Vargas et al.
(2002) reported a deleterious effect of grazing
on Espeletia killipii. These inconsistencies can
be related to different grazing intensities or to
the interaction between grazing and burning.
The classification of the species in four life-
forms is too general to analyze the structural
changes produced by grazing, as species
belonging to the same life-form can present
different responses. A more detailed classifica-
tion is necessary to assess the effect of grazing
on functional types of plants, which should take
into consideration more specific traits influenc-
ing the way plants are affected by grazing (pal-
atability, mechanical fragility, grazing defenses,
etc.). This approach could be interesting when
comparing different sites in terms of ecological
equivalents. Using a more detailed classifica-
tion of grasses, the diminution of tall and short
grasses, and the increase in creeping and rhi-
zomatous grasses can be identified as grazing
effects. Other authors also reported the replace-
ment of tall and tussock grasses by a short car-
pet grass vegetation in páramo ecosystems
(Verweij and Budde 1992; Hofstede 1995; Pod-
wojewski et al. 2002).
Independently of grazing, the abundance of
giant rosettes and shrubs increases in the suc-
cession and, consequently, the offer of forage
decreases. Early plots seem to be more suitable
for grazing than intermediate and late ones, and
decisions by farmers concerning the duration of
the fallow period probably take this aspect into
consideration.
In this experiment, grazing produced a
slight but consistent reduction in plant diversity.
In literature, different responses of plant rich-
ness have been reported, depending on the
intensity of grazing and on the characteristics
of the species that conform the community.
Körner (1999) reported, for an alpine grassland
in the Alps, a positive effect of extensive graz-
ing, whereas Podwojewski et al. (2002)
reported a diminution of the number of species
under intensive grazing in the páramo. In our
experiment, the abundance of some of the spe-
cies was dramatically reduced, but they did not
disappear completely, explaining the small
changes observed in plant richness. A stronger
effect would be expected with higher grazing
pressures.
The observed reduction in biodiversity is in
accordance with the hypothesis that in poor
environments such as the páramo, grazing
reduces plant richness, whereas in rich environ-
ments, plant richness can be increased (Milchu-
nas and Lauenroth 1993). Grazing can promote
plant biodiversity by balancing competitive
3523_book.fm Page 132 Tuesday, November 22, 2005 11:23 AM
Copyright © 2006 Taylor & Francis Group, LLC
Grazing Impact on Vegetation Structure and Richness in the Venezuelan Páramos 133
interactions between species, reducing compe-
tition for light, promoting dispersion, and cre-
ating more recruitment opportunities for subor-
dinate species (Berendse 1985; Milchunas and
Lauenroth 1993; Bakker 2003). For example,
Bakker (2003) found, in a grassland in the Neth-
erlands, a negative correlation between the
height of the vegetation and plant richness and
a positive correlation between richness and the
percentage of bare soil, indicating that in this
environment, competition for light and the
existence of opportunities for establishment are
the main factors controlling plant richness.
However, in the páramo, the situation seems to
be the opposite. Plant richness is positively cor-
related to plant biomass and negatively corre-
lated to the amount of bare soil, indicating that
other factors are controlling plant biodiversity.
Light competition does not appear to be an
important factor controlling diversity, probably
because even without grazing, there is a signif-
icant proportion of bare soil. In general, the
effect of herbivory on plant species diversity is
mainly determined by the response of the sub-
ordinate species. In the páramo, grazing seems
to enhance the abundance of the dominant spe-
cies that are less palatable and to promote the
extinction of some of the subordinate species
that are more palatable. On the other hand,
regeneration niches do not seem to be limiting,
and herbivores are not expected to increase the
opportunities of colonization. In this páramo,
succession grazing seems to promote extinction
without favoring colonization.
At the level of individual species, the effect
of grazing in this old-field succession is clear;
it promotes some species, damages others, and
does not affect a third group. This differential
effect can be related to the palatability of the
species, their adaptations to tolerate or avoid
herbivory, and their mechanical fragility.
According to Körner (1999), the impact of graz-
ing on alpine vegetation is much more severe
by trampling than by direct consumption due
to the extreme sensitivity of shrub communities.
The sensitivity of Hypericum laricifolium
observed in this study and by Molinillo and
Monasterio (1997), and explained by the fragil-
ity of its branches, supports this affirmation.
The positive effect of grazing on some
páramo species, mainly creeping and prostrate
life-forms such as Aciachne pulvinata and
Lachemilla orbiculata, is widely recognized in
the literature (Verweij and Budde 1992; Hoft-
ede 1995). Also, the positive impact on some
introduced species, such as Poa annua, Tarax-
acum officinaris, and Rumex acetosella, is
reported in other studies (Velázquez 1992; Ver-
weij and Budde 1992; Pels and Verweij 1992;
Podwojewski et al. 2002).
The positive response to grazing of the
introduced species and their strong dominance
in early succession, documented in a previous
study by Sarmiento et al. (2003), indicate that
current management favors the invasion of the
páramo by ruderal species. These probably have
more adaptations to herbivory, because they
evolved in other environments in which this
kind of disturbance is common.
As a conclusion, it can be said that at the
moderate stocking rate used in this experiment,
some negative effects of grazing were detected,
but they are less important than expected, con-
sidering the short history of grazing of this eco-
system. A certain level of grazing is probably
compatible with the restoration of the páramo
ecosystem without severely threatening plant
biodiversity. Nevertheless, additional studies
are necessary to evaluate more accurately the
impact of grazing on SOM and on the long-
term stability of the system, and to determine
the appropriate stocking rate.
SUMMARY
An exclosure experiment was carried out to
analyze the effect of grazing on plant biomass
and vegetation composition during secondary
succession in a Venezuelan páramo. Four young
plots (never in fallow) and four intermediate
plots (5 years in fallow) of 200 m
2
each were
fenced and divided into two parts; one was
excluded and the other was grazed during
4 years using a stocking rate equivalent to 0.4
cows ha
–1
. The vegetation was sampled twice a
year using the point intercept method. At this
stocking rate, grazing produced a reduction of
30 to 40% of total aboveground plant biomass.
Vegetation height was reduced in the same
order, and the percentage of bare soil increased
significantly. Despite the reduction in above-
ground biomass, the life-form spectrum of the
3523_book.fm Page 133 Tuesday, November 22, 2005 11:23 AM
Copyright © 2006 Taylor & Francis Group, LLC
134 Land Use Change and Mountain Biodiversity
vegetation was only slightly affected, indicating
that grazing impact was almost homogeneous
for the different life-forms. A possible augmen-
tation in the percentage of giant rosettes in the
intermediate plots was detected at the end of
the experiment in the grazed treatment. This is
probably due to the total rejection of rosettes
by cattle and to the low impact of trampling on
this life-form. Grazing also reduced plant spe-
cies richness slightly, but significantly, and a
more severe effect could be expected from a
higher grazing pressure. The response of indi-
vidual species was very clear. An index of dam-
age allowed classifying them into the follow-
ing: damaged by grazing (e.g. Trisetum
irazuense, Nassella linerifolia, Brachypodium
mexicanum, etc.), unaffected (e.g. Acaena elon-
gata, Baccharis prunifolia, Lupinus meridanus,
etc.), and positively affected (e.g. Aciachne
pulvinata, Espeletia schultzii, Penisetum clan-
destinum, etc.). Some explanations of the indi-
vidual responses are advanced based on the
preferences by cattle, plant architecture, and
sensitivity to trampling.
ACKNOWLEDGMENTS
This research was supported by the Interna-
tional Foundation for Science (Grant C/2668)
and by the EU project TROPANDES (ICI8-
CT98-0263). The author received a fellowship
from the Wageningen Institute for Environment
and Climate Research for the redaction of the
paper. Thanks to A. Escalona, N. Marquez, A.
Olivo, C. Molina, A. Berg, and B. Briceño for
their participation in the fieldwork and in botan-
ical identifications. J.K. Smith and L.D. Llambí
also helped in the selection and installation of
the plots. Specials thanks to Cristobal, Alfonso,
Gregorio, Sra. Rosa and Sra. Hilbina of the
páramo de Gavidia for handling the animals that
grazed the plots.
References
Abadín, J., González-Prieto, S.J., Sarmiento, L., Vil-
lar, M.C., and Carballas, T. (2002), Succes-
sional dynamics of soil characteristics in a
long fallow agricultural system of the high
tropical Andes, Soil Biology and Biochem-
istry, 34(11): 1739–1748.
Bakker, E. (2003), Herbivores as Mediators of Their
Environment: the Impact of Large and Small
Species on Vegetation Dynamics, Ph.D. the-
sis, Wageningen University, Wageningen.
Berendse, F. (1985), The effect of grazing on the
outcome of competition between plant spe-
cies with different nutrients requirement,
Oikos, 44: 35–39.
Davidson, D.W. (1993), The effects of herbivory and
granivory on terrestrial plant succession,
Oikos, 68: 23–35.
Gough, L. and Grace, J.B. (1998), Herbivore effects
on plant species diversity at varying produc-
tivity levels, Ecology, 79: 1586–1594.
Greig-Smith, P. (1983), Quantitative Plant Ecology,
University of California Press, Berkeley.
Hofstede, R.G.M. (1995), Effects of Burning and
Grazing on a Colombian páramo Ecosystem.
Ph.D. thesis, University of Amsterdam,
Amsterdam.
Hofstede, R.G.M., Modragon, M.X., and Rocha,
C.M. (1995), Biomass of grazed, burned and
undisturbed páramo grasslands, Colombia,
Aboveground vegetation, Artic and Alpine
Research, 27: 1–12.
Huntly, N.J. (1991), Herbivores and the dynamics of
communities and ecosystems, Annual
Review of Ecology and Systematics, 22:
477–503.
Körner, C. (1999), Alpine Plant Life: Functional
Plant Ecology of High Mountain Ecosys-
tems, Springer-Verlag, Berlin.
Milchunas, D.G. and Lauenroth, W.K. (1993). Quan-
titative effects of grazing on vegetation and
soils over a global range of environments.
Ecological Monograph, 63: 327–366.
Milchunas, D.G., Sala, O.E., and Lauenroth, W.K.
(1988), A generalized model of the effects
of grazing by large herbivores on grassland
community structure. American Naturalist,
132: 87–106.
Molinillo, M. and Monasterio, M. (1997), Pastoral-
ism in páramo environments: practices, for-
age, and impact on vegetation in the
Cordillera de Mérida, Venezuela. Mountain
Research and Development, 17(3): 197–211.
3523_book.fm Page 134 Tuesday, November 22, 2005 11:23 AM
Copyright © 2006 Taylor & Francis Group, LLC
Grazing Impact on Vegetation Structure and Richness in the Venezuelan Páramos 135
Molinillo, M. and Monasterio, M. (2002), Patrones
de vegetación y pastoreo en ambientes de
páramo, Ecotropicos, 15(1): 19–34.
Monasterio, M. (1980). Las formaciones vegetales
de los Páramos venezolanos, in Monasterio,
M. (Ed.), Estudios Ecológicos en los Pára-
mos Andinos, Ediciones de la Universidad
de los Andes, Mérida, pp. 93–159.
Montilla, M., Monasterio, M., and Sarmiento, L.
(2002), Dinámica sucesional de la fitomasa
y los nutrientes en parcelas en sucesión-
regeneración en un agroecosistema de
páramo, Ecotropicos, 15(1): 75–84.
Pacala, S.W. and Crawley, M.J. (1992), Herbivores
and plant diversity, American Naturalist,
140: 243–260.
Pérez, R. (2000), Interpretación ecológica de la
ganadería extensiva y sus interrelaciones con
la agricultura en el piso agrícola del Páramo
de Gavidia, Andes venezolanos, M.Sc. the-
sis, Postgrado de Ecología Tropical, Facul-
tad de Ciencias, Universidad de los Andes,
Mérida, Venezuela.
Podwojewski, P., Poulenard, J., Zambrano, T., Hof-
stede, R. (2002), Overgrazing effects on veg-
etation cover and properties of volcanic ash
soil in the páramo of Llanguahua and La
Esperanza (Tungurahua, Ecuador), Soil Use
and Management, 18: 45–55.
Ramsay, P. and Oxley, R.B. (2001), An assessment
of aboveground net primary productivity in
Andean grasslands of central Ecuador,
Mountain Research and Development, 21:
161–167.
Sarmiento, L., Smith, J., and Monasterio, M. (2002),
Balancing conservation of biodiversity and
economical profit in the agriculture of the
high Venezuelan Andes: are fallow systems
an alternative? In Körner, C. and Spehn, E.
(Eds.), Mountain Biodiversity — A Global
Assessment, Parthenon, pp. 285–295.
Sarmiento, L., Llambí, L.D., Escalona, A., and Mar-
quez, J. (2003), Vegetation patterns, regen-
eration rates and divergence in an old-field
succession of the high tropical Andes, Plant
Ecology, 166: 63–74.
Schmidt, A.M. and Verweij, P.A. (1992), Forage
intake and secondary production in exten-
sive livestock systems in páramo, in Balslev,
H. and Luteyn, J.L. (Eds.), páramo: An
Andean Ecosystem under Human Influence.
Academic Press, London, pp. 197–210.
Smith, J.K. (1995), Die Auswirkungen der Intensiv-
ierung des Ackerbaus im Páramo de Gavidia
— Landnutzungswandel an der oberen
Anbaugrenze in den venezolanischen
Anden, Diplomarbeit, University of Bonn,
Germany.
Van Oene, H., van Deursen, M., and Berendse, F.
(1999), Plant-herbivore interaction and its
consequences for succession in wetland eco-
systems: a modeling approach, Ecosystems,
2: 122–138.
Vargas, O., Premauer, J., and Cardenas, C. (2002),
Efecto del pastoreo sobre la estructura de la
vegetación en un páramo humedo de Colom-
bia, Ecotropicos, 15: 35–50.
Velázquez, A. (1992), Grazing and burning in grass-
land communities of high volcanoes in Mex-
ico, in Balslev, H. and Luteyn, J.L. (Eds.),
páramo: An Andean Ecosystem under
Human Influence, Academic Press, London,
pp. 231–241.
Verweij, P.A. and Budde, P.E. (1992), Burning and
grazing gradients in páramo vegetation: ini-
tial ordination analyses, in Balslev, H. and
Luteyn, J.L. (Eds.), páramo: An Andean
Ecosystem under Human Influence, Aca-
demic Press, London, pp. 177–195.
Verweij, P.A. and Kok, K. (1992), Effects of fire and
grazing on Espeletia hartwegiana popula-
tions, in Balslev, H. and Luteyn, J.L. (Eds.),
páramo: An Andean Ecosystem under
Human Influence, Academic Press, London,
pp. 215–229.
Wagner, E. (1978), Los Andes Venezolanos,
arqueología y ecología cultural, Ibero-
Amerikanisches Archiv, Neue Folge, Berlin,
4(1): 81–91.
3523_book.fm Page 135 Tuesday, November 22, 2005 11:23 AM
Copyright © 2006 Taylor & Francis Group, LLC