Land Use Change and Mountain Biodiversity - Chapter 24 pot
Bạn đang xem bản rút gọn của tài liệu. Xem và tải ngay bản đầy đủ của tài liệu tại đây (543.23 KB, 15 trang )
319
24
Multidimensional (Climatic,
Biodiversity, Socioeconomic),
Changes in Land Use in the
Vilcanota Watershed, Peru
Stephan Halloy, Anton Seimon, Karina Yager,
and Alfredo Tupayachi
INTRODUCTION
To investigate the dynamic changes affecting
biodiversity across the vertical gradient of the
Vilcanota watershed in Peru, we utilize the
major vertical profile of the Vilcan-
ota–Urubamba Valley (the Sacred Valley of the
Incas at its center). The area combines features
of interest for our research, such as a tropical
location in a major biodiversity hot spot, which
has also been a cultural vortex with thousands
of years of occupation and development of
resilient sustainable land uses; the point of ori-
gin of many indigenous agricultural staples,
some of which are now important agricultural
crops at a global level; and a unique annually
resolved
climatic record of more than 500 years
in the Quelccaya ice cap to the southeast of the
watershed (Thompson et al. 1985). As it
descends, the Vilcanota–Urubamba changes its
cross section (Figure 24.1), topography, and
mesoclimates, traversing an extreme range of
climates and environments. These have been
described and classified by many researchers
(e.g. Brisseau, 1981; Galiano Sánchez, et al.,
1995; Gentry, 1993; Sibille, 1997). The water-
shed starts in the permanent snow and glaciers
of the steep peaks above 6300 m (Ausangate),
where mean temperatures are below 0°C. We
recently recorded (in 2002) the highest vascular
plants at 5510 m, close behind the retreating
glaciers in this area. High-Andean vegetation
develops rapidly down from this level. Around
4900 m, llama and alpaca grazing signal the
rising level of human occupation. The highest
human occupation found is the house of Pedro
Godofredo above Murmurani, at ~5050 m.
The undulating altiplano between 4900 and
4200 m gives way to steep incised valleys as
the rivers cut their way down to the Amazon.
As in the altiplano, human occupation has
developed in these valleys over the centuries,
cultivating the valley floors and terracing the
steep valley slopes to expand production areas.
Apart from the valley topography and gradual
increase in temperature, an important environ-
mental factor is the drying of the climate
towards the valley floors as a climatic effect of
valley wind circulation (Troll, 1968). About 350
km down from its source, the valley finally
opens into the foothills of the Andes and the
Amazonian lowland forests and savannas,
where mean annual temperatures are around 23
to 29°C, and annual rainfall is around 1700 to
2000 mm. Due to the strong orographic gradi-
ents, all climate parameters vary in short dis-
tances. For example, rainfall slightly to the
southeast of the Urubamba at San Gabán and
Quince Mil (600 m) reaches 3000 to 6000 mm
per year.
Data on species richness will be reviewed,
and we will examine information on present
impacts affecting the natural and managed
biodiversity and the manner in which the latter
is distributed. Given the region’s rich biodiver-
sity and the reported past levels of prosperity
3523_book.fm Page 319 Tuesday, November 22, 2005 11:23 AM
Copyright © 2006 Taylor & Francis Group, LLC
320
Land Use Change and Mountain Biodiversity
at a time (>500 years BP) when resource use
has been claimed to be more sustainable in the
long term, the question that comes to the fore
is: Why do human populations now suffer
extreme poverty and environments undergo
rapid degradation?
We examine the temporal
dynamics of various components in this three-
dimensional space and explore possible drivers
in view of human pressures and climate change.
Several questions that arise are: Is loss of biodi-
versity through land use change a consequence
of poverty? Is poverty related to a failure to
incorporate traditional biodiversity stewardship
into modern agricultural systems? Do market
pressures tend to decrease the use of traditional
agricultural management (e.g. Swinton and
Quiroz, 2003; Halloy et al., 2004)?
METHODS
We surveyed, collated, and calculated the infor-
mation and literature on land use and biodiver-
sity for the Vilcanota–Urubamba watershed.
Political (and hence, census) boundaries are not
drawn along watershed boundaries, so we
selected 33 representative districts along the
main axis of the valley. To approach biodiver-
sity at this regional scale, we use proxies (which
are more or less relevant and debatable, and
provide insights into the system) such as per-
centages of land use and rates of change (e.g.
deforestation, cultivated crops, and grazing),
each of which has its own impacts on biodiver-
sity. Cultivated area of each species of crops
was collated from all districts, a necessary
caveat being that census data are sensitive to
human reporting and data-gathering techniques.
Many smaller crops and crop areas are not
reported, thus biasing the data toward larger
areas and crops. However, this is not unlike the
bias that occurs in any biodiversity study toward
larger, more abundant, and more visible species.
Table 24.1 shows the seven provinces of the
Cusco Department, along with some portions
in the Vilcanota Valley. Further details on the
33 districts are in Appendix I. Cusco Depart-
ment has a total area of 71,987 km
2
, slightly
larger than the island of Tierra del Fuego. The
area of the 33 districts studied here is 29,337
km
2
, or almost half of the department.
Diversity was evaluated as simple species
richness, following the Shannon–Weaver infor-
mation index of diversity (
H
=
p
i
ln
p
i
, where
p
i
= (abundance of species i)/total abundance;
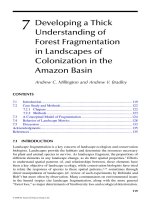
FIGURE 24.1
Topographic profile of the Vilcanota Valley, lengthwise from SSE to NNW with five cross
sections approximately W–E to show the changing valley configuration. The Vilcanota is represented by the
altitudes of 33 district capitals (dots), some of which are located away from the valley center, hence the higher
points. Four additional points complete the profile: village of Santa Barbara (4000 m), outlet of Sibinacocha
Lake (4850 m), Rititica summit (5250 m), and the summit of Vizcachani (near the source of the Vilcanota
above 6200 m). The five cross sections (full lines) are taken at the level of the capitals (from left to right)
Sicuani, Pisac-Cusco, Ollantaytambo, Machu Picchu, and Quellouno.
7000
6000
5000
4000
Altitude (m)
3000
2000
1000
0
0 50 100 150
km from source
200 250 300 350 400
3523_book.fm Page 320 Tuesday, November 22, 2005 11:23 AM
Copyright © 2006 Taylor & Francis Group, LLC
Climatic, Biodiversity, Socio-Economic Changes in Land Use in the Vilcanota Watershed
321
[Shannon and Weaver, 1949]), and as frequency
distributions (Williams, 1964).
We integrate this study with ongoing
research at the regional altitudinal limits of life
in the Lake Sibinacocha area. As part of a global
network to monitor the effects of global change
on biodiversity, we established in 2002 a Global
Research Initiative in Alpine Environments
(GLORIA) site at 5250 m. This follows a stan-
dardized methodology of inventories and tem-
perature measurements for long-term compari-
sons (Pauli et al., 2002) and is logged as a
Global Terrestrial Observation Site (Halloy and
Tupayachi, 2004).
VERTICAL DISTRIBUTION OF
DIVERSITY
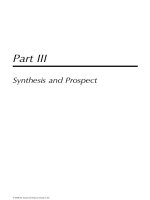
Braun et al. (2002) calculated the number of
species of seed plants in an altitudinal profile
of Peru from Brako and Zarucchi (1993) (Fig-
ure 24.2). They found that the number of spe-
cies in the Andes above 500 m is more than the
total number of Amazonian species in Peru. At
the highest levels, over 250 species of seed
plants are recorded above 4500 m for the whole
of Peru. At the eastern headwaters of the Vil-
canota, at the Rititica GLORIA site, we found
24 vascular plants and 28 nonvascular plants
(bryophytes and lichens) in a 274-m
2
sampling
area at 5250 m in midwinter 2002. Higher up,
flowering plants were found to 5510 m, right
up to the receding ice cliff edge above Rititica.
Gentry (1993) noted that although 43% of
Peruvian seed plant species are from lowland
Amazonia, 34% grow in lower-Andean forests
between 500 and 1500 m, and a remarkable
57% are recorded from Andean cloud forests.
The high-Andean region above 3500 m con-
tains approximately 14% of the Peruvian flora.
L
AND
U
SE
I
MPACT
Land-based agriculture contributes 25.4% of
the gross domestic product (GDP) and provides
47.5% of employment in the Cusco Department
(MAP, 2003). The proportion of total land area
that is dedicated to cultivation averages 8% for
the whole valley, ranging from less than 1% for
Pitumarca and Checacupe districts (limiting
ecological conditions near the altitudinal limits
of cultivation) to 33% for Quellouno (recent
major increase in export crops, principally cof-
fee). Grazing affects almost all lands accessible
to stock within the valley. Based on a generous
assumption (with present management prac-
tices) of one stock unit
1
per hectare, and calcu-
lating from all stock censused in the six valley
provinces (Sibille, 1997), we obtain that most
TABLE 24.1
Provinces of the Cusco Department with districts used in this study, together with their
population and area
Province Capital
Population,
Projection 2002 Area (km
2
)
Density (inhabitants
km
-2
)
Total departments Cusco 1,208,689 71,987 16.8
Acomayo Acomayo 34,652 948.22 36.5
Calca Calca 65,330 4,414 14.8
Canchis Sicuani 107,012 3,999 26.8
Cusco Cusco 319,422 617 517.7
La Convención Quillabamba 194,395 30,062 6.5
Quispicanchi Urcos 89,264 7,565 11.8
Urubamba Urubamba 56,352 1,439 39.1
Source:
From the 1993-1994 Census, Instituto Nacional de Estadística e Informática, Peru (INEI 2003).
1
Stock unit is equivalent to a 45 kg ewe suckling a lamb
or a 55 kg pregnant ewe. This amounts to around 0.02 stock
units per 1 kg of live weight; 1 stock unit requires 520 kg
of dry matter of feed per year.
3523_book.fm Page 321 Tuesday, November 22, 2005 11:23 AM
Copyright © 2006 Taylor & Francis Group, LLC
322
Land Use Change and Mountain Biodiversity
provinces carry stock requiring 60% (Calca,
Quispicanchi) to 150% (Canchis) and 190%
(Cusco) of their total land area. Only La Con-
vención requires a minor 3.5% of its land area
to feed existing stock. Because only a certain
fraction of their total land area is suitable for
natural pastures (e.g. 64% for Canchis, 40% for
Cusco, and less than 24% for the remaining
provinces, INEI in MAP [2003]), the overstock-
ing becomes even more notorious. These are
indications of unsustainable levels of overgraz-
ing that exceed the carrying capacity of the
land. Fallow and harvested lands also fulfill a
role in providing feed for grazing stock, but this
is not quantified in censuses.
Although some level of grazing can
enhance biodiversity by reducing competition
(Fowler 2002), intense overgrazing as sug-
gested by these data leads to depletion of pal-
atable species, reduction of ground cover, and
erosion (Duncan et al., 2001). Depending on
management, livestock, as do cultivated plants,
will carry with them a variety of commen-
sal/accompanying species including their para-
sites, as well as transport seed plants that are
abundant near their main grazing areas. A 2001
survey around Lake Sibinacocha found that
rodent diversity increased around llama and
alpaca corrals at an altitude of 4900 m as an
effect of anthropogenic enhancement.
The steep terrain of most of the central val-
ley implies high erosion risk: 85% of areas cul-
tivated in the higher areas (310,000 ha) are on
steep to moderately steep slopes. They are sus-
ceptible to erosion but most are not subject to
any soil protection practices at this time (MAP,
2003), unlike ancient mitigation practices of
terracing, irrigation, managing soil organic
matter, etc.
Deforestation for agricultural land and fire-
wood is claiming large areas of the central val-
ley. For the center of the Valle Sagrado, Galiano
FIGURE 24.2
Number of seed plants at each altitudinal level in Peru, combined from Braun et al. 2002. The
GLORIA site and high altitude records.
6000
5000
4000
3000
2000
Altitude (m) (max level)
1000
0
1 10 100
number of species seed plants
1000 10,000
3523_book.fm Page 322 Tuesday, November 22, 2005 11:23 AM
Copyright © 2006 Taylor & Francis Group, LLC
Climatic, Biodiversity, Socio-Economic Changes in Land Use in the Vilcanota Watershed
323
Sánchez et al. (1995) quote deforestation levels
of 90% of original forests for valley bottom
forests (2700 to 3300 m), 60% for mixed forests
of the slopes (3300 to 3700 m), and 20% of the
Polylepis
forests from 3700 to 4800 m. The
Ministerio de Agricultura (MAP, 2003) esti-
mated that 50% of the best forests of the depart-
ment were cut down by 1995, including 15%
of the humid lowland forest, more of which is
being cut at a rate of 20,000 ha per year. Land
use conversion has opened up 630,000 ha in the
22 years from 1972 to 1994, representing an
increase of 29.5%.
Introduced species constitute an insuffi-
ciently evaluated risk in the area. Weeds of tem-
perate regions are widespread in the middle
reaches of the valley, although many weeds in
turn have their uses (see subsection titled Spe-
cies Richness). Irreversible changes are being
mediated by exotic species: large areas are
reforested with eucalyptus, bringing consider-
able changes to the landscape and ecosystem,
including scenic aspects, soils, erosion, avail-
ability of firewood, and capability of native spe-
cies (including animals and medicinal plants)
to survive under their canopy. An other invasive
species that has probably had a major impact
in this area include trout, widely introduced for
subsistence and recreational fishing.
Mining at high altitudes, as well as the
impact of large oil deposits found in lowlands
(Camisea, Sibille, 1997), provide an incentive
and a subsidy to develop roads and infrastruc-
ture that then allow penetration into vast new
areas, in addition to their direct impacts on
devegetation and toxic wastes.
Factors slowing the expansion of land use
impacts include difficult access and legislation.
Although steepness and lack of roads has pro-
vided some protection to more remote parts of
the valley, the only formally protected area in
the Vilcanota Valley is the Santuario Histórico
de Machu Picchu in the Province of Urubamba.
With 32,592 ha, it represents almost 23% of the
area of that province but only 1% of the area
of the 33 districts considered in this study. For
comparison, in its land use capability classifi-
cation, INRENA (2000; in MAP 2003) consid-
ers that 66% of departmental lands should be
classified as protection land, with only 33%
suitable for agriculture (3% arable, 0.4% per-
manent crops, 14% suitable for forestry planta-
tions, and 16% suitable for rangeland manage-
ment). Yet in the 1994 census of the 33 districts
of the Vilcanota, arable and permanent crops
alone already cover 8% of the land area, imply-
ing that expansion is unsustainable.
RESOURCE DISTRIBUTION IN
HUMAN POPULATIONS
The distribution of economic resources can
determine the magnitude and type of land use
and its effect on biodiversity. Resource distri-
bution is explored from the point of view of
land size distribution, distribution of the abun-
dance of crops, and distribution of wealth
(social indicators of poverty).
C
ULTIVATED
L
AND
D
ISTRIBUTION
AND
D
IVERSITY
The distribution of access to productive land
depends on the distribution of cultivated parcel
sizes. This overlooks the issue of spatial distri-
bution but is, nevertheless, a large-scale proxy
for overall distribution. Plots around a peasant
community tend to be of relatively small (typ-
ically, much less than 0.5 ha) and even sizes
(e.g. for similar cultural landscapes in Peru and
Bolivia, see Liberman Cruz, 1987; Pietilä and
Jokela, 1988). These areas close to villages pro-
duce the mainstay of daily sustenance and hold
the highest crop and native plant diversity (Zim-
merer, 1997; Ramirez, 2002). In the 17 higher
districts (>3000 m, more highly populated) of
the Cusco Department, Peru, 93% of properties
are less than 5 ha, the mean parcel size is 0.37
ha, and the average cultivated area per person
in the overall population is 0.14 ha (INEI,
2003). The distribution of plot sizes controlled
by a single family tends to a classic lognormal
pattern with occasional large outliers, indicat-
ing an imbalance (Halloy et al., 2004). Larger
cultivated areas are developed further from
houses and are hence tied to the availability of
transportation and farm machinery. In the two
lower, more market-oriented districts (~650 m),
only 22% of properties are less than 5 ha, the
mean property size is 1.3 ha, and the cultivated
area per person is 0.74 ha.
3523_book.fm Page 323 Tuesday, November 22, 2005 11:23 AM
Copyright © 2006 Taylor & Francis Group, LLC
324
Land Use Change and Mountain Biodiversity
Larger plot sizes are driven mainly by large-
scale cultivation of commercial crops (e.g. cof-
fee and cocoa in lowlands; maize, wheat,
ulluco
,
and potatoes in highlands). Much larger culti-
vated sizes in tropical lowlands are an effect of
dynamic colonial expansion into the lowlands
and are contrary to ecological expectations (i.e.
higher potential yields mean that smaller plots
are sufficient for equivalent yields). Older, more
established societies tend to produce lognormal
distributions of the cultivated areas of crops (e.g.
Halloy, 1994; Halloy, 1999), whereas younger
colonizing societies have distributions that
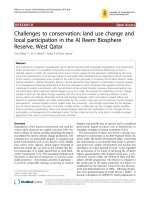
depart strongly from the lognormal. In the Vil-
canota, we can see this, in particular, in the
lowering of diversity index (
H
) values in La
Convención (below 1.8), despite high species
numbers (60 to 75) (Figure 24.3). Many central
and highland areas, despite species numbers
well below 50, maintain a relatively high diver-
sity (
H
between 1.6 and 2.4), thanks to a more
even species distribution. However, some high-
land areas have very low diversity where crop
cultivation becomes ecologically marginal.
W
EALTH
D
ISTRIBUTION
AND
N
UTRITION
Despite a wealth of biodiversity and productive
land, the 1993 census recorded that 60% of
children were chronically malnourished and
infant mortality was 91.8 per thousand for the
Cusco Department (Table 24.2).
Fecundity (number of children per woman)
typically declines with development. The more
highly developed Cusco Province shows a rat-
ing of 2.8, but poorer and less educated prov-
inces show much higher values (e.g. Quispican-
chi 5.8, Urubamba 5.0; Sibille [1997]. In a
paradox that is repeated around the world, the
areas richest in cultivated plants are the poorest
and most malnourished. However, we note that
FIGURE 24.3
Shannon–Weaver index of diversity for cultivated plants across 33 districts of the Vilcanota
Valley.
2.6
2.4
2.2
2
1.8
1.6
1.4
1.2
1
0.8
0 100 200
km from source
300 400
H diversity cultivated plants
3523_book.fm Page 324 Tuesday, November 22, 2005 11:23 AM
Copyright © 2006 Taylor & Francis Group, LLC
Climatic, Biodiversity, Socio-Economic Changes in Land Use in the Vilcanota Watershed
325
this is not a linear relation, as improved quality
of life was found at even higher diversity in
traditionally cultivated areas (Halloy et al.
2004).
S
PECIES
R
ICHNESS
AND
D
ISTRIBUTION
OF
C
ULTIVATED
S
PECIES
A total of 157 categories of cultivated plants
were recorded in the 1993 agricultural census.
Several census categories represent mixed bags
of species in which there may be only one or
several species (
Vergel Hortícola Plátano
[veg-
etable plots planted with bananas],
Vergel Frutí-
cola
[fruit orchards],
Flores
[flowers], etc.;
Table 24.3). Hence, estimates of species rich-
ness based on the census are underestimates.
This species richness is not fixed in time; the
actual varieties and species that are grown are
continuously changing with a rapid turnover
rate (e.g. Halloy, 1999; Ramirez, 2002).
Census data of cultivated crops represents
only a fraction of total cultivated plants. For
example, for the total area above 3500 m, the
INEI 1993 census data records 52 species of
cultivated plants in a total of 6679 ha. However,
in a small area of 686 ha above 3500 m in Calca
Province, Ramirez (2002) recorded 76 species.
In addition, a large number of adventive or
“weedy” species accompany cultivation, and
additional native species “tolerate” and persist
in cultivated areas along road edges, hedges,
gullies, etc. Many such species are also used by
local populations (Rapoport et al. 1998). For
example, Vieyra-Odilon and Vibrans (2001)
report 74 weed species found in maize fields in
Mexico that were useful as forage, potherb,
medicinal, or ornamental plants. In the high
Andes of neighboring Bolivia, Hensen (1992)
reports the use of 204 species of plants in the
community of Chorojo, Cochabamba, from
3500 to 3800 m, most with forage and medic-
inal uses. Of these, 24 species were used as
food. In every relevé in fallow terrain near La
Paz, de Morales (1988) reports that 6 to 12
weedy species are found. Detailed recordings
of plant use in the Andes are available in a range
of publications (e.g. Brücher, 1989; NRS, 1989;
Zimmerer, 1997).
Sibille (1997) (following INEI, 1986)
quotes 193 plant products (including 142 arable
crops, 37 permanent crops, and 14 grasses) for
the whole of Cusco Department, whereas
Galiano Sánchez et al. (1995) quote 96 useful
species (including this time forestry species)
and 685 vascular plant species in a 50 km
2
area
of the Sacred Valley, ranging from 2715 to 5300
m. They also recorded 40 nonvascular crypto-
gams.
The present total of 157 cultivated species
in the Vilcanota Valley and 193 for the whole
Cusco Department can be compared to 160 spe-
cies claimed to have been commonly used for
food, medicine, and other purposes in precolo-
nial times for Peru (Tapia and Torre, 2003).
It is of some concern for conservation that
most of the rarest cultivated plants are natives,
whereas many of the common species are
exotic.
TABLE 24.2
Social indicators vs. cultivated plant diversity in some Cusco Provinces, 1993 census
Area Cusco Department Canchis Province Calca Province Cusco Province
Chronically
malnourished children
(%)
60.0 59.2 65.5 42.0
Infant mortality rate per
1000
91.8 114.2 86.7 47.7
Number of species of
cultivated plants per
1000 inhabitants
3.8 3.6 3.8 0.6
Source:
INEI, 2003.
3523_book.fm Page 325 Tuesday, November 22, 2005 11:23 AM
Copyright © 2006 Taylor & Francis Group, LLC
326
Land Use Change and Mountain Biodiversity
TEMPORAL DYNAMICS
H
ISTORICAL
P
ERSPECTIVE
It is interesting to compare the present situation
with that recorded by the Spaniards in the early
1500s. The area that was then the center of the
Inca dominions was praised by chroniclers as
a place where “no one ever went hungry” and
where “purposely made storage areas were
overflowing with vegetables and roots to feed
the people and also herbs” (Peró Sancho quoted
in Murra, 1975).
Indeed, traditional land use management
practices were able to support the livelihoods
of households and communities for several mil-
lennia and were sufficient for the rise of com-
plex civilizations centuries prior to Spanish
occupation. The ample increase in production
under the Inca empire may have, in part,
depended on its careful environmental hus-
bandry (including tactics of soil conservation,
water management and irrigation, management
of domesticated plant and animal diversity, and
protection of natural vegetation and fauna)
(Halloy et al., 2004).
It is possible that habitat degradation
induced by ancient hunter–gatherers and pasto-
ral nomads may have contributed — together
with population increase, extended annual
occupation, rise of social stratification, and the
need to increase production for both social and
livelihood needs — to the development of civ-
ilizations incorporating the conservation mea-
sures in force at the time of arrival of the Span-
ish (Kessler, 1998).
Despite such measures, it seems likely that
considerable destruction of the high-altitude
Polylepis
forests took place long before the
arrival of the conquistadores in 1532 (Gade,
1999; Kessler et al., 1998). Before the arrival
of the Spanish, the Andean landscape had
already experienced significant levels of trans-
formation and degradation. Gade estimates that
some 65% of the natural forest had been
depleted before the Spanish arrival, shortly after
which 90% became depleted (Gade 1999). The
TABLE 24.3
Most commonly cultivated plants over 33 districts according to 1993 agricultural Census
Species/Variety
Area (ha) Number of DistrictsCensus Name English Name Scientific Name
Café or cafeto Coffee
Coffea arabica
25,511 7
Maiz amiláceo Starch maize
Zea mays
11,375 33
Papa Potato
Solanum tuberosum
8,132 33
Cacao Cocoa
Theobroma cacao
6,581 7
Achiote
Annatto Bixa orellana
4,462 6
Coca Coca
Erythroxylum coca
3,705 8
Haba Broad bean
Vicia faba
3,282 30
Yuca Cassava
Manihot esculenta
3,003 8
Cebada grano Barley grain
Hordeum vulgare
2,428 27
Trigo Wheat
Triticum aestivum
2,029 29
Vergel
hortícola–plátano
Vegetable
garden–banana
Multispecies 1,006 32
Maiz amarillo Yellow maize
Zea mays
1,916 30
Vergel frutícola Fruit orchard Multispecies 1,435 29
Arveja (alverjón) Green pea
Pisum sativum
529 29
Olluco Ulluco
Ullucus tuberosus
1,466 29
Oca Oca, NZ
yam
Oxalis tuberosa
100 28
Note
: The two right columns show total area cultivated (first ten are the species with largest cultivated areas) and number
of districts where the crop is recorded (the following six are species with a high number of districts but lower area).
Source
: INEI, 2003.
3523_book.fm Page 326 Tuesday, November 22, 2005 11:23 AM
Copyright © 2006 Taylor & Francis Group, LLC
Climatic, Biodiversity, Socio-Economic Changes in Land Use in the Vilcanota Watershed
327
Spanish conquest resulted in increasing defor-
estation rates as they consumed large amounts
of wood for construction and the smelting of
ores in mining activities.
Upon arrival, the Spanish implemented
agroforestry measures in an attempt to compen-
sate for excessive consumption levels. Unfortu-
nately, such measures did not suffice, and the
landscape became mostly depleted of trees.
After the decimation of the indigenous popula-
tion in the 16th century, a majority of the rural
landscape was abandoned. Denevan argues that
much of the natural landscape was able to
recover as a result of the population decline and
may have contributed to the early 19th-century
misconceptions of the “pristine” landscape
(Denevan, 1992). However, the introduction of
nonnative species also became commonplace.
The Spanish experimented early with the non-
native poplar and capuli trees (Gade 1975), but
the most influential species to be introduced in
the late 19th century with unprecedented frui-
tion was
Eucalyptus globulus
.
C
LIMATE
C
HANGE
Given the context of intense human and envi-
ronmental heterogeneity and fluctuations over
time, encountering a signal of climate change
effects is not a simple matter (e.g. see meta
analyses as in Parmesan and Yohe (2003), but
such an approach is still to be realized in Peru).
However, there are some observations pointing
towards vegetation and land use advancing
towards higher altitudes in recent decades.
Toward the middle of the last century, Troll
(1968) observed that in the Central Andes of
Peru and Bolivia, maize could be grown up to
3500 m, whereas tuberiferous plants (potato,
oca
,
isaño
, and
ulluco
) and introduced wheat
and barley reached their upper limit at 4100 m.
Mitchell (1976), followed by Price (1981), also
placed the altitudinal limit of cropping at 4100
m. Higher up, the grasslands were grazed by
llamas, alpacas, and wild vicuñas. Uninter-
rupted plant cover ended at around 4700 m,
where nightly frosts began. The climatic snow-
line was indicated at 5300 m.
Interpretation of such reports is problem-
atic, given their nonspecificity in terms of loca-
tion or dates, as well as issues of time lag
between observations and publication. How-
ever, these and other authors had extensive
experience in geography, and it is unlikely that
their observations would be far off the mark.
More recently, Tapia and Torre (2003) quote
several crops grown up to 4000 m, two species
grown up to 4100 m (maca and kañiwa), and
one
(Papa amarga:
Solanum juzepczukii
) grown
up to 4200 m. Potato cultivation today in the
Vilcanota headwaters occasionally reaches
4580 m (Chillca; our observations in 2004).
Recent attempts to cultivate oats and potato
have even been made at 5050 m above Murmu-
rarni, although these were unsuccessful.
Interestingly, archaeological remains show
that these and higher areas were cultivated in the
more remote past. Archaeological remains of cul-
tivation higher than today have also been noted
in the Cordillera Blanca (Cardich, 1985). In 1985,
Cardich also observed that since he began making
observations, “the limit of cultivation has been
moving upward and crops are now grown at
higher elevations than during previous decades.
Simultaneously, there has been an accelerated
recession of glaciers in the high cordilleras, as
well as disappearance of snow and consequent
opening of passes connecting the Pacific and
Atlantic slopes.” In summary, 2002 cultivation
levels are higher than in the past decades and
recent centuries, but still not as high as maximum
levels reached at some time in the past, presum-
ably before the Little Ice Age. The first post–Lit-
tle Ice Age settlers in the Sibinacocha area moved
into the valley in 1906 (Pedro Godofredo, per-
sonal communication, 2003). Today, there are a
number of corrals and settlements.
P
OPULATION
AND
L
AND
U
SE
An indication of the growing population impact
is its increasing concentration in urban centers,
from 25% of the department’s population in
1940 to 46.5% in the 1993 census (Figure 24.4).
For the whole department, infant mortality has
declined from 149 per 1000 births in 1979 to
1980 to 101 in 1990 to 1991 (Sibille, 1997).
Because of political–economic change, there is
also a strong net outmigration, principally
towards centers offering employment and nat-
ural resources (Lima, Arequipa, and Madre de
Dios). Emigration rates are rapidly increasing.
3523_book.fm Page 327 Tuesday, November 22, 2005 11:23 AM
Copyright © 2006 Taylor & Francis Group, LLC
328
Land Use Change and Mountain Biodiversity
From 8% of the total departmental population
in 1961, emigration climbed to 16% in 1972,
18% in 1981, and 21% in 1993 (Sibille, 1997).
Emigration from rural areas contributes to
important land use changes with mixed impacts
on biodiversity: lack of maintenance of terraces
and irrigation leading to erosion, lack of control
of animals leading to grazing and overgrazing,
lack of cultivation leading to weedy succes-
sional phases, then back to vegetation that is
more diverse, etc.
Sibille (1997) also indicates that agricultural
land is decreasing significantly in several areas
due to urban encroachment. Thus, Cusco prov-
ince lost 62% of its arable land in the 10 years
from 1985 to 1995, whereas Urubamba lost
25%. At the same time, he reports a loss of some
of the more traditional crops to livestock grazing
and intensification of farming (e.g. irrigated land
has increased 89% in 22 years from 1972).
Many irrigation schemes disregard impacts on
the overall social and natural web of interactions
(Liberman Cruz, 1987), leading to further loss
of arable land and native biodiversity.
The advance of the agricultural frontier is
particularly evident in the lowland areas, where
it is marked by large-scale deforestation. How-
ever, although less evident, use pressure is
growing in the highlands as well, as manifested
by the increasing altitude at which crops and
livestock are grown and the increasing intensity
and density of cultivation.
T
HREATENED
S
PECIES
Although there are no data specific to the Cusco
Department, Pulido (2001) reports threatened
animal species for Peru have increased from
162 to 222 from 1990 to 1999. Such increases
have been recorded around the world in what
is often more a matter of increased monitoring
and perception than of real change of status in
such short times. Amphibian decline noted
around the world is also being observed in the
Vilcanota region, with local people reporting
the apparent reduction or total disappearance of
three to four species of frogs in areas close to
4000 m. Although a causal relation has yet to
be found, it is of concern that recent sampling
above 4400 m found evidence of deadly chytrid
fungus infections (believed to be implicated in
global decline) in remote populations of the
aquatic
Telmatobius marmoratus
(DeVries et
al., 2004).
FIGURE 24.4
Combined social and environmental changes in Cusco Department, Peru (data from INEI in
MAP, 2003 and Sibille, 1997).
2.00
1.50
1.00
Standardized to 1 for first value
0.50
0.00
1940
Urban population
Arable land, Cusco prov.
Total population
Irrigated land
Infant mortality
Utilized land
Remaining forests
1950 1960
Year
1970 1980 1990
3523_book.fm Page 328 Tuesday, November 22, 2005 11:23 AM
Copyright © 2006 Taylor & Francis Group, LLC
Climatic, Biodiversity, Socio-Economic Changes in Land Use in the Vilcanota Watershed
329
DISCUSSION AND
CONCLUSION:
MACROECONOMIC DRIVERS
There is considerable understanding of the
small-scale effects on biodiversity of land use
changes (e.g. other chapters in this book).
Although we recognize the rich tapestry of
ecology, farm- and people-scale dynamic pro-
cesses that underpin the large scale, there is also
a need to understand the large spatial scale and
drivers. The increasing complexity on larger
scales creates particular research difficulties,
including reliance on secondary information,
the importance of historical information, con-
sistency of information across scales and across
disciplines, and the translation of methods and
language between disciplines.
The remarkable diversity of environments
in the Vilcanota Valley arising from the combi-
nation of topographic conditions, altitude, and
rainfall, together with the mosaic of natural dis-
turbances and dynamic human management
strategies, has led to a high-energy system with
high biodiversity and high flows of materials
among its landscape components.
The main threats to biodiversity in the Vil-
canota presently involve land use changes. Mit-
igating the effects of those changes on biodi-
versity requires identifying and understanding
the drivers of change. This chapter is a contri-
bution to identify the next level of causal inter-
actions between biodiversity, land use changes,
and socioeconomic drivers (the macroeconomic
system). There is added value in that patterns
observed in the Vilcanota are comparable and,
hence, can be extrapolated (with careful con-
sideration of differences) to a large range of
similar valleys along the Central Andes, and
likely provide insights for similar valleys
worldwide.
SUMMARY
We explore the multidimensional environ-
ment–biodiversity–human–time complex of an
important cultural and ecological hub in the
Central Andes of Peru: the Vilcan-
ota–Urubamba river catchment (Sacred Valley
of the Incas and Cordillera de Vilcanota). The
watershed begins at the upper borderline of the
biosphere where glaciers are retreating, vegeta-
tion and local fauna are rising, and humans are
cultivating crops and herding camelids at
increasingly higher altitudes. Maximum alti-
tude of potato cropping is now reaching 4580
m, whereas the highest vascular plants were
found at 5510 m. The number of cultivated spe-
cies and varieties censused is up to 34 above
3600 m. The midaltitude Valle Sagrado has
been occupied for millennia, but is presently
undergoing dramatic changes (deforestation at
60 to 90%, fire, exotic invasions, large eucalyp-
tus plantations, etc) resulting from socioeco-
nomic pressures (poverty, malnutrition in 60%
of children, outmigration at >21%, market pres-
sures leading to monocultures, and intensive
cropping), causing a restructuring of spatially
and temporally integrated land use patterns. The
number of cultivated plants can be up to 49 in
one district around 3500 m, whereas total num-
ber of vascular plants above 3500 m in Peru is
>1800. The lower part of the valley reaches the
Amazonian lowlands, providing a pathway for
intensive exchanges with the higher regions. Up
to 75 species of cultivated plants are censused
in one lower district, with 6500 species of vas-
cular plants recorded below 500 m. Andean val-
leys such as the Vilcanota, reaching from glacial
peaks to tropical rainforests, provide unique
opportunities for understanding the complex
interactions between landscape, biodiversity,
human cultures, and land use change at a large
scale. The complex mix of macroeconomics,
culture, and ecology are key causes of land use
change and its effect on biodiversity.
References
Brako, L. and Zarucchi, J.L. (1993).
Catalogue of
the Flowering Plants and Gymnosperms of
Peru
. Missouri Botanical Garden, St. Louis
MO, USA.
Braun, G., Mutke, J., Reder, A., and Barthlott, W.
(2002). Biotope patterns, phytodiversity and
forestline in the Andes, based on GIS and
remote sensing data. In Körner, C. and
Spehn, E.M. (Eds.),
Mountain Biodiversity:
A Global Assessment
. Parthenon Publishing,
London, pp. 75–89.
3523_book.fm Page 329 Tuesday, November 22, 2005 11:23 AM
Copyright © 2006 Taylor & Francis Group, LLC
330
Land Use Change and Mountain Biodiversity
Brisseau, J. (1981).
Le Cuzco dans sa Région: Étude
de l'aire d'influence d'une ville andine
.
IFEA/CEGET, Bordeaux.
Brücher, H. (1989).
Useful Plants of Neotropical
Origin and their Wild Relatives
. Springer-
Verlag, Berlin.
Cardich, A. (1985). The fluctuating upper limits of
cultivation in the Central Andes and their
impact on Peruvian prehistory. In Wendorf,
F. and Close, A.E. (Eds.),
Advances in World
Archaeology
, Vol. 4. Academic Press,
Orlando, pp. 293–333.
de Morales, C.B. (1988). Manual de Ecología. Insti-
tuto de Ecología, Universidad Mayor de San
Andrés (UMSA), La Paz, Bolivia.
Denevan, W. (1992). The Pristine Myth: The Land-
scape of the Americas in 1492. Annals of the
Association of American Geographers, 82:
369–385.
DeVries, T.A., Hoernig, G., Sowell, P., Halloy,
S.R.P., and Seimon, A. (2005). Identification
of Chytridiomycosis in Telmatobius marm-
oratus at 4450m in the Cordillera Vilcanota
of Southern Peru. In Lavella, E.O. de la Riva,
I. (Eds.). Studies on the Andean Frogs of the
Genera Telmatobius and Batrachophrynus.
Monografías de Herpetología 7, Valencia.
Duncan, R.P., Webster, R.J., and Jensen, C.A. (2001).
Declining plant species richness in the tus-
sock grasslands of Canterbury and Otago,
South Island, New Zealand. New Zealand
Journal of Ecology, 25: 35–47.
Fowler, N.L. (2002). The joint effects of grazing,
competition, and topographic position on six
savanna grasses. Ecology, 83: 2477–2488.
Gade, D. (1999). Nature and Culture in the Andes.
University of Wisconsin Press, Wisconsin.
Gade, D.W. (1975). Plants, Man and the Land in the
Vilcanota Valley of Peru. Dr. W. Junk, The
Hague.
Galiano Sánchez, W., de Olarte Estrada, J., Tupaya-
chi, A., and Ardiles Jara, A. (1995). Conser-
vación de Recursos Fitogenéticos y Análisis
de una Microcuenca Hidrográfica en el Valle
Sagrado: Calca-Urubamba. Consejo de
Investigación de la Universidad Nacional de
San Antonio Abad del Cusco. Informe No 5:
1–51.
Gentry, A.H. (1993). Overview of the Peruvian flora.
In Brako, L. and Zarucchi, J.L. (Eds.), Cat-
alogue of the Flowering Plants and Gymno-
sperms of Peru. Missouri Botanical Garden,
St. Louis MO, USA, pp. 29–40.
Halloy, S.R.P. (1994). Long term trends in the rela-
tive abundance of New Zealand agricultural
plants. In Fletcher, D.J. and Manly, B.F.J.
(Eds.), Statistics in Ecology and Environ-
mental Monitoring, Vol. Otago Conference
Series 2. Otago University, Dunedin, New
Zealand, pp. 125–142.
Halloy, S.R.P. (1999). The dynamic contribution of
new crops to the Agricultural economy: is it
predictable? In Janick, J. (Ed.), Perspectives
on New Crops and New Uses. ASHS Press,
Alexandria, Virginia, USA, pp. 53–59.
Halloy, S.R.P. and Tupayachi, A. (2004). Rititica,
Cordillera Vilcanota (code: PE-SIB-RIT). In
/>?TAB=4&TSITE_ID=3249.
Halloy, S.R.P., Ortega Dueñas, R., Yager, K., and
Seimon, A. (2005). Traditional Andean Cul-
tivation Systems and Implications for Sus-
tainable Land Use. Acta Horticulturae, in
670: 31–55.
Hensen, I. (1992). La flora de la comunidad de
Chorojo — Su uso, taxonomía científica y
vernacular. Agruco, Serie Técnica, 28: 1–37.
INEI (2003). Censos. Instituto Nacional de Estadís-
tica e Informática (Perú). In
http://www
.inei.gob.pe/.
Kessler, M. (1998). Forgotten forests of the high
Andes. Plant Talk, 15: 25–28.
Kessler, M., Bach, K., Helme, N., Beck, S.G., and
Gonzales, J. (1998). Floristic diversity of
Andean dry forests in Bolivia — an over-
view. In Breckle, S.W., Schweizer, B., and
Arndt, U. (Eds.), Results of Worldwide Eco-
logical Studies. Proceedings of the 1st Sym-
posium of the A.F. Schimper-Foundation
est. by H. and E. Walter. Günter Heimbach,
Stuttgart, Hohenheim, Germany, pp. 219–234.
Liberman Cruz, M. (1987). Uso de la tierra en el
altiplano norte de Bolivia como base para la
evaluación del impacto ambiental de un
proyecto de desarrollo rural. Rivista di Agri-
coltura Subtropicale e Tropicale, Firenze,
Anno LXXXI: 207–235.
MAP (2003). Portal Agrario, Ministerio de Agricul-
tura del Perú (MAP). In tala-
grario.gob.pe/polt_cusco22.shtml.
Mitchell, W.P. (1976). Irrigation and community in
the central Peruvian highlands. Am. Anthrop,
78: 25–44.
Murra, J.V. (1975). Formación Económica y Política
del Mundo Andino. Instituto de Estudios
Peruanos, Lima.
3523_book.fm Page 330 Tuesday, November 22, 2005 11:23 AM
Copyright © 2006 Taylor & Francis Group, LLC
Climatic, Biodiversity, Socio-Economic Changes in Land Use in the Vilcanota Watershed 331
NRS (Ed.) (1989). Lost Crops of the Incas. Little-
known plants of the Andes with promise for
worldwide cultivation. National Research
Council, National Academy Press, Washing-
ton, D.C., USA.
Parmesan, C. and Yohe, G. (2003). A globally coher-
ent fingerprint of climate change impacts
across natural systems. Nature, 421: 37–42.
Pauli, H., Gottfried, M., Hohenwallner, D., Reiter,
K., and Grabherr, G. (Eds.) (2002). The
GLORIA Field Manual — Multi-Summit
Approach, 4th version (draft), December
2002 edn. Global Observation Research Ini-
tiative in Alpine Environments — A contri-
bution to the Global Terrestrial Observing
System (GTOS), Vienna.
Pietilä, L. and Jokela, P. (1988). Cultivation of minor
tuber crops in Peru and Bolivia. Journal of
Agricultural Science in Finland, 60: 87–92.
Price, L.W. (1981). Mountains and Man — A Study
of Process and Environment. University of
California Press, Berkeley, California.
Pulido, V. (2001). El Libro Rojo de la fauna silvestre
del Perú. Normal Legal: DS 013-99-Agri-
cultura, Lima.
Ramirez, M. (2002). On farm conservation of minor
tubers in Peru: the dynamics of oca (Oxalis
tuberosa) landrace management in a peasant
community. Plant Genetic Resources News-
letter, 132: 1–9.
Rapoport, E.H., Ladio, A., Raffaele, E., Ghermandi,
L., and Sanz, E.H. (1998). Malezas comes-
tibles — hay yuyos y yuyos … Ciencia Hoy,
9: 30–43.
Shannon, C.E. and Weaver, W. (1949). The Mathe-
matical Theory of Communication. Univer-
sity of Illinois Press, Urbana, IL.
Sibille, O. (1997). La Cuenca del Vilcanota y sus
Áreas de Influencia. Coordinación Intercen-
tros de Investigación, Desarrollo y Edu-
cación (COINCIDE), Cusco, p. 56.
Swinton, S.M. and Quiroz, R. (2003). Is poverty to
blame for soil, pasture and forest degrada-
tion in Peru’s Altiplano? World Develop-
ment, 31: 1903–1919.
Tapia, M.E. and Torre, ADl (2003). La mujer campe-
sina y las semillas andinas: Género y el
manejo de los recursos genéticos. In
/>7s00.htm#TopOfPage.
Thompson, L.G., Mosley-Thompson, E., Bolzan,
J.F., and Koci, B.R. (1985). A 1500 year
record of tropical precipitation in ice cores
from the Quelccaya Ice Cap, Peru. Science,
229: 971–973.
Troll, C. (1968). The Cordilleras of the tropical
Americas — aspects of climatic, phytogeo-
graphical and agrarian ecology. In Troll, C.
(Ed.), Geoecology of the Mountainous
Regions of the Tropical Americas, Vol. 9.
Ferd. Dümmlers Verlag, Bonn, pp. 15–56.
Vieyra-Odilon, L. and Vibrans, H. (2001). Weeds as
crops: the value of maize field weeds in the
valley of Toluca, Mexico. Economic Botany,
55: 426–443.
Williams, C.B. (1964). Patterns in the Balance of
Nature and Related Problems in Quantita-
tive Ecology. Academic Press, London and
New York.
Zimmerer, K. (1997). Changing Fortunes: Biodiver-
sity and Peasant Livelihood in the Peruvian
Andes. University of California Press, Ber-
keley.
3523_book.fm Page 331 Tuesday, November 22, 2005 11:23 AM
Copyright © 2006 Taylor & Francis Group, LLC
332 Land Use Change and Mountain Biodiversity
APPENDIX I
Province District Capital
Altitude
Capital
(m)
Population,
Projection
2002
Area
(km
2
)
Density
(inhabitants
km
-2
) Education
a
Housing
b
n cult.
sp+var
Cultivated
Area (ha)
ha
cultiv.
per
person
Percentage
of Land in
Parcels <5
ha
Ratio of
Permanent
to Annual
Crops
Sp.1000
hab
-1
Sp.100 ha
cultivated
-1
La Convención Quellouno Quellouno 650 11,900 800 14.9 49.9 79 61 11964 1.01 11.0% 4.1430 5.13 0.51
La Convención Echarate Echarate 667 56,776 19,136 3.0 51.7 60 75 26383 0.46 12.2% 5.6588 1.32 0.28
La Convención Santa Ana Quillabamba 1047 35,784 359 99.6 73.1 19.5 71 6246 0.17 34.4% 5.6094 1.98 1.14
La Convención Maranura Maranura 1120 9,419 150 62.7 58.5 68.3 47 2649 0.28 42.0% 5.4600 4.99 1.77
La Convención Huayopata Ipal 1660 9,639 524 18.4 57.8 60.6 38 3726 0.39 47.5% 7.2317 3.94 1.02
La Convención Santa Teresa Santa Teresa 1700 10,210 1,340 7.6 53.7 73.5 39 2048 0.2 29.5% 1.0398 3.82 1.90
Urubamba Machu Picchu Machu Picchu 2060 3,070 271 11.3 64.3 29.4 28 471.8 0.15 49.6% 0.4497 9.12 5.93
Urubamba Ollantaytambo Ollantaytambo 2846 9,188 640 14.4 43.1 65.3 25 2008 0.22 60.5% 0.0020 2.72 1.24
Urubamba Yucay Yucay 2857 3,516 71 49.8 71.8 3 24 406.7 0.12 88.6% 0.0564 6.83 5.90
Urubamba Huayllabamba Huayllabamba 2866 5,270 102 51.4 63.4 11.4 31 975.1 0.19 78.3% 0.0049 5.88 3.18
Urubamba Urubamba Urubamba 2871 17,079 128 133.1 66.9 19.7 38 1291 0.08 88.5% 0.0289 2.22 2.94
Calca Calca Calca 2928 16,583 311 53.3 61.5 27.8 41 1717 0.1 73.0% 0.0135 2.47 2.39
Calca Lamay Lamay 2941 5,898 94 62.6 30.3 67.3 19 1015 0.17 71.3% 0.0047 3.22 1.87
Calca Coya Coya 2951 3,932 71 55.0 42.1 30.1 25 561.2 0.14 84.1% 0.0113 6.36 4.46
Calca Pisac Pisac 2972 9,769 148 65.9 40.4 55.1 29 1295 0.13 62.1% 0.0005 2.97 2.24
Calca San Salvador San Salvador 2995 5,351 128 41.8 27.1 59.4 22 760.5 0.14 82.0% 0.0031 4.11 2.89
Quispicanchi Lucre Lucre 3086 4,256 119 35.8 56.3 19.8 20 829.5 0.19 51.4% 0.0025 4.70 2.41
Quispicanchi Oropesa Oropesa 3116 6,482 74 87.1 56.7 16.1 25 675.4 0.1 89.4% 0.0038 3.86 3.70
Quispicanchi Urcos Urcos 3150 15,811 135 117.4 43.5 20.9 22 1076 0.07 89.9% 0.0015 1.39 2.05
Quispicanchi Huaro Huaro 3157 5,289 106 49.8 55.3 36.7 18 442.4 0.08 93.1% 0.0047 3.40 4.07
Quispicanchi Quiquijana Quiquijana 3210 11,017 361 30.5 27.3 50.8 27 1601 0.15 88.8% 0.0024 2.45 1.69
Cusco San Sebastián San Sebastián 3299 47,297 89 528.8 79.4 5.3 41 666.6 0.01 85.2% 0.0006 0.87 6.15
Quispicanchi Cusipata Cusipata 3310 5,812 248 23.4 38 43 16 670.5 0.12 88.6% 0.0014 2.75 2.39
Paucartambo Caicay Caicay 3330 2,603 111 23.5 30.5 41.8 25 622.7 0.24 83.3% 0.0015 9.60 4.02
Urubamba Maras Maras 3385 8,063 132 61.2 47.1 39 34 3906 0.48 49.9% 0.0003 4.22 0.87
Cusco Cusco Cusco 3399 100,572 116 865.4 85.3 2.7 36 873.6 0.01 54.8% 0.0009 0.36 4.12
Canchis Checacupe Checacupe 3446 5,212 962 5.4 37.6 39.5 30 713 0.14 87.1% 0.0017 5.76 4.21
Canchis Combapata Combapata 3475 5,967 183 32.7 40.5 32.4 27 843 0.14 65.5% 0.0007 4.52 3.20
Canchis San Pablo San Pablo 3486 6,183 524 11.8 39.4 42.9 26 636.5 0.1 88.5% 0.0002 4.21 4.09
Canchis Sicuani Sicuani 3554 59,295 646 91.8 60.5 20.7 49 2760 0.05 67.9% 0.0002 0.83 1.78
3523_book.fm Page 332 Tuesday, November 22, 2005 11:23 AM
Copyright © 2006 Taylor & Francis Group, LLC
Climatic, Biodiversity, Socio-Economic Changes in Land Use in the Vilcanota Watershed 333
Canchis Pitumarca Pitumarca 3570 7,692 1,118 6.9 24 56.7 20 674.6 0.09 56.2% 0.0000 2.60 2.96
Urubamba Chinchero Chinchero 3762 10,166 95 107.5 49.2 21.3 34 3138 0.31 64.7% 0.0001 3.34 1.08
Acomayo Mosoc Llacta Mosco Llacta 3802 1,750 44 40.1 43.3 32.6 6 106.5 0.06 64.7% 0.0000 3.43 5.63
Note: Districts of the Cusco Department with parts in the Vilcanota watershed, ranked by altitude of the district capital. Collated and calculated from 1993–1994 census (INEI, 2003).
a
Proportion of total population above 15 years with complete or partial primary schooling.
b
Percentage of housing with no services (water, electricity, and sewage).
3523_book.fm Page 333 Tuesday, November 22, 2005 11:23 AM
Copyright © 2006 Taylor & Francis Group, LLC