Soil Sampling and Methods of Analysis - Part 5 ppt
Bạn đang xem bản rút gọn của tài liệu. Xem và tải ngay bản đầy đủ của tài liệu tại đây (1.01 MB, 126 trang )
V. SOIL ORGANIC MATTER ANALYSES
Section Editors: E.G. Gregorich and M.H. Beare
ß 2006 by Taylor & Francis Group, LLC.
ß 2006 by Taylor & Francis Group, LLC.
Chapter 45
Carbon Mineralization
D.W. Hopkins
Scottish Crop Research Institute
Dundee, Scotland, United Kingdom
45.1 INTRODUCTION
Organic matter in soils is the complex mixture of organic compounds derived from the dead
and decaying remains of plants, animals, and microorganisms, and their corpses and meta-
bolic wastes at different stages of decomposition. Mineralization of organic carbon (C) is the
conversion from the organic form to inorganic compounds as a result of decomposition
reactions carried out by decomposer organisms, the vast majority of which are microorgan-
isms (bacteria and fungi) (Gregorich et al. 2001). In the process of utilizing soil organic
matter, heterotrophic soil organisms release CO
2
during respiration. The release of CO
2
as a
metabolic by-product of organic matter decomposition is referred to as C mineralization.
Because soil organic matter is a complex mixture of organic compounds of different
biological origins and at different stages of decay, C mineralization is the result of a complex
set of biochemical processes conducted by a wide range of organisms. Despite the fact that it
is a simplification of the actual process, C mineralization measurements are commonly used
in investigations of soils and the data have a wide range of applications in agriculture,
forestry, ecology, and the environmental sciences. One reason for this is the relative ease
with which CO
2
can be measured in the laboratory. There are a wide range of methods for
measuring CO
2
production in the field and at the landscape scale, but this chapter is
concerned with measuring C mineralization under controlled laboratory conditions and
only limited reference is made to field methods to illustrate some principles.
Data on mineralization of soil C may be used in two ways. The rate of C mineralization
measured over periods from a few days to a few weeks is commonly used as an indicator of
general biological activity because it is an integrated measure of the combined respiration
rate of all the organisms active in the soil under specific conditions. However, with time and
without inputs of fresh organic matter, the rate of C mineralization declines as the most
readily available soil organic matter is depleted. The total CO
2
-C released when the rate of
production subsides is an index of the readily mineralizable fraction of organic C in soil.
Given enough time, however, all, or virtually all, soil organic matter will be mineralized and
therefore the total mineralizable C fraction is equivalent, or close, to the total organic C
content of the soil. It is important to distinguish between the total amount of C that will be
mineralized eventually and the fraction readily mineralized during the initial period of rapid
ß 2006 by Taylor & Francis Group, LLC.
decomposition when the most easily utilized and accessible components are decomposed.
This chapter focuses on the readily mineralizable fraction of the soil organic matter, which is
believed to be a biologically meaningful, albeit operationally defined, fraction of the soil
organic matter. However, defining biologically meaningful fractions is fraught with diffi-
culties (Hopkins and Gregorich 2005). Because the readily mineralizable C is one such
operationally defined fraction, the conditions under which it is measured need to be carefully
specified. It should also be recognized that there is no inherent linkage between the size of
the readily mineralizable C fraction and the rate of C mineralization measured over the short-
term. Two soils may contain the same amount of readily mineralizable C, but because of
more favorable conditions for decomposition, one may have a much faster initial rate of C
mineralization than the other.
45.2 SOIL PREPARATION AND INCUBATION CONDITI ONS
Before the start of the mineralization assay, some degree of sample preparation is inevitable,
but in general, this should be kept to a minimum consistent with being able to prepare a
representative and suitable sample. Soil is usually sieved (<2 mm) in the field moist state to
enable representative sampling and to remove stones and large pieces of plant material.
Drying and grinding the soil should be avoided because these lead to substantial increases in
mineralization, commonly referred to as a ‘‘flush’’ of respiration. The flush is caused by
the mineralization of nonbiomass released from physical protection and the C from organi-
sms killed by drying and rapid rehydration (Powlson 1980; Wu and Brookes 2005). Even
sample collection and preparation without harsh treatments such as drying and grinding lead
to a short-lived (3–4 days) flush of respiration. It is recommended that soil be preincubated
under the same temperature and moisture conditions to be used in the C mineralization assay
for a period of 7–10 days to allow equilibration before the start of the assay.
Incubation temperatures in the range 208C–258C are frequently used (e.g., Hopkins et al.
1988; S
ˇ
imek et al. 2004), but the actual temperature used can be set to match the objectives
of the particular study. If the aim of the investigation is specifically to determine the effect of
temperature on mineralization, the incubation temperature is of paramount importance.
Recent papers have drawn attention to the possibility that mineralization of different
fractions of the soil organic matter may (or may not) respond differently to incubation
temperature (Bol et al. 2003; Fang et al. 2005; Fierer et al. 2005), with obvious implications
for predicting the effects of climate change on soil organic C reservoir. If a stable tempera-
ture is required throughout an incubation, as is often the case, then it is necessary to use a
temperature-controlled room or incubator. Similar to temperature, the moisture content of
the soil during incubation needs careful consideration. Moisture contents between 50% and
60% water holding capacity (e.g., Rey et al. 2005; Wu and Brookes 2005) are commonly
used because the optimum moisture content for mineralization usually falls in this range.
However, alternative moisture contents are used when the aim of the investigation is to
determine the effect of moisture or wet–dry cycles on mineralization (e.g., Rey et al. 2005;
Chow et al. 2006; Hopkins et al. 2006).
45.3 INCUBATION AND DETECTION METHODS
Three incubation approaches to measure C mineralization in soils in the laboratory are
described. In two of them, the soil is enclosed in a sealed vessel and the CO
2
produced is
either allowed to accumulate in the headspace and then determined, or the CO
2
is trapped
ß 2006 by Taylor & Francis Group, LLC.
as it is produced (usually in alkali solution) and then determined. In the third, the soil is
incubated in a flow-through system in which the headspace is replaced by a stream of CO
2
-
free air and the CO
2
released from the soil is trapped or measured continuously as the air
flows out of the chamber. The particular choice of approach will depend on the equipment
and other resources (e.g., financial) available to the investigator and a consideration of the
advantages and disadvantages of the different methods (Table 45.1).
The method of CO
2
analysis is determined by a combination of the incubation approach
adopted and the instrumentation available. Four methods commonly used to determine CO
2
produced from soil are outlined below.
45.3.1 ACID–BASE TITRATIONS
Carbon dioxide can be trapped in alkali (typically KOH or NaOH) and then determined
by backtitration of the excess alkali with a dilute acid (Hopkins et al. 1988; Schinner
et al. 1996). In its simplest form, this can be done by a manual titration using a burette
with a pH indicator. Automatic titrators that measure pH with an electrode and deliver
acid from a mechanized burette can increase the precision, although rarely the sample
throughput.
TABLE 45.1 Some Advantages and Disadvantages of Different Approaches to Determining
C Mineralization in Soils under Laboratory Conditions
Approach Advantages Disadvantages
Closed chamber
incubation
with CO
2
accumulation in
the headspace
Inexpensive
Common equipment
requirements
Easily replicated
IRGA of CO
2
can be very rapid
Composition of the atmosphere changes
because of O
2
depletion and CO
2
enrichment, therefore unsuitable for
long-term incubations (i.e., >5–10
days) unless the headspace is flushed
Not suitable for soils with pH above
neutrality because some CO
2
is
absorbed in the soil solution
Usually only suitable for short-term
incubations
Closed chamber
incubation with
CO
2
trapping
Can be inexpensive
Can have simple equipment
requirements
Usually easily replicated
Usually suitable for both short-
and long-term incubations
Composition of the atmosphere changes
because of O
2
and CO
2
depletion,
therefore may unsuitable for
long-term incubations if there is a
large O
2
demand
Automated, multichannel respirometers
are expensive
Manual titration of alkali traps can be
time consuming and produce toxic
waste products that require disposal
Open chamber
incubation with
continuous
flushing and CO
2
trapping
Suitable for both long- and
short-term incubations
More expensive
More complex equipment
Less easily replicated
ß 2006 by Taylor & Francis Group, LLC.
45.3.2 INFRARED G AS A NALYSIS
Carbon dioxide absorbs radiation in the infrared region and detection of this absorbance is at
the heart of infrared gas analyzers (IRGAs) used to determine CO
2
in both closed and open
chamber incubation systems (e.g., Bekku et al. 1995; Schinner et al. 1996; Rochette et al.
1997; King and Harrison 2002). There are a range of IRGAs commercially available, and
many of those used for measuring CO
2
from soil are modifications of systems used for
photosynthesis measurements.
45.3.3 CONDUCTIOMETRY
Carbondioxidetrappedinalkalicanbedeterminedconductiometricallyontheprinciplethatthe
impedance of the alkali solution declines as CO
2
is absorbed. Although stand-alone conductio-
metric systems can be assembled (Chapman 1971; Anderson and Ineson 1982), this method of
CO
2
detection is usually an integral part of multichannel respirometers (Nordgren 1988) which
are expensive, but permit a high degree of replication and near-continuous measurements.
45.3.4 G AS C HROMATOGRAPHY
Gas chromatography (GC) provides very precise analysis, but is suitable only for incubation
approaches in which CO
2
accumulates. There is wide variety of GCs available for CO
2
determination and a review of the different types is beyond the scope of this chapter.
However, the commonest GC methods involve separation on packed columns and detection
using either a thermal conductivity (i.e., hot-wire) detector (e.g., Hopkins and Shiel 1996;
Schinner et al. 1996). One advantage of GC is that the instruments are very versatile and can
be modified for use in many types of analyses other than CO
2
determination by reconfiguring
the injector, column, and detector.
45.4 CLOSED CHAMBER INCUBATION WITH ALKALI CO
2
TRAPS
45.4.1 M
ATERIALS AND REAGENTS
1
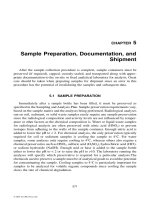
Incub ation jars with gast ight lids (Ma son or Kil ner types ; Figur e 45.1 )
2
Glass vials (20–50 mL) for the alkali solution and water
3
M NaOH solution
4
0.5 M HCl solution
5
Phenolphthalein solution
6
1 M BaCl
2
7
Pipettes
8
Burette or automatic titrator
9
Magnetic stirrer (optional)
10
Incubator or co ntrolled environment room (optional)
ß 2006 by Taylor & Francis Group, LLC.
45.4.2 PROCEDURE
Weigh 100–150 g (dry weight equivalent) into jars and record the weight of each jar plus soil
without its lid. Place one vial containing 10 mL of 1 M NaOH and one vial containing water
into each jar and seal them with the lids (Figure 45.1). Incubate the jars in the dark and at the
desired temperature. The CO
2
can be assayed at intervals of 3–10 days typically. For each
mole of CO
2
trapped in the NaOH, 2 moles of NaOH will be converted to Na
2
CO
3
(Equation
45.1). Therefore, the total CO
2
produced is twice the depletion of NaOH in the trap. Remove
the vials of water and NaOH and then backtitrate the excess NaOH with HCl (Equation 45.2)
using phenolphthalein as an indicator after having removed dissolved CO
2
and carbonates by
precipitation with the addition of 2 mL of BaCl
2
.
2NaOH þ CO
2
! Na
2
CO
3
þ H
2
O (45:1)
NaOH þ HCl ! NaCl þ H
2
O (45:2)
For example, if 5 mL of 0.5 M HCl was required to backtitrate the excess NaOH in an
alkali trap that originally contained 10 mL of 1.0 M NaOH after precipitating the carbonates
with BaCl
2
, then the CO
2
content of the traps would be calculated as
CO
2
in trap ¼ 0:5 Â (((V
NaOH
 C
NaOH
)=1000) À ((V
HCl
 C
HCl
)=1000)) (45:3)
where V
NaOH
is the initial volume of NaOH (mL), C
NaOH
is the initial molar concentration of
NaOH, V
HCl
is the volume of HCl used in the titration (mL), and C
HCl
is the molar
concentration of HCl used in the titration.
So, CO
2
in the trap ¼ 0:5 Â [((10 Â 1:0)=1000) À ((5 Â 0:5)=1000)]
¼ 0:00375 mol C
H
2
O
Alkali
Soil
FIGURE 45.1. Closed incubation vessel with NaOH traps for CO
2
.
ß 2006 by Taylor & Francis Group, LLC.
Where the incubation involved 100 g of dry weight equivalent soil and an incubation time of
48 h, the C mineralization rate would be calculated as
C mineralization rate ¼ CO
2
in the trap =(soil mass in g  incubation time in h)
¼ 0:00375 =(100 Â 48)
¼ 0:00000078 mol C g
À1
soil h
À1
or 0:78 mmol C g
À1
soil h
À1
(45:4)
If the incubation is to be continued, wipe any condensation from the inside of the jar and the
lid, weigh the jars, and correct for any weight loss by addition of water. Then put fresh NaOH
and water vials in the jars, reseal them, and continue the incubation.
45.4.3 COMMENTS
The method given here is very general and may be adapted to address a wide range of specific
research questions. Among other factors, the amount of soil, the temperature and moisture
conditions, the concentration and amount of NaOH, and the incubation time can all be adjusted
to suit particular applications. It is, however, important to be sure that the headspace in the jars
is large enough to avoid the risk of anaerobiosis during long-term incubations. Typically, 100–
150 g soil in a 1000 mL vessel is suitable for 3–4 days incubation intervals. It is also important
to ensure that the amount of NaOH is adequate to trap all the CO
2
produced. If the amount of
CO
2
produced is small, reducing the NaOH concentration will increase the sensitivity of the
assay. Carbonic anhydrase can be added to the analyte to catalyze the dissolution of CO
2
in
water and allow titration between two pH endpoints, 8.3 to 3.7 (Underwood 1961). An
automatic titrator and a magnetic stirrer can be used to help improve the precision of the
titration. However, these are not essential as the assays can be carried out satisfactorily using
manual equipment provided the operator is careful and skilful.
Commonly used protocols that employ closed chamber incubations to measure soil bio-
logical activity and to quantify the amount of readily mineralizable C in soil are given below.
Closed chamber techniques involving alkali traps for measuring CO
2
production in the field
have also been described by Anderson (1982) and Zibilske (1994).
45.5 CLOSED CHAMBER INCUBATION WITH CO
2
ACCUMULATION
45.5.1 M
ATERIALS AND REAGENTS
1
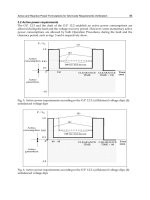
Mini aturized incub ation vessels (Figure 45.2a an d Figure 45.2b)
2
1% CO
2
gas standard mixtur e
3
Gas chromatograph
4
Incubator (optional)
45.5.2 PROCEDURE
This procedure is based on that of Heilmann and Beese (1992) as modified by Hopkins and
Shiel (1996). Weigh 10–15 g (dry weight equivalent) soil into glass vials, put them into the
ß 2006 by Taylor & Francis Group, LLC.
incubation chambers, and set the volume of the incubation chamber by adjusting the plunger
before closing the three-way tap (Figure 45.2a). After 2–3 days, remove a sample of the
headspace gas using the smaller sampling syringe, flushing it several times to ensure mixing.
Analyze the gas sample by GC. Many GC configurations can be used. In the method of
Hopkins and Shiel (1996), a GC fitted with a 1.32 m long  3 mm internal diameter stainless
steel column packed with 80 =100 mesh Poropak Q and a thermal conductivity detector was
used. After sampling the gas from the headspace, the air in the incubation chambers should
be replenished before they are resealed and the incubation continued. The incubation
chamber shown in Figure 45.2b is an adaptation of the chamber used in Figure 45.1,
which can be used for CO
2
accumulation.
45.5.3 C OMMENTS
Soils may contain CO
2
sinks, such as alkaline soil solution in which bicarbonate may
accumulate (Martens 1987) and chemoautotrophic bacteria which reduce CO
2
(Zibilske
1994). The importance of these sinks is often overlooked, but in alkaline soils, where the
capacity for CO
2
dissolution is large or where the respiratory CO
2
flux is small they
may lead to underestimates of C mineralization, methods in which CO
2
is trapped may
be preferable.
The incubation chambers can be assembled from easily available materials; however,
because some grades of plastic are permeable to CO
2
and the joints between components
may leak, it is advisable either to check plastic materials before starting or to use glass
equipment. If plastic syringes are used, care should be taken to ensure that the insides of the
syringe barrels and the plungers do not get scored by soil particles as this will cause them to
leak. Because the headspace volume is relatively small, prolonged incubation without
replenishing the headspace is not advisable as this will increase the chance of anaerobiosis
and will also increase the risk of leakage.
Glass vial
Soil
60 mL syringe
Three-way valve
1 mL syringe
Hypodermic needle
Septum
H
2
O
Soil
(a) (b)
FIGURE 45.2. Two different (a and b) closed incubation vessels in which CO
2
can accumulate.
ß 2006 by Taylor & Francis Group, LLC.
45.6 OPEN CHA MBER INCUB ATION
The system outlined in Figure 45.3 is suitable for collecting CO
2
in an open chamber
incubation in which the airflow is maintained either by a suction pump or vacuum line to
draw air through the apparatus, or by air pumps (such as a diaphragm aquarium pump) or
compressed gas cylinders to force air through the apparatus. Depending on the source of the air,
it is necessary to consider the purity of the gas and if necessary use supplementary concentrated
H
2
SO
4
scrubbers to remove organic contaminants from the compressed gas cylinder or carried
over from the pumps. The CO
2
bubble traps on the upstream side of the soil can be replaced
with soda lime traps. After the incubation, the contents of the NaOH traps are quantitatively
transferred to a beaker and the CO
2
produced is determined by titration as described in Section
45.4.2. The main advantages of this approach are that there is no risk of anaerobiosis or leakage
of accumulated CO
2
, and soil drying is reduced by the air flowing through the water bottle
immediately upstream of the incubation chamber. The equipment can be assembled from
easily available laboratory glassware. However, for replicated measurements multiple systems
will be required and this will increase the amount of laboratory space required.
45.7 COND UCTIOMETRIC RESPIROMETERS
There is a range of dedicated multichannel respirometers, which can be used to measure CO
2
production (and in some cases other gases) in soils, sediments, composts, animals, and cell
cultures (including microorganisms). A systematic account of the operation of these instru-
ments is beyond the scope of this chapter. The instrument which appears to be most widely
used in soil research is the Respicond instrument (Nordgren 1988). This instrument com-
prises up to 96 chambers (Figure 45.4) in which CO
2
is trapped in KOH. Absorbed CO
2
leads
to a fall in the conductance of the trap as the KOH concentration falls. This change in
Soil
NaOH
H
2
O
NaOH NaOH
Enlarged
view
Airflow
Airflow
To pump
Multiple NaOH traps
FIGURE 45.3. Open incubation vessel in which CO
2
released into a CO
2
-free air stream is
trapped in NaOH traps. (Adapted from Zibilske, L.M., in R.W. Weaver, S. Angle,
P. Bottomly, D. Bezdieck, S. Smith, A. Tabatabai, and A. Wollum (Eds), Methods of
Soil Analysis, Part 2—Microbiological and Biochemical Processes, Soil Science
Society of America, Madison, Wisconsin, 1994.)
ß 2006 by Taylor & Francis Group, LLC.
conductance can be measured as frequently as every 30–45 min and the instrument can run
for many months with only minimal interruptions. The conductance measurement is very
sensitive to temperature fluctuations and variations in the electrical supply to the instrument.
Although the instrument has integral temperature control, best results are obtained when it is
located in a temperature-controlled room with an isolated electricity supply.
Soil
Alkali (KOH)
Pt electrodes
Stopper
FIGURE 45.4. Closed incubation vessel using within the Respicond respirometer. (Adapted from
Nordgren, A., Soil Biol. Biochem., 20, 955, 1988.)
REFERENCES
Anderson, J.M. and Ineson, P. 1982. A soil micro-
cosm system and its application to measurements
of respiration and nutrient leaching. Soil Biol.
Biochem. 14: 415–416.
Anderson, J.P.E. 1982. Soil respiration. In A.L.
Page et al., Eds. Methods of Soil Analysis, Part
2—Chemical and Biological Properties, 2nd ed.
Agronomy Society of America, Madison, WI,
pp. 831–871.
Bekku, Y., Koizumi, H., and Iwaki, H. 1995.
Measurement of soil respiration using closed-
chamber method—an IRGA technique. Ecol.
Res. 10: 369–373.
Bol, R., Bolger, T., Cully, R., and Little, D. 2003.
Recalcitrant soil organic materials mineralize
more efficiently at higher temperatures. Z. Pflanzen.
Boden. 166: 300–307.
Chapman, S.B. 1971. Simple conductiometric soil
respirometer for field use. Oikos 22: 348.
Chow, A.T., Tanji, K.K., Gao, S.D., and Dahlgren,
R.A. 2006. Temperature, water content and
wet–dry cycle effects on DOC and carbon miner-
alization in agricultural peat soils. Soil Biol.
Biochem. 38: 477–488.
Fang, C.M., Smith, P., Moncrieff, J.B., and Smith,
J.U. 2005. Similar responses of labile and resistant
soil organic matter pools to changes in tempera-
ture. Nature 433: 57–59.
Fierer, N., Craine, J.M., McLauchlan, K., and
Schimel, J.P. 2005. Litter quality and the tem-
perature sensitivity of decomposition. Ecology
82: 320–326.
Gregorich, E.G., Turchenek, L.W., Carter, M.R.,
and Angers, D.A. 2001. Soil and Environ-
mental Sciences Dictionary. CRC Press, Boca
Raton, FL.
Heilmann, B. and Beese, F. 1992. Miniaturized
method to measure carbon dioxide production and
ß 2006 by Taylor & Francis Group, LLC.
biomass of soil microorganisms. Soil Sci. Soc.
Am. J. 56: 596–598.
Hopkins, D.W. and Gregorich, E.G. 2005. Carbon
as a substrate for soil organisms. In R.D. Bardgett,
M.B. Usher, and D.W. Hopkins, Eds. Biodiversity
and Function in Soils, British Ecological Society
Ecological Reviews. Cambridge University Press,
Cambridge, pp. 57–79.
Hopkins, D.W. and Shiel, R.S. 1996. Size and
activity of soil microbial communities in long-
term experimental grassland plots treated with
manure and inorganic fertilizers. Biol. Fert.
Soils 22: 66–70.
Hopkins, D.W., Shiel, R.S., and O’Donnell, A.G.
1988. The influence of sward species composition
on the rate of organic matter decomposition in
grassland soil. J. Soil Sci. 39: 385–392.
Hopkins, D.W., Sparrow, A.D., Elberling, B.,
Gregorich, E.G., Novis, P., Greenfield, L.G., and
Tilston, E.L. 2006. Carbon, nitrogen and tempera-
ture controls on microbial activity in soils from
an Antarctic dry valley. Soil Biol. Biochem 38:
3130–3140.
King, J.A. and Harrison, R. 2002. Measuring soil
respiration in the field: an automated closed
chamber system compared with portable IRGA
and alkali adsorption methods. Commun. Soil
Sci. Plant Anal. 33: 403–423.
Martens, R. 1987. Estimation of microbial bio-
mass in soil by the respiration methods: import-
ance of soil pH and flushing methods for respired
CO
2
. Soil Biol. Biochem. 19: 77–81.
Nordgren, A. 1988. Apparatus for the continuous,
long-term monitoring of soil respiration rate in
large numbers of samples. Soil Biol. Biochem .
20: 955–957.
Powlson, D.S. 1980. The effects of grinding on
microbial and non-microbial organic matter in
soil. J. Soil Sci. 31: 77–85.
Rey, A., Petsikos, C., Jarvis, P.G., and Grace, J.
2005. Effect of temperature and moisture on rates
of carbon mineralization in a Mediterranean oak
forest soil under controlled and field conditions.
Eur. J. Soil Sci. 56: 589–599.
Rochette, P., Ellert, B., Gregorich, E.G., Desjardins,
R.L., Pattey, E.L., Lessard, R., and Johnson, B.G.
1997. Description of a dynamic closed chamber
for measuring soil respiration and its comparison
with other techniques. Can. J. Soil Sci . 77:
195–203.
Schinner, F., O
¨
hlinger, R., Kandeler, E., and
Margesin, R. 1996. Methods in Soil Biology.
Springer-Verlag, Berlin, Germany.
S
ˇ
imek, M., Elhottova
´
, D., Klimes
ˇ
, F., and
Hopkins, D.W. 2004. Emissions of N
2
OandCO
2
,
denitrification measurements and soil properties in
red clover and ryegrass stands. Soil Biol. Biochem.
36: 9–21.
Underwood, A.L. 1961. Carbonic anhydrase in
the titration of carbon dioxide solutions. Anal.
Chem. 33: 955–956.
Wu, J. and Brookes, P.C. 2005. The proportional
mineralization of microbial biomass and organic
matter caused by air-drying and rewetting of a
grassland soil. Soil Biol. Biochem. 37: 507–515.
Zibilske, L.M. 1994. Carbon mineralization. In
R.W. Weaver, S. Angle, P. Bottomly, D. Bezdieck,
S. Smith, A. Tabatabai, and A. Wollum, Eds.
Methods of Soil Analysis, Part 2—Microbiological
and Biochemical Processes, SSSA Book Series
No. 5. Soil Science Society of America, Madison,
WI, pp. 835–863.
ß 2006 by Taylor & Francis Group, LLC.
Chapter 46
Mineralizable Nitrogen
Denis Curtin
New Zealand Institute for Crop and Food Research
Christchurch, New Zealand
C.A. Campbell
Agriculture and Agri-Food Canada
Ottawa, Ontario, Canada
46.1 INTRODUCTION
Nitrogen (N) is generally the most common growth-limiting nutrient in agricultural produc-
tion systems. The N taken up by crops is derived from a number of sources, partic ularly from
fertilizer, biological N fixation and mineralization of N from soil organic matter, crop
residues, and manures (Keeney 1982). The contribution of mineralization to crop N supply
may range from <20 to >200 kg N ha
À1
(Goh 1983; Cabrera et al. 1994) depending on the
quantity of mineralizable organic N in the soil and environmental conditions (soil tempera-
ture and moisture) that control the rate of mineralization. Large amounts of mineralizable
N can accumulate under grassland with the result that crops grown immediately after
cultivation of long-term grass may derive much of their N from mineralization. In contrast,
soils that have been intensively cropped often mineralize little N, leaving crops heavily
dependent on fertilizer N.
Potentially mineralizable N is a measure of the active fraction of soil organic N, which is
chiefly responsible for the release of mineral N through microbial action. Min eralizable N
is composed of a heterogeneous array of organic substrates including microbial bio-
mass, residues of recent crops, and humus. Despite a continuing research effort (Jali l et al.
1996; Picone et al. 2002), chemical tests that are selective for the mineralizable portion of
soil N are not available and incubation assays remain the preferred way of estimating
mineralizable N.
Stanford and Smith (1972) proposed a method to estimate potentially mineralizable N based
on the mineral N released during a 30 week aerobic incubation of a soil:sand mixture under
optimum temperature and moisture conditions. Although this procedure is regarded as the
standard reference method, its main application is as a research tool because it is too
time-consuming for routine use. Shortened versions of the aerobic incubation method have
been found useful in evaluating soil N supplying power (Paul et al. 2002; Curtin and
ß 2006 by Taylor & Francis Group, LLC.
McCallum 2004), but these assays still take several weeks to complete and require
considerable technical expertise.
An anaerobic incubation method for estimating mineralizable N was proposed by Keeney and
Bremner (1966). This anaerobic (i.e., waterlogged soil) technique has significant practical and
operational advantages over aerobic techniques in that the incubation period is relatively short
(7 days) and the need for careful adjustment of soil water content is avoided. This assay is
occasionally used for routine soil fertilit y testing by commercial labo ratories. Altho ugh
Keeney and Bremner (1966) reported good correlations between anaerobically mineralizable
N (AMN) and plant N uptake under greenhouse conditions, subsequent work with field-grown
crops has given mixed results (Thicke et al. 1993; Christensen et al. 1999).
46.2 POTENTIALLY MINERALIZABLE N
46.2.1 T
HEORY
In theory, potentially miner alizable N is the amount of N that will mineralize in infinite time
at optimum temperature and moisture. It is estimated by incubating soil under optimal
conditions and measuring N mineralized as a function of time by periodically leaching
mineral N from the soil. Potentially mineralizable N is calculated using a first-order
kinetic model:
N
min
¼ N
0
(1Àe
Àkt
) (46:1)
where N
min
is cumulative N mineralized in time t, N
0
is potentially mineralizable N, and k is
the mineralization rate constant. This equation has two unknowns (N
0
and k), which are
usually estimated by least-squares iteration using appropriate statistics software.
46.2.2 MATERIALS
1
Incubator capable of maintaining temperatures of up to 408C (and humidity near
100% so that soils do not dry out during incubation).
2
Vacuum pump to extract leachate at $À80 kPa.
3
Leaching units to hold incubating soils. These can be purpose-made leaching
tubes (Campbell et al. 1993), commercially ava ilable filter units (e.g., 150 mL
membrane filter units; MacKay and Carefoot 1981), or Buchner funnels (Ellert and
Bettany 1988; Benedetti and Sebastiani 1996).
4
Glass wool to make a pad ~6 mm thick at the bottom and 3 mm on top of the
incubating sample.
5
Acid-washed, 20 mesh quartz sand.
6
0:01 M CaCl
2
leaching solution (made from a stock solution of CaCl
2
).
7
N-free nutrient solution containing 0:002 M CaSO
4
,0:002 M MgSO
4
,
0:005 M Ca(H
2
PO
4
)
2
,and0:0025 M K
2
SO
4
to replace nutrients removed from
the soil during leaching.
ß 2006 by Taylor & Francis Group, LLC.
46.2.3 PROCEDURE
1
Soils are usually air-dried and sieved before incubation, but field-moist soil may
also be used. The N mineralization rate can be quite sensitive to sample pretreat-
ment, particularly in the early phase of incubation (see Section 46.2.5).
2
Mix 15–50 g of soil with sand at a soil:sand ratio of 1:1 for medium-textured
soils and 1:2 for fine-textured soils. It may be helpful to apply a light mist
of water to prevent particle=aggregate size segregation during transfer to the
leaching tubes.
3
Sand–soil mixture is supported in the leaching tube on a glass wool pad or by a
sandwich of glass wool=Whatman glass microfiber filter=glass wool. A thin pad of
glass wool is placed on top of the soil–sand mixture to prevent aggregate disrup-
tion when leaching solution is applied.
4
Native mineral N is leached using 100 mL of 0:01 M CaCl
2
, applied in small
increments (~10 mL) followed by 25 mL of N-free nutrient solution. The soil–sand
mixture is initially allowed to drain naturally, then a vacuum (À80 kPa) is applied
to remove excess water. Discard the first leachate.
5
Tubes are stoppered at both ends and placed in an incubator at 358C.
A hypodermic needle (38 mm, 16–18 gauge) is inserted in the bottom to facilitate
aeration. Twice per week the top stopper is briefly removed to facilitate aeration.
6
Step 4 (leaching) is repeated every 2 weeks for the first 8–1 0 weeks of incubation
and every 4 weeks thereafter. The collected leachate is filtered through a pre-
washed Whatman No. 42 filter paper and analyz ed for NO
3
- and NH
4
-N.
7
Incubation can be terminated when cumulative N mineralized approaches a
plateau. This usually occurs after about 20 weeks (see Section 46.2.5).
46.2.4 CALCULATIONS
Nonlinear least-square regression is the preferred statistical technique to estimate N
0
and k in
the first-order kinetic model (Campbell et al. 1993; Benedetti and Sebastiani 1996). Rough
estimates of N
0
and k are needed to initiate the calculation. We suggest an initial estimate of
k $ 0:10 per week (values normally between 0.05 and 0.20 per week) and N
0
can be assumed
to be about 50% greater than cumulative mineralized N at the end of the incubation period
(Campbell et al. 1993).
46.2.5 COMMENTS
1
The most appropriate way of handling samples before incubation has not
been established. Both air-dry soil and field-moist samples have been used.
Where moist samples are to be used, they should be refrigerated (about 48C) in
the period between sampling and incubation. Campbell et al. (1993) recommend
air-drying after collection, which may be appropriate in regions where soils
become air-dry in the field. Air-drying can kill off part of the microbial
biomass and rapid mineralization of this microbial-N will occur upon rewetting.
ß 2006 by Taylor & Francis Group, LLC.
The single- exponen tial mod el (Equat ion 46.1) may not ad equately de scribe the
initial flush of mineralization that occurs after rewetting (Cabrera 1993) and data for
the first 2 weeks have sometimes been excluded when estimating N
0
(Stanford and
Smith 1972). The degree of sample disturbance (e.g., fineness of sieving) may also
influence the results. However, Stenger et al. (2002) found little difference in N
mineralization (6 month incubation) between intact and sieved (<2 mm) soils.
2
An assumption implicit in Equation 46.1 is that there is only one pool of mineral-
izable N. This assumption is dubious as there is clear evidence for the existence of
several forms of ‘‘active’’ N. There have been attempts to improve data fit by
assuming two or three pools of mineralizable N (Deans et al. 1986). While a two
pool (i.e., double exponential) model usually fits laboratory N mineralization data
more precisely than a single-exponential model (Curtin et al. 1998), many workers
consider the improvement insufficient to warrant its use for general purposes
(Campbell et al. 1988).
3
Values of N
0
and k obtained by data fit to Equation 46.1 can vary depending on
temperature, moisture content, and duration of incubation (Wang et al. 2003).
The optimum temperature for N mineralization is often considered to be 358C.
Campbell et al. (1993) suggest ed that incubation at a lower temperature (e.g.,
288C) may result in a lag phase in N mineralization during the first 2 weeks of
incubation. A lag phase may be exhibited by soils containing C-rich substrates
(e.g., forest soils) where net N mineralization may initially be low because N
immobilization predominates (Scott et al. 1998). Optimum soil moisture content
is about field capacity (À5toÀ10 kPa). The incubation time should, ideally, be at
least 25 weeks (Ellert 1990). Values of N
0
tend to increase and k to decrease as
incubation time is extended (Paustian and Bonde 1987; Wang et al. 2003).
Cumulative N mineralized (N
min
) typically increases asymptotically to reach a
plateau after abo ut 16–20 weeks of incubation (Campbell et al. 1993).
4
A problem inherent in fitting the first-order model to mineralization data is that
there tends to be an inverse relationship between N
0
and k. It has been argued
that to obtain values of N
0
that are truly indicative of the amount of mineralizable
in the soil, k should be set to a standard value (e.g., 0.054 per week) (Wang
et al. 2003). This approach minimizes the effect of incubation time on N
0
(values
not affected by changes in incubation duration from 20 to 40 weeks; Wang
et al. 2003).
46.3 SHORT-TERM AEROBIC INCUBATION
Short-term aerobic incubation techniques have the obvious advantage that a more timely
estimate of mineralizable N can be obtained, and, since periodic leaching is not required, the
labor requirement is reduced. Based on analysis of two data sets, Campbell et al. (1994)
showed that N mineralized in the first 2 weeks of incubation was reasonably well related to
N
0
in North American soils. However, this may not always be the case. Certain soils (e.g.,
forest soils with high C:N ratio; Scott et al. 1998) can immobilize substantial N during short
incubation and net N mineralized in the short-term may not be closely related to N
0
. Various
short-term incubation assays have been proposed; they differ in incubation duration and
temperature. Parfitt et al. (2005) reported that N mineralized in a 56 day aerobic incubation
(258C) was closely correlated with N uptake by legume-based pastures in New Zealand.
ß 2006 by Taylor & Francis Group, LLC.
Nitrogen mineralize d in a 28 day aerobic incubation (208C) was closely related to N uptake
by a greenhouse-grown oat (Avena sativa L.) crop from 30 soils representing a range of
management histories and parent materials (Curtin and McCallum 2004). Longer (56 vs. 28
days) incubations may give results that more accurately reflect N supply over a growing
season, but may not be attractive where timeliness of results is an important consideration.
Field rates of mineralization may be estimated by adjusting the basal value (i.e., the value
determined by incubation under defined temperature and moisture conditions) using soil
temperature and moisture adjustment factors (Paul et al. 2002).
The following procedure is based on the method used by Scott et al. (1998) and Parfitt et al.
(2005).
46.3.1 PROCEDURE
1
Weigh sieved (<4 or 5 mm), field-moist soil (equivalent to about 5 g of dry soil)
into 125 mL polypropylene containers (use of field-moist soil is recommended to
avoid the flush of mineralization that occurs when air-dry soil is rewetted;
however, air-dry samples may be appropriate for semiarid soils).
2
Add water to adjust the soil water content so that it is equivalent to À10 kPa. Soil
water content at À10 kPa is normally determined from tensio n table meas ure-
ments on a separate sample.
3
Cover containers with polyethylene (30 mm) held in place with rubber bands and
place in plastic trays containing water, enclosed in large polyethylene bags (to
maintain high humidity).
4
Incubate at the desired temperature (208Cto308C) for the required time period
(e.g., 28 or 56 days).
5
Measure mineral N (NO
3
- plus NH
4
-N) at the end of incubation by extraction
with 2 M KCl. Mineral N in the soil before incubation is determined by extracting
a separate sample with KCl.
6
Mineralized N is calculated by subtracting initial mineral N from that determined
at the end of the incubation.
46.4 ANAEROBIC INCUBATION
This technique offers important operational and practical advantages that make it more
suitable for routine use than aerobic incubation. The incubation period is relatively short
(7 days); the same volume of water is added to all soils regardless of water holding capacity;
and NH
4
-N only needs to be measured because NO
3
-N is not produced under anaerobic
conditions.
46.4.1 PROCEDURE
1
Weigh 5 g of sieved (<4 or 5 mm) soil into a 50 mL plastic, screw-cap centrifuge
tube. Add 10 mL of distilled water to submerge the soil, stopper the tube, and
place in a constant temperature (408C) cabinet=incubator for 7 days.
ß 2006 by Taylor & Francis Group, LLC.
2
Remove tube from incubator and add 40 mL of 2.5 M KCl (after dilution with
water in the sample, final KCl concentration is 2 M). Mix contents of tube,
centrifuge at 1900 g, and filter the supernatant (prewashed Whatman No. 42).
3
Determine NH
4
-N in the supernatant. Measure the amount of NH
4
-N in the soils
before incubation by extracting a separate sample with KCl. Mineralized N is
estimated by deducting this preincubation NH
4
-N value from the amount measured
in the incubated sample.
46.4.2 COMMENTS
1
Since most arable soils do not contain appreciable NH
4
-N, it may be possible to
dispense with the initial NH
4
-N measurement; however, preliminary checks
should be carried out to verify that native NH
4
-N is negligible (Keeney 1982).
2
Sample prepar ation has not been standardized; air-dry and field-moist soils are
commonly used to measure AMN. Larsen (1999) suggests that pretreatment (air-
drying, freezing) can have a strong effect on AMN and he recommends the use of
fresh, field-moist soil.
3
Although AMN is correlated with the N mineralized in an aerobic incubation, the
relationship is often not very close (Curtin and McCallum 2004).
4
To be useful as part of a fertilizer N recommendation system, an empirical
calibration of AMN against crop performance under local field conditions is
recommended (Christensen et al. 1999).
46.5 CHEMICAL INDICES OF NITROGEN
MINERALIZATION CAPACITY
Because of the time requirement of the biological assays described above, chemical tests have
been evaluated as possible surrogates. Chemical procedures have the advantage that they can
be more rapid and precise than biological (incubation) assays but, to date, no extractant has
been capab le of simulating the microbially mediated release of mineral N that occurs in
incubated soil. Most chemical tests are relatively simple in their mode of action, i.e., they
selectively extract a particular form or forms of N. On the other hand, mineralization is a
complex microbial process comprised of subprocesses that release (gross mineralization) and
consume (immobilization) mineral N. Net N mineralization, as measured in incubation assays,
is the balance between the processes of gross N mineralization and N immobilization.
Chemical tests that select for labile fractions of soil N have potential in estimating gross N
mineralization (Wang et al. 2001). However, predicting net N mineralization based on
a chemical extraction test is more problematic because such tests cannot account for N
immobilization.
Although many chemical tests for N availability have been proposed (listed by Keeney
1982), none of them has been adopted for general or routine use in soil fertility evaluation.
Perhaps the chemical test that has attracted most attention in the past decade is hot 2 M KCl
extraction, which causes hydrolysis of some organic N to NH
4
(Gianello and Bremner 1986).
Despite some encouraging observations (Gianello and Bremner 1986; Jalil et al. 1996;
Beauchamp et al. 2004), the performance of the test has not been consistent overa ll
ß 2006 by Taylor & Francis Group, LLC.
(Wang et al. 2001; Curtin and McCallum 2004). Work on chemical test development and
evaluation is continuing (e.g., Mulvaney et al. 2001; Picone et al. 2002). However, there is
presently no agreement among researchers on which of the available soil N tests has the most
potential to serve as a predictor of soil N supplying power and, until scientific consensus
emerges, it would be unwise to recommend any test for general use.
REFERENCES
Beauchamp, E.G., Kay, B.D., and Pararajasingham,
R. 2004. Soil tests for predicting the N requirement
of corn. Can. J. Soil Sci. 84: 103–113.
Benedetti, A. and Sebastiani, G. 1996. Determin-
ation of potentially mineralizable nitrogen in agri-
cultural soil. Biol. Fert. Soils 21: 114–120.
Cabrera, M.L. 1993. Modeling the flush of nitro-
gen mineralization caused by drying and rewet-
ting soils. Soil Sci. Soc. Am. J. 57: 63–66.
Cabrera, M.L., Kissel, D.E., and Vigil, M.F. 1994.
Potential nitrogen mineralization: laboratory and
field evaluation. In J.L. Havlin and J.S. Jacobsen,
eds. Soil Testing: Prospects for Improving Nutri-
ent Recommendations. Soil Science Society of
America Special Publication No. 40. SSSA and
ASA, Madison, WI, pp. 15–30.
Campbell, C.A., Ellert,B.H.,andJame,Y.W. 1993.
Nitrogen mineralization potential in soils. In M.R.
Carter, ed. Soil Sampling and Methods of Analysis.
Lewis Publishers, Boca Raton, FL, pp. 341–349.
Campbell, C.A., Jame, Y.W., Akinremi, O.O.,
and Beckie, H.J. 1994. Evaluating potential
nitrogen mineralization for predicting fertilizer
nitrogen requirements of long-term field experi-
ments. In J.L. Havlin and J.S. Jacobsen, eds. Soil
Testing: Prospects for Improving Nutrient Recom-
mendations. Soil Science Society of America
Special Publication No. 40. SSSA and ASA,
Madison, WI, pp. 81–100.
Campbell, C.A., Jame, Y.W., and de Jong, R.
1988. Predicting net nitrogen mineralization
over a growing season: model verification. Can.
J. Soil Sci. 68: 537–552.
Christensen, N.W., Qureshi, M.H., Baloch, D.M.,
and Karow, R.S. 1999. Assessing nitrogen mineral-
ization in a moist xeric environment. Proceed-
ings, Western Nutrient Management Conference,
Vol. 3, March 4–5, 1999. Salt Lake City, UT.
Potash & Phosphate Institute, Norcross, GA,
pp. 83–90.
Curtin, D., Campbell, C.A., and Jalil, A. 1998.
Effectsof acidityonmineralization:pH-dependence
of organic matter mineralization in weakly acidic
soils. Soil Biol. Biochem. 30: 57–64.
Curtin, D. and McCallum, F.M. 2004. Biological
and chemical assays to estimate nitrogen supply-
ing power of soils with contrasting management
histories. Aust. J. Soil Res. 42: 737–746.
Deans, J.R., Molina, J.A.E., and Clapp, C.E.
1986. Models for predicting potentially minera-
lizable nitrogen and decomposition rate constants.
Soil Sci. Soc. Am. J. 50: 323–326.
Ellert, B.H. 1990. Kinetics of nitrogen and sulfur
cycling in Gray Luvisol soils. Ph.D. thesis, Univer-
sity of Saskavtchewan, Saskatoon. SK, Canada,
397 pp.
Ellert, B.H. and Bettany, J.R. 1988. Comparison
of kinetic models for describing net sulfur and
nitrogen mineralization. Soil Sci. Soc. Am. J. 52:
1692–1702.
Gianello, C. and Bremner, J.M. 1986. Compari-
son of chemical methods of assessing potentially
available organic nitrogen in soil. Commun. Soil
Sci. Plant Anal. 17: 215–236.
Goh, K.M. 1983. Predicting nitrogen require-
ments for arable farming: a critical review and
appraisal. Proc. Agron. Soc. New Zealand 13:
1–14.
Jalil, A., Campbell, C.A., Schoenau, J., Henry, J.L.,
Jame, Y.W., and Lafond, G.P. 1996. Assessment
of two chemical extraction methods as indices of
available nitrogen. Soil Sci. Soc. Am. J.60:
1954–1960.
ß 2006 by Taylor & Francis Group, LLC.
Keeney, D.R. 1982. Nitrogen—availability
indices. In A.L. Page et al., Eds. Methods of Soil
Analysis. Part 2, 2nd ed. Chemical and Microbio-
logical Properties, Agronomy 9. SSSA and ASA,
Madison, WI, pp. 711–733.
Keeney, D.R. and Bremner, J.M. 1966. Compari-
son and evaluation of laboratory methods of
obtaining an index of soil nitrogen availability.
Agron. J. 58: 498–503.
Larsen, J.J.R. 1999. How to estimate potentially
plant available soil nitrogen in sandy soils using
anaerobic incubation. M.S. thesis, Department of
Agricultural Sciences, The Royal Veterinary and
Agricultural University, Copenhagen, Denmark.
MacKay, D.C. and Carefoot, J.M. 1981. Control
of water content in laboratory determination of
mineralizable nitrogen in soils. Soil Sci. Soc. Am.
J. 45: 444–446.
Mulvaney, R.L., Khan, S.A., Hoeft, R.G., and
Brown, H.M. 2001. A soil organic nitrogen frac-
tion that reduces the need for nitrogen fertiliza-
tion. Soil Sci. Soc. Am. J. 65: 1164–1172.
Parfitt, R.L., Yeates, G.W., Ross, D.J.,
Mackay, A.D., and Budding, P.J. 2005. Relation-
ships between soil biota, nitrogen and phosphorus
availability, and pasture growth under organic
and conventional management. Appl. Soil Ecol.
28: 1–13.
Paul, K.I., Polglase,P.J.,O’Connell,A.M., Carlyle,
J.C., Smethurst, J.C., and Khanna, P.K. 2002. Soil
nitrogen availability predictor (SNAP): a simple
model for predicting mineralisation of nitrogen in
forest soils. Aust. J. Soil Res. 40: 1011–1026.
Paustian, K. and Bonde, T.A. 1987. Interpreting
incubation data on nitrogen mineralization from
soil organic matter. In J.H. Cooley, Ed. Soil
Organic Matter Dynamics and Soil Productivity.
Proceedings of INTECOL Workshop, INTECOL
Bulletin 15. International Association for Eco-
logy, Athens, GA, pp. 101–112.
Picone, L.I., Cabrera, M.L., and Franzluebbers,
A.J. 2002. A rapid method to estimate potentially
mineralizable nitrogen in soil. Soil Sci. Soc. Am.
J. 66: 1843–1847.
Scott, N.A., Parfitt, R.L., Ross, D.J., and Salt, G.J.
1998. Carbon and nitrogen transformations in
New Zealand plantation forest soils from sites
with different N status. Can. J. Forest Res. 28:
967–976.
Stanford, G.andSmith, S.J.1972. Nitrogen mineral-
ization potentials of soils. Soil Sci. Soc. Am.
Proc. 36: 465–472.
Stenger, R., Barkle, G.F., and Burgess, C.P. 2002.
Mineralisation of organic matter in intact versus
sieved=refilled soil cores. Aust. J. Soil Res. 40:
149–160.
Thicke, F.E., Russelle, M.P., Hesterman, O.B.,
and Sheaffer, C.C. 1993. Soil nitrogen minerali-
zation indexes and corn response in crop rota-
tions. Soil Sci. 156: 322–335.
Wang, W.J., Smith, C.J., Chalk, P.M., and Chen, D.
2001. Evaluating chemical and physical indices
of nitrogen mineralization capacity with an
unequivocal reference. Soil Sci. Soc. Am. J. 65:
368–376.
Wang, W.J., Smith, C.J., and Chen, D. 2003.
Towards a standardised procedure for determin-
ing the potentially mineralisable nitrogen of soil.
Biol. Fert. Soils 37: 362–374.
ß 2006 by Taylor & Francis Group, LLC.
Chapter 47
Physically Uncomplexed
Organic Matter
E.G. Gregorich
Agriculture and Agri-Food Canada
Ottawa, Ontario, Canada
M.H. Beare
New Zealand Institute for Crop and Food Research
Christchurch, New Zealand
47.1 INTRODUCTION
Physically uncomplexed organic matter is composed of particles of organic matter (OM) that
are not bound to soil mineral particles and can be isolated from soil by density (using heavy
liquids) or size (using sieving) fractionation. It is separated from soil on the premise that the
association of organ ic matter with primary soil (mineral) particles alters its function,
turnover, and dynamics in the soil environment. Uncomplexed organic matt er has been
isolated to study the form and function of soil organic constituents and to assess the impacts
of land use, management, and vegetation type on carbon (C) and nitrogen (N) turnover and
storage (Gregorich and Janzen 1996; Gregorich et al. 2006, and references therein). It has
been separated and evaluated in studies pertaining to nutrient availability (Campbell et al.
2001), decomposition of plant residues (Magid and Kjærgaard 2001), physical protection of
soil organic matter (Beare et al. 1994), and aggregation processe s (Golchin et al. 1994).
Physically uncomplexed organic matter is a mixture of plant, animal, and microorganism
parts at different stages of decomposition, and includes pollen, spores, seeds, invertebrate
exoskeletons, phytoliths, and charcoal (Spycher et al. 1983; Baisden et al. 2002). Light
fraction (LF) organic matter and particulate organic matter (POM) are the most commonly
isolated forms of physically uncomplexed organic matter, though they differ in amount and
their chemical characteristics. In this chapter, LF is defined as the organic matter recovered
when soil is suspended in a heavy solution (i.e., heavier than water) of a known specific
gravity, most often in the range of 1.6–2.0 (Sollins et al. 1999). In contrast, POM is defined
as the organic matter recovered after passing dispersed soil through a sieve with openings of
a defined size, normally between 250 and 53 mm in diameter. The POM has been isolated by
size alone (e.g., >53 mm), or by a combination of size and density fractionation procedures
(see Cambardella and Elliott 1992).
ß 2006 by Taylor & Francis Group, LLC.
The propor tion of total soil C and N accou nted for in physi cally uncom plexed organ ic matter
can be substant ial. Based on a revi ew of more than 65 publishe d papers, Gregor ich et al. (2006)
showed that for agricul tural mineral soils, the amoun t of soil C and N accou nted for in POM is
usually much greater than that in the LF. On average, POM (50–200 0 mm diameter) accounte d
for 22% of soil organ ic C and 18% of total soil N. In cont rast, LF organ ic matt er (specific
gravity <1.9 ) accounte d for 8% of soil organic C and 5% of total soil N. Limited work has been
done on the phospho rus (P) or sulfur (S) content of LF organic matter, but researc h has show n
that les s than 5% of soil organ ic P resides within LF (Curt in et al. 2003; Sala s et al. 2003).
The C:N ratio of physi cally uncom plexed OM is usually wider than that of whole soil, but
narrower than that of plan t residue . Th e C:N ratios of LF organ ic matt er tend to narrow
as speci fic gravity increases, ranging from 17 to 22 for specifi c gravities of 1 .0–1.8 and
from 10 to 17 for specifi c gravit ies o f 1.8–2.2 (G regorich et al. 2006). The relative ly wide
C:N ratio of LF extracted at low specific gravity ( <1.8 ) reflects the dominan t influe nce of
plant constituen ts (e.g., lignin), whe reas at a highe r specific gravit y the isolated mater ial
contains more miner al particle s with adsorbed OM. Gregor ich et al. (2006) also showed that
there is a posi tive log–li near relat ionship betwee n the mea n size of POM fractions and their
C:N ratio. In gener al, the variation in C:N ratios of larger size fractions is consi derably
greater than the variation in C:N ratios of smaller size fractions , which is consistent with the
findings of Magid and Kjæ rgaard (2001).
The LF is usual ly isolated using liquid s of a defined specific gravi ty, most oft en in the range
of 1.6–2.0 (Sollins et al. 1999). POM has been isolat ed by size alon e, or by a combina tion of
size and density fractiona tion proce dures (see Camba rdella and Ell iott 1992). We pres ent two
methods of separat ing uncom plexed organic matter in this chapter : (1) wet sie ving of soil
dispersed in a solu tion of sodium hexam etaphosph ate to isolate sand-si zed ( >53 mm) POM
and (2) suspensi on of disp ersed soil in a solution of sodium iodide (NaI) at a specific
gravity of 1.7 to isolate the LF organic matter. A size of > 53 mm is recomm ended for
separating POM becau se, as a cuto ff for the sand fraction in partic le siz e analysis, it has
been routinely used in POM studies (Gregorich et al. 2006). The 1.7 specific gravity
recommended for isolating LF is in accord with early studies that indicated that this
density separated most organomineral and mineral particles from decaying plant residues
(Ladd et al. 1977; Scheffer 1977; Ladd and Amato 1980; Spycher et al. 1983).
47.2 PARTICULATE ORGANIC MATTER
Uncomp lexed organ ic matter isolated by size is usually ref erred to as ‘‘part iculate organic
matter’’ (Cam bardella and Elliott 1992) but has also been referred to as ‘‘s and-siz e organic
matter’’ or ‘‘macroorganic matter’’ (Gregorich and Ellert 1993; Wander 2004). It is isolated
by dispersing the soil and collecting the sand-sized fraction on a sieve. Where soils are first
passed through a 2 mm sieve, the POM recovered on a 53 mm sieve can be defined as ranging
in size from 53 to 2000 mm in diameter and as such represents a quantifiable component of
the whole soil organic matter.
47.2.1 MATERIALS AND REAGENTS
1
A sieve with 2 mm openings.
2
Reciprocating or end-over-end shaker and 200–250 mL bottles or flasks with
leakproof lids.
ß 2006 by Taylor & Francis Group, LLC.
3
Sodium hexametaphosphate solution, 5 g L
À1
(NaPO
3
)
6
.
4
Sieves with 53 mm openings, 10 cm diameter (or larger), placed on top of the
polypropylene funnel (larger diameter than sieve) supported by a ring clamp on a
laboratory stand.
5
Tall-form beakers of 1 L capacity may be useful to collect the non-POM, silt þ
clay suspension that is washed through the sieve.
6
A large bottle of distilled water and a spatula or rubber policeman to ensure that
the entire silt þ clay fraction passes through the sieve.
7
Drying oven.
47.2.2 PROCEDURE
1
Pass field-moist soil through a sieve with 2 mm openings and discard any residues
retained on the sieve. Air-dry the soil.
2
Determine the soil water content by oven drying a subsample (5 g) of the soil at
1058C.
3
Weigh 25 g of air-dried soil into each bottle, dispense 100 mL of the sodium
hexametaphosphate solution into each bottle, cap the bottles, and shake overnight
(e.g., 16 h).
4
Pour the suspension onto the 53 mm sieve using small aliquots of water to rinse
the soil from the bottle.
5
Wash the silt þ clay-sized fraction, which includes mineral and fine organic
matter through the sieve using a fine jet of water from the wash bottle and gently
crushing any aggregates with a rubber policeman. The POM (i.e., sand þ large
particles of organic matter) is retained on the sieve.
6
Rapid drying can be achieved by first oven drying (%1 h at 408C) the POM directly
on the 53 mm sieves before transferring the POM to a beaker or similar container
for final oven drying at 608C overnight. Note: Place a small tray under the sieve to
catch any POM that may fall through the ope nings. Use a spatula or paintbrush
to carefully remove the POM from the sieve, taking care to recover all of the sieve
contents; record the dry weight of this material.
7
Use a mortar an d pestle to grind and homogenize the oven-dry POM to pass
through a sieve with 250 mm openings. Determine the concentrations of C, N,
and other elements of interest.
47.2.3 COMMENTS
1
Soils are usually air-dried before dispersion to remove the effects of variations in
water content. Excessive abrasion of the soil during sample preparation or disper-
sion can result in fragmentation of the larger particles of organic matter and
ß 2006 by Taylor & Francis Group, LLC.
thereby lower the recovery of POM. Agents other than sodium hexameta-
phosphate have been used to disperse the soil before wet sieving (e.g., sonication,
shaking with glass beads). In all cases, care should be taken to ensure that the
amount of energy used to disperse the soil does not affect the quantity of POM
recovered (Oorts et al. 2005).
2
POM may also be recovered by washing the sand-sized material from the
sieve into preweighed drying tins using a wash bottle, evaporating overnight,
and then oven drying at 608C. If this is done, care should be taken to ensure
that exposure of POM to water at high temperatures (during drying) for extended
periods does not alter its chemical composition (e.g., through dissolution of C or
nutrients).
3
It is generally assumed that any organic matter bound to the sand contributes
relatively little to the carbon and nutrient concentrations measured in the mater-
ial. However, where it is important to determine the dry weight of sand-free POM
or to isolate POM from sand for other analyses, the sand-sized organic matter may
be resuspended in a heavy solution to complete a further density separation of the
organic matter (e.g., Cambardella and Elliott 1992). If this is done, care should be
taken to ensure that the heavy liquid can be washed free from the POM before
further analyses are undertaken.
4
Magid and Kjærgaard (2001) advocated the fractionation of POM in studies of
residue decomposition. In these cases, it is sometimes useful to isolate different
size classes of POM by placing a nest of sieves (e.g., 1000 and 250 m m) on top of
the 53 mm sieve (Oorts et al. 2005).
47.3 LIGHT FRACTION ORGANIC MATTER
Light fraction organic matter can be isolated from much of the mineral soil by suspending
the soil in a dense liquid and allowing the heavy fraction to settle while the LF floats to the
surface. Density fractionation is based on the premi se that the lighter soil particles, com-
prising mainly of freshly added, partially decomposed, and less humified organic matter, are
more labile and reactive than heavier particles, which have variable amounts of adsorbed
humified organic matter. The LF organic matter is separated by shaking the soil in a solution
of NaI (specific gravity ¼ 1.7) and allowing the soil mineral particles to settle for 48 h before
recovering the suspended LF organic matter.
47.3.1 MATERIALS AND REAGENTS
1
A sieve with 2 mm openings.
2
Reciprocating or end-over-end shaker, plastic or glass bottles with lids and tall,
narrow beakers (at least 250 mL capacity) with rubber stoppers. The shaker action
and speed (revolutions or cycles per minute) and the flask orientation and
geometry should be recorded, as these variables may influence the degree of
soil dispersion.
3
Sodium iodide solution with a specific gravity of 1.7. Slowly add 1200 g of NaI to
1 L of water in a large beaker, while stirring and heating the solution on a
ß 2006 by Taylor & Francis Group, LLC.
magnetic mixer. After NaI is dissolved, cool the solution to room temperature and,
with a hydrometer, adjust the specific gravity of the solution to 1.7. About 90 mL
of solution, containing about 84 g of NaI, is required to separate the LF from each
25 g soil sample.
4
Aspiration unit (see Figure 47.1) consisting of a vacuum hose with a disposable
pipette tip cut at a 458 angle to aspirate the LF; a fritted glas s filter support;
a detachable funnel; a clamp to attach the funnel to the top of the flask and
two large (1 L) sidearm flasks, one to collect the dense solution for reuse and
the other to collect water washings for discard. Membrane filters (e.g., 0.45 mm
Millipore filters) made of nylon or ‘‘quantitative’’ filters designed for easy
recovery of the LF on the filter may be used without contaminating the LF with
filter-derived C.
5
Three wash bottles, one containing the NaI solution (specific gravity ¼ 1.7), one
containing 0.01 M CaCl
2
, and one containing distilled water.
47.3.2 PROCEDURE
1
Pass field-moist soil through a sieve with 2 mm openings and discard any residues
retained on the sieve. Air-dry the soil.
2
Determine the soil water content by oven drying a subsample (5 g) of the soil at 1058C.
3
Weigh 25 g of soil into each bottle; dispense 50 mL of the NaI solution into each
bottle; cap the bottle and shake on a reciprocating shaker for 60 min. Longer
shaking times may be required when less vigorous shaking is used.
To vacuum
To vacuum
Sidearm flask
Glass fiber filter
Tygon hose
Light fraction
FIGURE 47.1. Vacuum filtration unit with a sidearm flask used to isolate light fraction organic
matter.
ß 2006 by Taylor & Francis Group, LLC.