Nanomaterials for Nanoscience and Nanotechnology part 11 pdf
Bạn đang xem bản rút gọn của tài liệu. Xem và tải ngay bản đầy đủ của tài liệu tại đây (160.59 KB, 12 trang )
Surface compositional analysis of individual nanoparticles is essential for under-
standing the activity and selectivity of industrial bimetallic or multi-component cata-
lysts used in a variety of chemical reactions. The overall composition of these individ-
ual nanoparticles can usually be obtained by the use of high spatial resolution XEDS
(see section 4.7). It is, however, extremely difficult to extract information about pref-
erential surface segregation or aggregation of individual components in nanoparticles
of different sizes. Because of the high-surface sensitivity of Auger electrons, it is possi-
ble to determine qualitatively and, in some cases, quantitatively, the surface composi-
tion of nanoparticles consisting of multiple components. Figure 4-31b shows an Auger
electron spectrum obtained from a sample containing palladium, silver, or palladium-
silver nanoparticles highly dispersed on a high-surface area support. Both the silver
and the palladium MNN Auger peaks are clearly revealed. Quantitative analyses of
this type of spectrum can provide information about the surface enrichment of specific
elements and information about how this enrichment varies with the size of the parti-
cles.
4.6.2 High spatial resolution scanning Auger microscopy
Considerable efforts have been devoted to the development of scanning Auger mi-
croscopy (SAM) and the improvement of its imaging resolution since the pioneering
work of MacDonald and Waldrop [122]. The driving force for developing high spatial
resolution SAM is related to the characterization of nanoparticles and other nano-
structured materials. The best resolution of SAM images obtained in conventional
SEM geometry is approximately 30 nm under favorable conditions [123±124]. A spa-
tial resolution of about 10 nm can be achieved using the high current density and the
small probes of STEM instruments [125]. A similar or better image resolution may
also be achievable in the new generation of field-emission SEM instruments. Further
improvement in resolution by using smaller electron probes significantly reduces the
strength of the collected Auger signal.
With the improvement in the detection efficiency of low-energy electrons in the
MIDAS system by employing magnetic ªparallelizersº [100], a spatial resolution of <
3 nm in Auger peak images can be obtained on bulk samples [120]. For electron trans-
parent specimens, typically used in STEM instruments, an image resolution < 1 nm
can be achieved [121]. Silver nanoparticles < 1 nm in diameter and containing as few
as 15 silver atoms can be detected [119, 121].
Metal nanoparticles highly dispersed on supporting materials represent a significant
fraction of heterogeneous catalyst systems. Surface chemical information about such
systems can be obtained by collecting Auger electrons to form high spatial resolution,
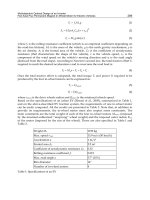
elementally specific, and surface sensitive images. Figure 4-32 shows a set of images of
a model catalyst consisting of clean silver nanoparticles deposited onto a thin carbon
film. Both the silver nanoparticles and the surface details of the support are revealed
in the SE image. However, the nano-scale pore structure of the carbon film is clearly
revealed in the C KLL Auger peak image with high contrast. The high intensity of the
silver particles in the C KLL Auger peak image could occur due to electron scattering
processes or because of the high SE background from the silver nanoparticles [121].
The silver nanoparticles are shown with very high contrast in the silver MNN Auger
peak image. The silver Auger map, obtained by subtracting the background image
from the silver MNN Auger peak image, shows silver clusters as small as 1±2 nm in
diameter. The average background pixel value in the silver Auger map is < 3 while the
Scanning Transmission Electron Microscopy of Nanoparticles 121
smallest silver particles have a pixel value of about 30 at the center of the particle
(indicated by the arrow in the silver Auger map). Larger particles have pixel values of
about 340 at the center of the particles. Further particle analyses can be performed on
this type of ªcleanº image, yielding information about the size distribution and the
composition of the particles. The intensity variations of Auger signals with the sizes of
silver nanoparticles can also be investigated.
The digitally acquired Auger peak and background signal images contain quantita-
tive data on the Auger peak height and SE background intensity. Data sets obtained
by processing the digital images contain quantitative information about the contrast
of the Auger peak and background signal images [121].
The topographic contrast in SAM images of bulk samples can be, in general, mini-
mized by using the algorithm (P±B)/(P+B). Here P represents the signal at the Auger
peak and B represents a background signal taken at an energy level just above the
Auger peak [126]. Despite the successful use of this algorithm in low resolution SAM
images, it cannot be directly applied to nanometer-resolution SAM images. In fact,
the (P±B)/(P+B) or (P±B)/B display only enhances the edge contrast since the escape
depth of the background signal is much greater than the attenuation length of the
Auger electrons [121, 127]. For nanometer-resolution SAM images, the P±B display
may best represent the elemental map of the sample surface.
122 Liu
Figure 4-32. A set of images of silver nanoparticles supported on a carbon film: SE image; carbon KLL
Auger peak image; silver MNN Auger peak image; and silver Auger map obtained by subtracting a
background image from the silver MNN Auger peak image.
4.6.3 Resolution limit
The resolution in SAM images depends on several sample- and instrument-related
effects. The sample-related effects include: 1) surface topography, 2) escape depth of
the collected Auger electrons, 3) contribution from backscattered electrons, and 4)
localization of the Auger electron production processes. The last factor sets the ulti-
mate resolution limit that will be achievable in SAM images. Since the primary inelas-
tic scattering processes involve excitation of inner-shell electrons, the generation of
Auger electrons is highly localized. With thin specimens and high-energy incident
electrons, the contribution from backscattered electrons should be negligible. It may,
however, degrade the image resolution and affect the image contrast of bulk samples.
The instrument-related effects include: 1) the intensity distribution of high-energy
electron probes, 2) the collection efficiency of the emitted Auger electrons, and 3) the
instability of the STEM microscopes. The capabilities and limitations of high spatial
resolution AES and SAM are discussed in a recent review article [128]. At present,
the instrument-related factors set the limits of obtainable resolution to about 1 nm in
Auger peak images of thin specimens [121].
4.6.4 Detection sensitivity
Because the Auger electron intensity profile of a particle is a complicated convolu-
tion of the electron probe with the real morphology of the particle, the true size of the
particle may be smaller than that measured in a SAM image. A de-convolution pro-
cess might be used to extract the real sizes of the observed nanoparticles. However,
knowledge of the intensity distribution of the probe, the radial and angular distribu-
tions of the emitted Auger electrons, and the detailed transmission function of the
electron analyzer would have to be known.
The emission of Auger electrons from small particles is different from that of flat
surfaces. Electrons generated inside a small particle may all escape if the radius of the
particle is much smaller than the inelastic mean free path (l) of the collected Auger
electrons. In this limit, the total number of the collected Auger electrons is propor-
tional to the volume of the particle; and the distinction between ªbulkº and surface
signals is no longer valid. A quantitative estimate of the minimum particle size detect-
able in SAM images can be developed from a simple relationship between the signal
strength and the size of the particle. By using an intensity-ratio method, it is possible
to estimate the total number of atoms detectable in high spatial resolution Auger
maps [119].
The total integrated signal strength of a small particle, in the absence of image
noise, should be independent of the size of the incident electron probes. The inte-
grated intensity (I) of a particle in SAM images is proportional to the total number of
atoms (N) which contribute to the collected Auger signal, I = aN. The parameter a is
dependent on the Auger electron cross-section, detection efficiency, incident beam
current, and other instrument-related parameters. However, for each SAM image a
can reasonably be assumed a constant.
Thus, the number of atoms contained in a small particle N
1
with an integrated
intensity I
1
can be estimated from a large particle with N
2
atoms and an integrated
intensity I
2
: N
1
= N
2
(I
1
/I
2
). This relationship indicates that a large particle could be
used as an internal calibration standard to determine the total number of atoms con-
tained in smaller particles. On this basis, it is estimated that particles containing as few
Scanning Transmission Electron Microscopy of Nanoparticles 123
as 15 silver atoms can be detected in high-resolution SAM images (see Fig. 4-32). At
present, the minimum detectable mass in high spatial resolution SAM images is less
than 3Â10
±21
g [119].
The minimum detectable dimension is different from the resolution of SAM images
[128±129]. While the latter is currently limited by the sizes of the incident electron
probe, the former is related to, but not limited by, the dimension of the incident elec-
tron probe. The minimum detectable size can be much smaller than the incident probe
diameter. The minimum particle size detectable in a SAM image is directly related to
the signal-to-noise and signal-to-background ratios, as well as the radiation damage of
the sample. For example, the minimum detectable dimension would be the size of a
single atom if the signal strength were not a limiting factor, and that the atom were
stable under intense electron beam irradiation.
4.7 Nanoanalysis with energy-loss electrons and X-rays
The remarkable capability of forming an electron probe with sub-nanometer sizes
in STEM instruments makes it practical to perform chemical analysis with a nano-
meter or sub-nanometer resolution. When high-energy incident electrons interact
with a specimen, a variety of signals are generated from within the interaction volume
(see Fig. 4-1). Some of these signals such as characteristic X-ray photons, energy-loss
electrons, Auger electrons, and light photons, carry information about the composition
or the chemistry of the sample. These analytical signals can be collected and analyzed
by appropriate spectrometers to give useful information about the sample.
Unlike microscopy that records the location and distribution of atoms, particles,
and phases, spectroscopy is concerned with the measurement of energies or wave-
lengths of the collected analytical signals. We can transform various spectra into useful
data that give information about elemental composition or distribution of different
phases in the sample at a nanometer and, in some cases, an atomic resolution. Among
these spectroscopic techniques, XEDS and EELS are the two most frequently used
analytical techniques in STEM instruments.
EELS is the analysis of the energy distribution of high-energy incident electrons
that have been inelastically scattered by the specimen. These inelastically scattered
electrons carry important information about the electronic structure of the specimen
atoms. Thus, EELS spectra contain essential details of the nature of these atoms, their
bonding and nearest-neighbor coordination, charge transfer, and dielectric response
(see Chapter 3 for detailed discussions).
XEDS is the analysis of the energy distribution of emitted characteristic X-ray
photons, which are related to the excitation of inner-shell electrons of the specimen
atoms (Fig. 4-30). The dependence of the emitted characteristic X-rays on the nature
of the excited atoms present in a sample provides the basis of nanoanalysis by XEDS.
The fundamental principles of XEDS and EELS have been discussed in many text-
books [9, 92, 130±132]. We discuss here only those features that are unique to STEM
configurations.
124 Liu
4.7.1 Electron energy-loss spectroscopy
By performing parallel EELS (PEELS) in conjunction with the HAADF imaging
technique in STEM, detailed information about the composition, chemistry, and struc-
ture of the specimen can be obtained with atomic resolution and sensitivity. This strat-
egy has recently been applied to the study of a variety of materials problems with
great success [133±140]. For example, in the study of iron nanoparticles used as a fuel
additive to reduce or enhance soot formation during combustion, PEELS gave infor-
mation about the spatial variation of the oxidation states of iron species within indi-
vidual nanoparticles 141]. This type of information is extremely important for under-
standing the role of nanoparticles during catalytic reactions.
Electron energy-loss images, formed by selecting characteristic energy-loss peaks in
EELS spectra as input signals, provide information about the spatial distribution of ele-
ments or electronic and oxidation states in the specimen [135, 142±143]. For example,
energy-loss electrons were used to obtain maps of sp
2
and sp
3
states of carbon at sub-
nanometer spatial resolution across the silicon-diamond interface [135]. By analyzing
the electron energy-loss images, it was concluded that diamond nucleates on an amor-
phous carbon layer, with the transition from sp
2
to sp
3
carbon occurring over a distance
less than 1 nm. This type of valuable information can only be obtained by using a high-
brightness, sub-nanometer electron probe available in STEM instruments.
A recent development in quantitative EELS mapping is the spectrum-imaging tech-
nique: acquire and store a spectrum at each pixel in a two-dimensional image [142±
144]. A spectrum-image in its most common form is similar to a normal STEM image;
but a spectrum-image contains an entire spectrum at each pixel. A spectrum-image
can be viewed as a three±dimensional image with two spatial coordinates and one
energy coordinate. One of the greatest advantages of the spectrum-image technique is
that it can be processed a posterior, thus, offering access to the exact relationship
between the spatial coordinates and the spectral feature. Elements in unexpected
locations may be found by off-line processing the digitally stored spectra. The major
limitations of this technique include acquisition and manipulation of a tremendous
amount of spectral data and the time-consuming process of analyzing millions of spec-
tra for each sample. Quantitative EELS imaging is, however, a powerful method for
spatial interpretation of elemental, chemical, and other important information related
to the physical properties of nanophase materials.
Another unique application of ELLS in STEM is the study of valence excitation
processes of high-energy electrons passing through a thin film or a small particle, or
passing close to a surface or interface of a solid material [145±149]. Surface or bulk
plasmon excitations, inter-band or intra-band single-electron transitions, and defect-
induced electronic states can be investigated with a sub-nanometer spatial resolution
(see Chapter 3 for detailed discussion on the excitation processes).
EELS technique is ideal for analysis of low atomic-number materials of thin speci-
mens. When a specimen is thicker, plural and multiple inelastic scattering may
become dominant and thus obscure the characteristic features of the EELS spectra.
4.7.2 X-ray energy-dispersive spectroscopy
XEDS is now routinely used, in TEM, SEM, or STEM instruments, to identify
unknown phases or to obtain information about the spatial distribution of certain
phases of interest. In a STEM instrument, XEDS can be conveniently used to analyze
Scanning Transmission Electron Microscopy of Nanoparticles 125
the features revealed in HAADF images by stopping the incident probe at any point
of interest. For thin specimens, qualitative interpretation of XEDS spectra can be per-
formed on-line.
A consequence of high spatial resolution in STEM is that the X-ray signal origi-
nates from a much smaller volume of the specimen; a weaker signal means long acqui-
sition time in order to obtain statistically meaningful results. Therefore, specimen-drift
correction, either manually or automatically, is usually used to collect enough X-ray
signals when very small particles are analyzed. Nevertheless, XEDS can detect the
presence of just a few atoms if the analyzed volume is small enough [150].
XEDS technique has been widely used to solve materials problems including iden-
tifying precipitates in alloys, active phases in supported catalysts, elemental segrega-
tion at grain boundaries, and quantitative composition of multi-component phases.
126 Liu
Figure 4-33. Nanoanalysis of a colloidal Pr
0.5
Tb
0.5
O
x
nanoparticle. The XEDS spectra were obtained
from the corresponding locations labeled in the HAADF image.
The combination of qualitative XEDS with HAADF imaging technique is now routi-
nely used in STEM instruments for fast analysis of unknown phases and the spatial
distribution of these phases.
In the study of in situ decomposition of hydroxycarbonate (Pr
0.5
Tb
0.5
OHCO
3
) col-
loidal nanoparticles, it is necessary to understand the chemical homogeneity of the
decomposition products within individual nanoparticles. Figure 4-33a shows a
HAADF image of one of these nanoparticles after approximately 20 minutes intense
electron beam irradiation. To determine the variations in elemental composition
across the small particle, a series of XEDS spectra were obtained at different probe
positions (Fig. 4-33b). By quantitatively analyzing the XEDS spectra obtained from
different particles and comparing these nanoanalytical results with those of HRTEM,
a model of the decomposition process and the structure of the final decomposition
product were proposed [151].
Similar to EELS mapping, X-ray maps can provide valuable information about
two-dimensional elemental distributions in the sample. Particles as small as 2 nm in
diameter can be detected in digitally acquired X-ray maps [152]. The ultimate limita-
tion for X-ray mapping of nanoparticles is the extremely low X-ray signal strength al-
though high-brightness field-emission guns are used. The conditions for optimum X-
ray mapping include: 1) high beam current with small probe size, 2) high X-ray collec-
tion efficiency, and 3) long acquisition times per pixel with specimen-drift correction.
4.7.3 Comparison of nanoanalysis by EELS and XEDS
Both EELS and XEDS are important analytical techniques available in STEM
instruments. These two techniques are complementary to each other. EELS is prefer-
able for analysis of light-elements of thin specimens with a sub-nanometer or atomic
resolution; XEDS is mostly used for identifying, and determining the composition of,
unknown phases composed of heavy-elements. Furthermore, EELS can provide useful
information other than just the composition of the sample. Although EELS has a
much higher sensitivity than XEDS has for detecting light-elements [153], little useful
information can be extracted in the acquired EELS spectra unless the specimen is
very thin. Because of the complexity of the experimental procedures and because of
the large number of variables related to the acquisition and the subsequent analysis,
EELS, however, is not as widely used as XEDS in solving industrial problems.
Qualitative analysis of both XEDS and EELS spectra can be performed on-line.
Quantification of these spectra, however, is not straightforward, especially for analysis
of nanoparticles. Low signal-to-noise ratio often poses a severe problem for quantita-
tive analysis of XEDS spectra while low peak-to-background ratio in EELS spectra
presents difficulties for quantification.
The achievable resolution in XEDS is limited by the size of the incident probe, the
spreading of the propagating probe, the signal-to-noise ratio in the spectra, the speci-
men drift, and the electron beam damage of the sample [154]. The achievable res-
olution in EELS is limited by the size of the incident probe, the delocalization of the
primary excitation processes, the signal-to-background ratio, instrument stability, and
electron beam damage of the sample [155]. Under highly favorable conditions, single
atoms can be detected in EELS spectra [156]. With special precautions and under
optimized conditions, about 10 atoms can be detected in XEDS spectra [150].
Scanning Transmission Electron Microscopy of Nanoparticles 127
4.8 Summary
STEM can be used in various forms to provide useful information about nanopar-
ticles or nanoparticle systems. Surface morphology of the sample can be examined on
a nanometer scale by collecting secondary electrons. Nanoparticles can be identified
128 Liu
Figure 4-34. Nanoanalysis of Fe
X
Ag
1±X
giant magnetoresistance films. HAADF images clearly show two
phases with distinctive contrast. Nanodiffraction patterns show that some of the small particles have an
icosahedral shape (c) and the matrix film is highly disordered (d). XEDS spectra (e) and (f) were
obtained from the small particle (indicated by the arrow in (b)) and the matrix film (the region inside the
circle in (b)), respectively. The XEDS spectra show that there is a complete phase separation in the
Fe
X
Ag
1±X
film, and the bright particles are silver and the highly disordered matrix consists of only Fe.
in images formed by collecting high-angle scattered electrons; and thus, the spatial
and the size distributions of nanoparticles can be obtained. Nanodiffraction patterns,
formed by positioning an electron nanoprobe at the area of interest, can provide crys-
tallographic information about nanoparticles and their supports. XEDS and EELS
can be used to give complementary information about the composition, electronic
structure, and state of oxidation of nanoparticles as well as their supports. Elementally
specific and surface sensitive techniques such as AES and SAM can be used to extract
information about surface chemistry of nanoparticles or other nano-structured materi-
als.
The combination of all these high spatial resolution imaging, diffraction, and analy-
tical techniques in a single microscope makes the STEM the most powerful tool for
characterizing nanoparticles (see Figs. 4-4 and 4-22). For example, in the study of giant
magnetoresistance (GMR) in granular Fe
X
Ag
100±X
magnetic films, it was found that
the GMR is sensitive to the Fe volume fraction, and the size distribution and the
inter-particle distances of the ferromagnetic particles. STEM and associated tech-
niques were used to characterize the nano-structure of the magnetic granular films.
Figure 4-34 summarizes the major results of the STEM analysis [72]. Based on these
results preliminary models of the observed GMR of granular Ag-Fe magnetic films
were proposed [157].
With the recent development of electron nanoprobes with a size < 0.2 nm in com-
mercially available 200 kV field-emission TEM instruments, the unique STEM cap-
abilities described in this chapter will soon be available to most researchers. STEM
and its associated techniques will become more widespread and useful in solving
materials problems in the 21
st
century.
Acknowledgements
The author is deeply grateful to many collaborators and friends for valuable and
insightful discussions on characterization of nanoparticles. The author wishes to
express his gratitude to Drs. J. M. Cowley, P. A. Crozier, G. E. Spinnler, J. R. Ebner, J.
A. Venables, G. G. Hembree, M. Pan, and Z. L. Wang for giving advice and encour-
agement.
References
[1] J. M. Cowley, Appl. Phys. Lett. 1969, 15, 58.
[2] E. Zeitler, M. G. R. Thomson, Optik 1970, 31, 258, 359.
[3] J. M. Cowley, Diffraction Physics,2
nd
ed., New York, North-Holland, 1981.
[4] J. M. Cowley, Ultramicroscopy 1993, 49,4.
[5] J. Konnert, P. D'Antonio, J. M. Cowley, A. Higgs, H. J. Ou, Ultramicroscopy 1989, 30, 371.
[6] J. M. Rodenburg, R. H. T. Bates, Philos. Trans. R. Soc. Lond. 1992, A339, 521.
[7] J. M. Rodenburg, B. C. McCallum, P. D. Nellist, Ultramicroscopy 1993, 48, 304.
[8] J. C. H. Spence, J. M. Cowley, Optik 1978, 50,129.
[9] L. Reimer, Energy-Filtering Transmission Electron Microscopy, New York, Springer, 1995.
[10] M. Mitome, K. Takayanagi, Y. Tanishiro, Ultramicroscopy 1990, 33, 255.
[11] C. Mory, C. Colliex, J. M. Cowley, Ultramicroscopy 1987, 21, 171.
[12] A. V. Crewe, J. Wall, J. Langmore, Science 1970 168,1338.
[13] A. V. Crewe, J. Wall, J. Mol. Biol. 1970, 48, 373.
[14] A. V. Crewe, Rep. Progr. Phys. 1980, 43, 621.
[15] M. Isaacson, D. Kopf, M. Utlaut, N. W. Parker, A. V. Crewe, Proc. Natl. Acad. Sci., 1977, 74,
1802.
Scanning Transmission Electron Microscopy of Nanoparticles 129
[16] M. Isaacson, D. Kopf, M. Ohtsuki, M. Utlaut, Ultramicroscopy 1979, 4, 101.
[17] M. Ohtsuki, Ultramicroscopy 1980, 5, 325.
[18] A. Howie, J. Microscopy 1979, 117, 11.
[19] M. M. J. Treacy, A. Howie, C. J. Wilson, Philos. Mag. 1978, A38, 569.
[20] M. M. J. Treacy, S. B. Rice, J. Microsc. 1989, 156, 211.
[21] J. Liu, J. M. Cowley, Ultramicroscopy 1990, 34, 119.
[22] S. B. Rice, J. Y. Koo, M. M. Disco, M. M. J. Treacy, Ultramicroscopy 1990, 34, 108.
[23] S. A. Bradley, M. J. Cohn, S. J. Pennycook, Microsc. Res. Tech. 1994, 28, 427.
[24] P. D. Nellist, S, J, Pennycook, Science 1996, 274, 413.
[25] K. J. Hanssen, G. Ade, Optik 1976, 44, 237.
[26] H. Rose, Ultramicroscopy 1977, 2, 251.
[27] J. Silcox, P. Xu, R. F. Loane, Ultramicroscopy 1992, 47, 173.
[28] S. J. Pennycook, L. A. Boatner, Nature 1988, 336, 565.
[29] D. H. Shin, E. J. Kirkland, J. Silcox, Appl. Phys. Lett. 1989, 55, 2456.
[30] P. Xu, E. J. Kirkland, J. Silcox, R. Keyse, Ultramicroscopy 1990, 32, 93.
[31] D. E. Jesson, S. J. Pennycook, S. J. Baribeau, Phys. Rev. Lett. 1991, 66, 750.
[32] J. Liu, J. M. Cowley, Ultramicroscopy 1993, 52, 335.
[33] A. J. McGibbon, S. J. Pennycook, J. E. Angelo, Science 1995, 269, 519.
[34] S. J. Pennycook, D. E. Jesson, A. J. McGibbon, P. D. Nellist, J. Electron Microsc. 1996, 45, 36.
[35] S. J. Pennycook, D. E. Jesson, Phys. Rev. Lett. 1990, 64, 938.
[36] S. J. Pennycook, D. E. Jesson, Ultramicroscopy 1991, 37, 14.
[37] R. F. Loane, P. Xu, J. Silcox, Acta Crystallogr. 1991, A47, 267.
[38] S. Hillyard, R. F. Loane, J. Silcox, Ultramicroscopy 1993, 49, 14.
[39] S. Hillyard, J. Silcox, Ultramicroscopy 1993, 52, 325.
[40] Z. L. Wang, J. M. Cowley, Ultramicroscopy 1989, 31, 437.
[41] Z. L. Wang, J. M. Cowley, Ultramicroscopy 1990, 32, 275.
[42] M. M. J. Treacy, J. M. Gibson, Ultramicroscopy 1993, 52, 31.
[43] D. E. Jesson, S. J. Pennycook, Proc. R. Soc. Lond. 1993, A441, 261.
[44] J. Fertig, H. Rose, Optik 1981, 59, 407.
[45] R. F. Loane, E. J. Kirkland, J. Silcox, Acta Crystallogr. 1988, A44, 912.
[46] J. M. Zuo, J. C. H. Spence, Philos. Mag. 1993, A68, 1055.
[47] J. Broeckx, M. Op de Beeck, D. Van Dyck, Ultramicroscopy 1995, 60, 71.
[48] J. T. Fourie, Optik 1994, 95, 128.
[49] J. M. Cowley, J. C. H. Spence, V. V. Smirnov, Ultramicroscopy 1997, 68, 135.
[50] J. K. Weiss, R. W. Carpenter, A. A. Higgs, Ultramicroscopy 1991, 36, 319.
[51] J. O. Malm, M. A. O'Keefe, Ultramicroscopy 1997, 68, 13.
[52] J. Liu, J. M. Cowley, Ultramicroscopy 1991, 37, 50.
[53] J. M. Cowley, Ultramicroscopy 1993, 49,4.
[54] J. M. Cowley, M. S. Hansen, S. Y. Wang, Ultramicroscopy 1995, 58, 18.
[55] J. M. Cowley, V. I. Merkulov, J. S. Lannin, Ultramicroscopy 1996, 65, 61.
[56] N. H. Dekkers, H. de Lang, Optik 1974, 41, 452.
[57] L. H. Veneklasen, Optik 1975, 44, 447.
[58] J. M. Chapman, P. E. Batson, E. M. Waddell, R. P. Ferrier, Ultramicroscopy 1978, 3, 203.
[59] I. R. McFayden, J. M. Chapman, Electron Microsc. Soc. Amer. Bull. 1992, 22, 64.
[60] R. Darji, A. Howie, Micron 1997, 28, 95.
[61] J. M. Cowley, J. Electron Microsc. Tech. 1986, 3, 25.
[62] J. C. H. Spence, J. M. Zuo, Electron Microdiffraction, New York, Plenum Press, 1992.
[63] M. Pan, J. M. Cowley, Ultramicroscopy 1988, 26, 205.
[64] J. M. Cowley, J. C. H. Spence, Ultramicroscopy 1981, 6, 359.
[65] J. Zhu, J. M. Cowley, Acta Cryst. 1982, A38, 718.
[66] J. M. Cowley, R. A. Roy, Scanning Electron Microsc. 1981, 143.
[67] A. Howie, L. D. Marks, S. J. Pennycook, Ultramicroscopy 1982, 8, 163.
[68] M. Pan, J. M. Cowley, I. Y. Chan, J. Appl. Cryst. 1987, 20, 300.
[69] J. M. Cowley, R. J. Plano, J. Catal. 1987, 108, 199.
[70] J. M. Cowley, P. Nikolaev, A. Thess, R. E. Smalley, Chem. Phys. Lett. 1997, 265, 379.
[71] J. Zhu, J. M. Cowley, Ultramicroscopy 1985, 18, 419.
[72] J. Liu, Z. G. Li, H. Wan, A. Tsoukatos, G. C. Hadjipanayis, Mat. Res. Soc. Symp. Proc. 1994, 332,
303.
[73] M. Pan, J. M. Cowley, J. C. Berry, Ultramicroscopy 1989, 30, 385.
[74] J. G. Allpress, J. V. Sanders, Surf. Sci. 1967, 7,1.
[75] M. J. Yacaman, K. Heinemann, C. Y. Yang, H. Poppa, J. Cryst. Growth 1979, 47, 187.
[76] M. J. Yacaman, M. A. Borja, Catal. Rev Sci. Eng. 1992, 34, 55.
130 Liu
[77] S. Iijima, T. Ichahasi, Phys. Rev. Lett. 1986, 50, 616.
[78] J. M. Cowley, J. C. H. Spence, Ultramicroscopy 1979, 3, 433.
[79] J. M. Cowley, M. A, Osman, P. Humble, Ultramicroscopy 1984, 15, 311.
[80] H. J. Ou, A. A. Higgs, J. M. Cowley, Mater. Res. Soc. Symp. Proc. 1989, 139, 223.
[81] J. M. Cowley, Ultramicroscopy 1979, 4, 413.
[82] K. Tsuda, M. Tanaka, J. Electron Microsc. 1996, 45, 59.
[83] W. J. Vine, R. Vincent, P. Spellward, J. W. Steeds, Ultramicroscopy 1992, 41, 423.
[84] S. Yamada, M. Tanaka, J. Electron Microsc. 1995, 44, 213.
[85] J. A. Lin, J. M. Cowley, Ultramicroscopy 1986, 19, 31.
[86] V. Ronchi, Appl. Optics 1964, 3, 437.
[87] D. Gabor, Nature 1948, 161, 777.
[88] D. Gabor, Proc. R. Soc. Lond. 1949, A197, 454.
[89] J. A. Lin, J. M. Cowley, Ultramicroscopy 1986, 19, 179.
[90] M. Mankos, M. R. Scheinfein, J. M. Cowley, J. Appl. Phys. 1994, 75, 7418.
[91] M. Mankos, P. de Haan, V. Kambersky, G. Matteucci, M. R. McCartney, Z. Yang, M. R. Schein-
fein, J. M. Cowley in Electron Holography (Eds.: A. Tonomura, L. F. Allard, G. Pozzi, D. C. Joy,
Y. A. Ono), New York, Elsevier Science B. V. 1995, p329.
[92] R. F. Egerton, Electron Energy-Loss Spectroscopy in the Electron Microscope,2
nd
ed., New York,
Plenum Press, 1996.
[93] L. Reimer, Scanning Electron Microscopy, Berlin, Springer, 1985.
[94] D. C. Joy, J. Microscopy 1987, 147, 51.
[95] M. S. Chung, T. E. Everhart, Phys. Rev. 1977, B15, 4699.
[96] M. Rosler, W. Brauer, Phys. Status Solidi 1981, B104, 161.
[97] R. Bindi, H. Lantari, P. Rostaing, J. Phys. 1980, D13, 461.
[98] M. Rosler, W. Brauer, Phys. Status Solidi 1988, B148, 213.
[99] J. Schou, Scanning Microscopy 1988, 2, 607.
[100] P. Kruit, J. A. Venables, Ultramicroscopy 1988, 25, 183.
[101] G. G. Hembree, P. A. Crozier, J. S. Drucker, M. Krishnamurthy, J. A. Venables, J. M. Cowley,
Ultramicroscopy 1989, 31, 111.
[102] H. Seiler, Scanning Microscopy 1988, 2, 1885.
[103] J. A. Venables, G. D. T. Spiller, D. J. Fathers, C. J. Harland, M. Hambucken, Ultramicroscopy
1983, 11, 149.
[104] A. L. Bleloch, A. Howie, R. H. Milne, Ultramicroscopy 1989, 31, 99.
[105] J. Liu, J. M. Cowley, Ultramicroscopy 1993, 52, 335.
[106] A. Howie, J. Microsc. 1995, 180, 192.
[107] D. Imeson, R. H. Milne, S. D. Berger, D. McMullan, Ultramicroscopy 1985, 17, 243.
[108] A. Howie, R. H. Milne, Ultramicroscopy 1985, 18, 427.
[109] J. Liu, J. M. Cowley, Ultramicroscopy 1987, 23, 463.
[110] T. Nagatani, S. Saito, Scanning Microscopy Suppl. 1987, 1, 901.
[111] J. Liu, J. M. Cowley, Scanning Microscopy 1988, 2, 65.
[112] J. Liu, J. M. Cowley, Scanning Microscopy 1988, 2, 1957.
[113] J. Drucker, M. R. Scheinfein, J. Liu, J. K. Weiss, J. Appl. Phys. 1993, 74, 7329.
[114] H. Seiler, J. Appl. Phys. 1983, 54, R1.
[115] D. C. Joy, J. P. Pawley, Ultramicroscopy 1992, 47, 80.
[116] D. C. Joy, C. S. Joy, Micron 1996, 27, 247.
[117] D. Briggs, J. C. Riviere in Practical Surface Analysis: Auger and X-ray Photoelectron Spectroscopy
(Eds.: D. Briggs, M. P. Seah), 2
nd
ed., New York, John Wiley & Sons, 1990, Chapter 3.
[118] M. P. Seah, W. A. Dench, Surf. Interface Anal. 1979, 1,2.
[119] J. Liu, G. Hembree, G. Spinnler, J. Venables, Surf. Sci. 1992, 256, L111; Catal. Lett. 1992, 15, 133.
[120] G. G. Hembree, J. A. Venables, Ultramicroscopy 1992, 47, 109.
[121] J. Liu, G. G. Hembree, G. E. Spinnler, J. A. Venables, Ultramicroscopy 1993, 52, 369.
[122] N. C. MacDonald, J. R. Waldrop, Appl. Phys. Lett. 1971, 19, 315.
[123] A. P. Janssen, J. A. Venables, Surf. Sci. 1978, 77, 351.
[124] M. M. El Gomati, A. P. Janssen, M. Prutton, J. A. Venables, Surf. Sci. 1979, 85, 309.
[125] J. Cazaux, J. Chazelas, M. N. Charasse, J. P. Hirtz, Ultramicroscopy 1988, 25, 31.
[126] C. J. Harland, J. A. Venables, Ultramicroscopy 1985, 17,9.
[127] J. Ferron, E. C. Goldberg, Surf. Sci. 1992, 275, 114.
[128] J. Cazaux, J. Surf. Anal. 1997, 2, 286.
[129] J. Cazaux, Surf. Interface Anal. 1989, 14, 354.
[130] D. B. Williams, G. I. Goldstein, D. E. Newbury (Eds.), X-ray Spectrometry in Electron Beam
Instruments, New York, Plenum Press, 1995.
Scanning Transmission Electron Microscopy of Nanoparticles 131
[131] M. M. Disko, C. C. Ahn, B. Fultz (Eds.), Transmission Electron Energy-Loss Spectrometry in
Materials Science, Pennsylvania, TMS, Warrendale, 1992.
[132] J. J. Hren, J. I. Goldstein, D. C. Joy (Eds.), Introduction to Analytical Electron Microscopy, New
York, Plenum Press, 1979.
[133] N. D. Browining, M. F. Chisholm, S. J. Pennycook, Nature 1993, 366, 143.
[134] S. J. Pennycook, N. D. Browning, D. E. Jesson, M. F. Chisholm, A. J. McGibbson, Appl. Phys.
1993, A57, 385.
[135] D. A. Muller, Y. Tzou, R. Raj, J. Silcox, Nature 1993, 366, 725.
[136] N. D. Browining, S. J. Pennycook, J. Microsc. 1995, 180, 230.
[137] P. E. Batson, J. Electron Microsc. 1996, 45,51
[138] C. Colliex, J. Electron Microsc. 1996, 45, 44.
[139] D. A. Muller, D. A. Shashkov, R. Benedek, L. H. Yang, J. Silcox, D. N. Seidman, Phys. Rev. Lett.
1998, 80, 4741.
[140] G. Duscher, N. D. Browning, S. J. Pennycook, Phys. Status Solidi 1998, A166, 327.
[141] D. J. Wallis, N. D. Browning, C. M. Megaridis, P. D. Nellist, J. Microsc. 1996, 184, 185.
[142] J. A. Hunt, D. B. Williams, Ultramicroscopy 1991, 38, 47.
[143] S. Q. Sun, S. L. Shi, J. A. Hunt, R. D. Leapman, J. Microsc. 1995, 177, 18.
[144] C. Jeanguillaume, C. Colliex, Ultramicroscopy 1989, 28, 252.
[145] A. Howie, Ultramicroscopy 1983, 11, 141.
[146] R. Garcia-Molina, A. Gras-Marti, A. Howie, R. H. Ritchie, J. Phys. C: Solid State Phys. 1985, 18,
5335.
[147] R. H. Richie, A. Howie, Philos. Mag. 1988, A58, 753.
[148] Z. L. Wang, J. M. Cowley, Ultramicroscopy 1987, 21, 77, 335.
[149] M. G. Walls, A. Howie, Ultramicroscopy 1989, 28, 40.
[150] C. E. Lyman, J. I. Goldstein, D. B. Williams, D. W. Ackland, S. Von Harrach, A. W. Nicholls, P. J.
Statham, J. Microsc. 1994, 176, 85.
[151] J. Tong, J. Liu, Z. C. Kang, L. Eying, J. Alloys and Compounds 1994, 207, 416.
[152] C. E. Lyman, Ultramicroscopy 1986, 20, 119.
[153] R. D. Leapman, J. A. Hunt, Microsc. Microanal. Microstruct. 1991, 2, 231.
[154] C. E. Lyman in Physical Aspects of Microscopic Characterization of Materials (Eds.: J. Kirschner,
K. Murata, J. A. Venables) Scanning Microscopy International, AMF O'Hare, Illinois, 1987,
p123.
[155] C. Mory, H. Kohl, M. Tence, C. Colliex, Ultramicroscopy 1991, 37, 191.
[156] O. L. krivanek, C. Mory, M. Tence, C. Colliex, Microsc. Microanal. Microstruct. 1991, 2, 257.
[157] Z. G. Li, H. Wan, J. Liu, A. Tsoukatos, G. C. Hadjipanayis, L. Liang, Appl. Phys. Lett. 1993, 63,
3011.
132 Liu