Mechanics Analysis 2010 Part 11 docx
Bạn đang xem bản rút gọn của tài liệu. Xem và tải ngay bản đầy đủ của tài liệu tại đây (1.01 MB, 35 trang )
336
Mechanics and analysis
of
composite
materials
0
-
f
0 15 30
45
60
75
90
Fig.
7.23.
Calculated (lines) and experimental (circles) dependencies
of
dissipation factor
on
the ply
orientation for glass-epoxy
(-
0)
and carbon-epoxy
(-
-
o
)
unidirectional composites.
Dependence of an aramid-epoxy composite material temperature on the number of
cycles under tensile and compressive loading with frequency
IO3
cycles per minute is
shown in Fig.
7.24
(Tamuzh and Protasov,
1986).
Under cyclic loading, structural materials experience
a
fatigue fracture caused by
material damage accumulation.
As
was already noted in Section
3.2.4,
heteroge-
neous structure
of
composite materials provides relatively high resistance
of
these
materials to crack propagation resulting in their specific behavior under cyclic
loading.
As
follows from Fig.
7.25
showing experimental results obtained by
V.F.
Kutinov, stress concentration in aluminum specimens practically does not
affect material static strength due to plasticity
of
aluminum but dramatically reduces
its fatigue strength. Conversely, static strength of carbon-poxy composites that
T
"C
r
1.10
2
.10
Fig.
7.24.
Temperature of an aramidxpoxy composite as
a
function of the number of cycles under
tension
(1)
and compression
(2).
Chapter
7.
Environmental, special loading, and manufacturing efecfs
337
1
0.8
0.6
0.4
0.2
0""""
log
N
0 1 2 3 4 5 6 7
Fig.
7.25.
Typical fatigue diagrams for carbon-epoxy composite (solid lines) and aluminum alloy
(broken lines) specimens without
(1)
and with
(2)
stress concentration (fatigue strength is normalized to
sLalk
strength of specimens without stress concentration).
belong to brittle materials is reduced by stress concentration that practically does
not affect the slope of the fatigue curve.
On
average, residual strength of carbon
composites after lo6 loading cycles makes
7&80%
of
material static strength in
comparison with
3WO%
for aluminum alloys. Qualitatively, this comparative
evaluation is true
for
all fibrous composites that are widely used in structural
elements subjected to intensive vibrations such as helicopter rotor blades, airplane
propellers, drive shafts, automobile leaf-springs, etc.
A
typical for composite materials fatigue diagram constructed with experimental
results of Apinis et al. (1991) is shown in Fig.
7.26.
Standard fatigue diagrams
usually determine material strength
for
IO3
d
N
G
lo6
and are approximated as
(TR
=
a
-
hlog
N
.
(7.57)
t
I
logN
0 1 2 3 4 5 6 7 8
Fig.
7.26.
Normalized fatigue diagram for fabric carbon-carbon composite material (@-staticstrength).
.
o
experimental part of the diagram (loading frequency
6
Hz
(a)
and
330
Hz
(0)).
extrapolation.
338
Mechanics
and
analysis
of
composite materials
Here,
N
is the number of cycles to failure under stress
OR,
a
and
b
are experimental
constants depending on frequency of cyclic loading, temperature and other
environmental factors, and on the stress ratio
R
=
amitl/amax,
where
amax
and
amin
are the maximum and minimum stresses. It should be taken into account that results
of fatigue tests are characterized, as a rule with high scatter.
Factor R specifies the cycle type. The most common bending fatigue test provides
the symmetric cycle for which
Omin
=
-a,
amnx
=
a,
and
R
=
-
1.
Tensile load cycle
(amin
=
0,
omt,,
=
a)
has
R
=
0,
while compressive cycle
(amin
=
-a,
ami,,
=
0)
has
R
+
-00.
Cyclic tension with
a,,,
>
amin
>
0
corresponds to
0
<
R
<
1,
while
cyclic compression with
0
>
a,,,
>
omin
corresponds to
1
<
R
<
00.
Fatigue
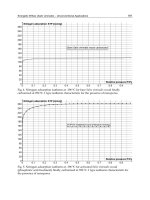
diagrams for unidirectional aramid-epoxy composite studied by Limonov and
Anderson (1991) corresponding to various R-values are presented in Fig. 7.27.
Analogous results (Anderson et al., 1991) for carbon-epoxy composites are shown
in Fig. 7.28.
Because only
c-1
is
usually available from standard test under cyclic bending,
fatigue strength for other load cycles is approximated
as
where
om
=
(amin
+
omax)/2
is the mean stress of the load cycle and
at
is the material
long-term strength (see Section 7.3.2) for the period of time equal to that of the
cyclic loading.
Fabric composites are more sensitive to cyclic loading than materials reinforced
with straight fibers. This fact is illustrated in Fig. 7.29 showing experimental results
of Schulte et al. (1987). The foregoing discussion deals with the high-cycle fatigue.
Initial interval
1
<
N
<
lo3 corresponding to the so-called low-cycle fatigue is
usually studied separately, because the slope of the approximation in Eq. (7.57) can
0
*0°
t
3
4
5
6
Fig.
7.27.
Fatigue diagrams for unidirectional aramid-epoxy composite loaded along the
fibers
with
various stress ratios.
Chapter
7.
Environmental, special loading, and manufacturing efficts
339
400
0
3
I
4 5
6
logN
Fig.
7.28.
Fatigue
diagrams for
a
unidirectional carbon-epoxy composite loaded along the fibers
with
various stress ratios.
3
4
5
6
Fig.
7.29.
Tensile fatigue diagrams
for
a cross-ply
(I)
and fabric
(2)
carbon-epoxy composites.
be different for high stresses. Typical fatigue diagram for this case is shown in
Fig.
7.30
(Tamuzh and Protasov,
1986).
Fatigue has also some effect on the stiffness of composite materials. This can be
seen in Fig.
7.31
demonstrating reduction of the elastic modulus
for
a glass fabric-
epoxy-phenolic composite under low-cycle loading (Tamuzh and Protasov,
1986).
This effect should be accounted for in application
of
composites
to
the design of
structural members such as automobile leaf-springs which, being subjected to cyclic
loading, are designed under stiffness constraints.
Stiffness degradation can be used as an indication of material damage to predict
its fatigue failure. The most sensitive characteristic
of
the stiffness change is the
tangent modulus
E,
specified by the second equation in Eqs.
(1
3).
Dependence
of
E,
on the number
of
cycles,
N,
normalized
to
the number
of
cycles that cause material
340
1200
800
400
Mechanics and analysis
of
Composite materials
-
-
-
I
0
-
logN
0
1
2
3
Fig.
7.30.
Low-cycle fatigue diagram for unidirectional aramid-epoxy composite loaded along the fibers
with
R
=
0.1.
E,GPa
30
r
2o10
i
0
0
I
1
2
3
logN
Fig.
7.31.
Dependence of elastic modulus of glass fabric-epoxy phenolic composite on the number
of
cycles at
stress
D
=
0.55
(if
is the static ultimate stress).
fatigue fracture under the pre-assigned stress is presented in Fig.
7.32
corresponding
to
f45"
angle-ply carbon-epoxy laminate studied by Murakami et al.
(1
99
1).
7.3.4.
Impact
loading
Thin-walled composite laminates possessing high in-plane strength and stiffness
are rather sensitive to damage initiated by transverse impact loads that can cause
fiber breakage, cracks in the matrix, delamination, and even material penetration by
the impactor. Depending on the impact energy determined by the impactor mass
and velocity and the properties
of
laminate impact loading can result in considerable
reduction in material strength under tension, compression, and shear. One
of
the
most dangerous consequences
of
the impact loading is an internal delamination
of
Chapter
7.
Environmental.
special loading, and manufacturing eflects
34
I
1
0.8
0.6
0.4
0.2
0
0
0.2
0.4
0.6
0.8
1
Fig.
7.32.
Dependence
of
the tangent modulus normalized
to
its initial value on the number
of
cycles
related to the ultimate number correspondingto fatigue failure under stress
umsx
=
120
MPa and
R
=
-
1
for
f45"
angle-ply carbon-epoxy laminate.
laminates that sometimescan be hardly identified by visual examination. This type of
the defect causes
a
dramatic reduction in the laminate compressivestrength and results
in unexpected failure
of
the thin-walled composite structure due to microbuckling
of
fibers or local buckling of plies.
As
follows from Fig.
7.33
showing experimental
results of Verpoest et al.
(1989)
for unidirectional and fabric composite plates,
impact can reduce material strength
in
compression by the factor of
5
and more.
To study the mechanism
of
material interlaminar delamination, consider a
problem of wave propagation through the thickness of the laminate shown in
Fig.
7.34.
The motion equation has the following well-known form
(7.58)
Here,
u,
is the displacement in the z-direction,
E,
is material modulus in the same
direction depending, in the general case on
z,
and
p
is the material density.
For
the
laminate in Fig.
7.34,
the solution of Eq.
(7.58)
should satisfy the following
boundary and initial conditions
r&(Z
=
0,
t)
=
-p(t),
az(z
=
h,
t)
=
0
,
(7.59)
au,
uz(z,
t
=
0)
=
0,
-(z
>
0,t
=
0)
=
0
at
in which
(7.60)
(7.61)
is
the interlaminar normal stress.
342
Mechanics and analysis
of
composite niateriab
q
I
so-
l
0.8
0.6
0.4
0.2
0
-
Ei,
Jlmm
0
5
10
15 20
Fig.
7.33.
Dependence of compression strength after impact normalized to the initial compressive
strength on the impact energy related to the plate thickness for glass fabric-epoxy
(I),
and unidirectional
glass-epoxy
(2)
and carbon-epoxy
(3)
composite plates.
h
I-
-1
Fig.
7.34.
Laminate under impact load.
Consider first a homogeneous layer such that
E,
and
p
do not depend on
z.
Then,
Eq.
(7.58)
acquires the form
where
c2
=
E,/p.
Transform this equation introducing new variables, Le.,
XI
=
z
+
ct
and
x2
=
z
-
ct.
Performing traditional transformation we arrive at
Chapter
I.
Environmental, special loading, and manufacturing effects
343
a2
u,
ax,
ax2
=o
The solution for this equation can be readily found and presented as
u2=4I(xl)+42(x2)
=41(Z+Ct)+42(Z-Ct)
I
where
41
and
42
are some arbitrary functions. Using Eq. (7.61) we get
0,
=
E,
Fl
(x
+
ct)
+
f2
(x
-
ct)]
]
where
Applying boundary and initial conditions, Eqs. (7.59) and (7.60), we arrive at the
following final result:
0,
=
E&
+
ct)
-
f(x
-
ct)]
,
(7.62)
in which the form of function
f
is governed by the shape of the acting pulse.
As
can be seen, the stress wave is composed of two components having the opposite
signs and moving in the opposite directions with one and the same speed
c
which is
the speed of sound in the material. The first term in Eq. (7.62) corresponds to the
acting pulse that propagates to the free surface
z
=
h
(see
Fig. 7.35 demonstrating
the propagation of the rectangular pulse), while the second term corresponds to the
pulse reflected from the free surface
z
=
h.
It is important that for the compressive
direct pulse (which is usually the case), the reflected pulse is tensile and can cause
material delamination since the strength of laminated composites under tension
across the layers is very low.
Fig.
7.35.
Propagation
of
direct and reflected pulses through the layer thickness.
344
Mechanics and analysis
of
composite materials
1.5
-1.5
For laminates, such as in Fig. 7.34, the boundary conditions, Eqs.
(7.59)
should
be supplemented with the interlaminar conditions
uf)
=
and
cy)
=
cry-’).
Omitting rather cumbersome solution that can be found elsewhere (Vasiliev and
Sibiryakov, 1985) present some numerical results.
Consider the two-layered structure the first layer of which has thickness 15 mm
and is made of aramid-epoxy composite material with
El’)
=
4.2 GPa,
pI
=
1.4 g/cm3and the second layer is made
of
boron-epoxy composite material and has
E!2)
=
4.55 GPa,
p2
=
2g/cm3,
h2
=
12mm. The duration of a rectangular pulse
of
external pressure
p
acting on the surface of the first layer is
tp
=
5
x
s.
Dependence
of
the interlaminar
(z
=
15
mm) stress on time is shown in Fig. 7.36.
As
can be seen, at
t
M
3tp
the tensile interface stress exceeds the intensity
of
the pulse of
pressure by the factor of 1.27. This stress is a result of interaction of the direct stress
wave with the waves reflected from the laminate’s inner, outer, and interface
surfaces. Thus, in
a
laminate, each interface surface generates elastic waves.
For laminates consisting of more than two layers, the wave interaction becomes
more complicated and, what is more important, can be controlled by the proper
stacking sequence of layers.
As
an example, consider a sandwich structure shown in
Fig. 7.37(a). The first (loaded) layer is made of aluminum and has
hl
=
1
mm,
E!’)
=
72 GPa,
pI
=
2.7g/cm3, the second layer
is
a foam core with
h2
=
10 mm,
E!*)
=
0.28
GPa,
pz
=
0.25 g/cm3, and the third (load-carrying) aramid+poxy
composite layer has
h3
=
12 mm,
Ei3)
=
10
GPa,
p3
=
l.4g/cm3. The duration of a
rectangular pulse of external pressure is
s.
Maximum tensile stress occurs in the
middle plane of the load-carrying layer (plane
a
-
a
in Fig. 7.37). Normal stress
induced in this plane
is
presented in
Fig.
7.38(a).
As
can be seen, at the moment of
time
t
equal to about 1.75
x
low5
s
this stress is tensile and can cause delamination
of
the structure.
-
4
-
1
0.5
0
-03
-I
Chapter 7.
Environmental, special loading, and manufacturing effects
345
P P
P
a
a a
a
(a)
(b)
(c>
Fig. 7.37. Structure
of
the laminates under study.
1020,
lp
lr
n
0
'
105t,sec
1.8
(a>
-1
-
-2
-
0
I
105t,sec
3.3 3.4 3.5 3.6 3.7 3.8 3.9
105t,sec
-1
(c>
1020zlp
-1.5
Fig. 7.38. Normal stress related to external pressure acting in section
a-a
of
the laminates in
Fig. 7.37(a)-(c). respectively.
346
Mechanics and analysis
of'
cornposite
materials
Now introduce an additional aluminum layer in the foam core as shown
in Fig. 7.37(b).
As
follows from Fig. 7.38(b) this layer suppresses tensile stress
in section
a
-
a.
Two intermediate aluminum layers (Fig. 7.37(c)) working as
generators of the compression stress waves eliminate the appearance of tensile stress
in this section. Naturally, the effect under discussion can be achieved for a limited
period of time. But actually, impact tensile stress is dangerous right after the pulse
action. Damping capacity of real structural materials (it was not taken into account
in the foregoing analysis) dramatically reduces the stress amplitude in time.
A
flying projectile with relatively high kinetic energy can penetrate through the
laminate.
As
known, composite materials, particularly, high-strength aramid fabrics
are widely used for protection against flying objects.
To
demonstrate the mechanism
of this protection, consider a square composite plate clamped in the steel frame
shown in Fig. 7.39 and subjected to impact of a rectangular plane projectile (see
Fig. 7.39) simulating the blade of the turbojet engine compressor. The plate consists
of the layers of thin aramid fabric impregnated with epoxy resin at a distance from
the window in the frame (see Fig. 7.39) and co-cured together as shown in Fig. 7.40.
The front (loaded) surface of the plate has a
1
mm thick cover sheet made of glass
fabric-epoxy composite. Results of ballistic tests are presented in Table 7.2. Front
and back views of plate
No.
2
are shown in Fig. 7.39, and the back view of plate
No.
3 can be seen in Fig. 7.40. Because mechanical properties of the aramid fabric
used to make the plates are different in the warp and in the fill directions (see Section
4.6),
the plates consist of couples of mutually orthogonal layers of fabric that are
C
(b)
Fig. 7.39.
Plate
no.
2
(see
Table 7.2) after the impact test:
(a)
front view;
(b)
back view
Chapter 7.
En~ironmental, special loading. and manufacturing effects
347
Fig. 7.40. Back view of plate No. 3
(see
Table 7.2) after the impact test
Table 7.2
Ballistic test of plates made of aramid fabric.
Plate no. Projectile velocity (m/s) Test results
1
2
3
315
320
325
No penetration
The projectile is "caught"
by the containment
Penetration
further referred to as
0"/90"
layers. All the plates listed in Table 7.2 have
n
=
32 of
such couples.
To calculate the projectile velocity below which it fails to perforate the plate (the
so-called ballistic limit) we use the energy conservation law according to which
imp(
q
-
yz)
=
n(
w
+
T)
,
(7.63)
where
K
is the projectile striking velocity,
V,
is its residual velocity,
mp
=
0.25
kg is
the projectile mass,
n
=
32 is the number of the
0"/90"
layers, Wis the fracture work
for the
0"/90"
layers, and Tis the kinetic energy of the layer. All the other factors
and the fiberglass cover of the plate are neglected.
Fracture work can be evaluated using the quasi-static test shown in Fig. 7.41. A
couple of mutually orthogonal fabric layers is fixed along the plate contour and
loaded with the projectile. The area under the force-deflection curve (solid line in
Fig. 7.41) can be treated as the work of fracture which for the fabric under study has
been found to be
W
=
120 Nm.
To calculate T, the deformed shape of the fabric membrane has been measured.
Assuming that the velocities of the membrane points are proportional to deflections
.f
and that df,/dt
=
K
kinetic energy of the fabric under study (density of the layer
unit surface is
0.2
kg/m') turn out to be
T
=
0.0006
v,'.
To find the ballistic limit, we should take
V,
=
0
in
Eq.
(7.63). Substituting the
foregoing results in this equation we get
&
=
190.5
m/s which is much lower than
the experimental result
(&
=
320 m/s) following from Table 7.2.
348
Mechanics
and
analysis
of
composite
materials
5-
5
10
15
20 25
30
35
40
45
Fig.
7.41. Fordeflection diagrams
for
square aramid fabric membranes
-
couple
of
layers with
orthogonal orientations,
-
superposition of the diagrams for individually tested layers.
Let us change the model of the process and assume that the fabric layers fail one
after another rather than all of them at once, as it is presented in
Eq.
(7.63).
The
result
is
expected to be different because the problem under study is not linear, and
the principle of superposition is not valid for it. Bearing this in mind, we write
Eq.
(7.63)
in the following incremental form:
(7.64)
Here,
6-1
and
F$
are the projectile velocities before and after the failure of the kth
couple of fabric layers,
W
is,
as earlier, the fracture work consumed by the kth
couple of layers,
G-1
=
0.0006
55,
and the last term in the right-hand side
of
Eq.
(7.64)
means that we account for the kinetic energy of only those fabric layers
that have been already penetrated by the projectile.
Solving
Eq.
(7.64)
for
V,
we
arrive at
I
'1
L
V,
=
,/[l
-0.0048(k-
l)]G%,
W.
mP
(7.65)
Fork
=
1, we take
V,
=
320
m/s, in accordance with the experimental ballistic limit,
and
have
fi
=
318.5
m/s from
Eq.
(7.65).
Taking
k
=
2
we repeat the calculation
Chapter
7.
Environmental, special loading, and manufacturing
eflects
349
and find that after the failure of the second couple of fabric layers
fi
=
316.2
m/s.
This process is repeated until
&
=
0,
and thus found number
k
determines the
minimum number of 0"/90"layers that can stop the projectile with striking velocity
V,
=
320
m/s. The result of calculation
is
presented in Fig.
7.42
from which it
follows that
k
=
32.
This is exactly the same number of layers that have been used to
construct the experimental plates.
Thus, it can be concluded that the high impact resistance of aramid fabrics
is
determined by two main factors. First, by relatively high work of fracture which is
governed not only by the high strength, but also by the interaction of the fabric
layers. The broken line in Fig.
7.41
shows the fracture process constructed as a
result of superposition of experimental diagrams for individual
0"
and
90"
layers.
The solid line corresponds as was noted, to
0"
and
90"
layers tested together (the
ratio of the fabric strength under tension in the warp and the fill direction is 1.3).
As
can be seen, the area under the solid line is much larger that under the broken one
which indicates high contribution of the layers interaction to the work of fracture. If
this conclusion is true, we can expect that for layers with higher anisotropy and for
laminates in which the principal material axes of the adjacent layers are not
orthogonal, the fracture work can be higher than for the orthotropic laminate under
study. The second factor increasing the impact resistance of aramid fabrics is
associated with a specific process of the failure during which the fabric layers fail
one after another but not at once. Plates of the same number of layers but consisting
of
resin impregnated and co-cured layers that fail at once demonstrate much less
impact resistance.
V,
,
m
I
sec
350
r
300
250
200
150
100
50
0
0
8
16
24
32
Fig. 7.42. Dependence
of
the residual velocity
of
the projectile
on
the number
of
penetrated layers.
350
Mechanics and analysis
of
coniposite materials
7.4.
Manufacturing effects
As
was already noted, composite materials are formed in the process of
fabrication
of
a composite structure, and their properties are strongly dependent
on
the type and parameters of processing. This means that material specimens that are
used to determine mechanical properties should be fabricated with the same
manufacturing method that
is
expected to be used to fabricate the structure under
study.
To
demonstrate direct correlation that can exist between processing and material
properties, consider the process of circumferential winding
on
the cylindrical surface
as
in
Fig. 7.43.
As
a rule, the tapes are wound with some overlap
wo
shown in
Fig. 7.44(a). Introducing dimensionless parameter
Fig.
7.43.
Winding of a circumferential layer. Courtesy
of
CRISM.
- 1
mi
C D
- -
-
.
-
.
.
Fig.
7.44.
Circumferential winding with (a) partial overlap
wo
<
w
and
(b)
complete overlap
wg
=
w.
Chapter
7.
Environmental, special
loading,
and manufacfuring effects
35
I
(7.66)
we can conclude that for the case of complete overlap (Fig. 7.44(b)) we have
R
=
1.
Initial position of the tape placed with overlap
wo
as in Fig. 7.44(a) is shown in this
Figure with a broken line, while the final position of the tapes is shown with solid
lines. Assume that after the winding and curing are over, the resulting structure is a
unidirectionally reinforced ring which is removed from the mandrel and loaded with
internal pressure,
so
that the ring radius being
R
before the loading becomes
RI.
Decompose the resultant force acting in the ring cross-section into two components,
i.e.
F=F’+F’’
(7.67)
and introduce the apparent stress acting along the fibers of the ring as
F
A
GI=-,
(7.68)
where
A
=
2w6
is the cross-sectionalarea of the ring made from two tapes as shown
in Fig. 7.44. Force F‘corresponds to part
BC
of the ring (Fig. 7.44(a)) and can be
found as
RI-R
F’
=
A‘EI
-
R ’
where
A’
=
(w
+
w0)6
is the cross-sectional area of this part of the ring and
El
is
the
modulus of elasticity of the cured unidirectional composite.
To
calculate force
F”
that corresponds to part
CD
of
the ring (Fig. 7.44(a)), we should take into account
that the fibers start to take the load only when this part
of
the tape reaches the
position indicated with broken lines, i.e.
R1
-
(R
+
S)
R
F’’
=
A”E,
I
where
A”
=
(w
-
wo)6.
With due regard to
Eqs.
(7.66), (7.67), and (7.68) we can
write the result of the foregoing analysis in the following form:
(7.69)
Here,
€1
=
(R1
-
R)/R
is
the apparent strain in the fiber direction.
For
complete
overlap
in
Fig. 7.44(b),
/1
=
1,
and
o1
=
Elel.
It should be noted that there exists
also the so-called tape-to-tape winding for which
A
=
0.
This case cannot be
described by
Eq.
(7.69) because
of
assumptions introduced in derivation, and the
resulting equation for this case is
61
=
Elel.
352
Mechanics and analysb
of
composite materials
As
follows from
Eq.
(7.69),
which
is
valid for winding without tension, overlap of
the tape results in reduction
of
material stiffness. Because the levels
of
loading for
the fibers of
BC
and
CD
parts of the ring (Fig. 7.44(a)) are different, reduction of
material strength can also be expected.
Filament winding is usually performed with some initial tension of the tape. This
tension improves material properties because it straightens the fibers and densifies
the material. However, high tension may result in fiber damage and reduction of
material strength. For glass and carbon fibers, preliminary tension usually does not
exceed
5%
of the tape strength, while for aramid fibers that are less sensitive to
damage the level
of
initial tension can reach
20%
of the tape strength. Preliminary
tension reduces the effect
of
the tape overlap discussed above and described by
Eq.
(7.69). However, this effect can show itself in reduction of material strength,
because the initial stresses which are induced by preliminary tension in the fibers can
be different, and some fibers can
be
overloaded
or
underloaded under external
forces acting on the structure in operational conditions. Strength reduction of
aramid+poxy unidirectional composites on the tape overlap observed in experi-
ments of Rach and Ivanovskii (1986) for winding on
a
200
mm diameter mandrel is
demonstrated in Fig. 7.45.
The absence of the tape preliminary tension or low tension can cause the ply
waviness shown in Fig. 7.46 which can occur in the filament wound laminates as a
result of pressure exerted by the overwrapped plies on the undenvrapped plies or in
flat laminates due to material shrinkage in the process
of
curing.
The simplest for analysis is the regular waviness presented in Fig. 7.46(a). To
determine the apparent modulus in the x-direction, we can use the expression
similar to one presented in
Eqs.
(4.76), Le.
I
COS^^
sin4a
Ex
El
E3
-
-
+-+
(&-$)
sin2crcos2cr
.
(7.70)
0.2
::L
0
0
0.1
0.2
0.3
0.4
0.5
A
Fig.
7.45.
Dependence
of
the normalized longitudinal strength
of
unidirectional aramid-epoxy
composite
on
the tape overlap.
Chapter
7.
Environmental, special loading, and manufacturing
eflects
353
a
X
2
Fig.
7.46.
Regular
(a),
through-the-thickness
(b),
and local (c)
ply
waviness.
Then, because the structure
is
periodic
Approximating the ply wave as
.m
z=asin-
,
1
where
a
is
the amplitude, we get
(7.71)
dz
m
dx
1
tana=-=
fcos-
,
354
Mechanics and analysis
of
composite
materials
where
f
=
m/l.
Substitution into
Eqs.
(7.70) and (7.71) and integration yield
(Tarnopol’skii and Roze, 1969)
where
L
=
(1
+
f2)3”.
Simplifying this result under the assumption that
f2
<<
1
we
arrive at
(7.72)
For glass-, carbon-, and aramid-poxy composites with properties listed in Table
3.5 dependencies corresponding to
Eq.
(7.72) are presented in comparison with
experimental results
of
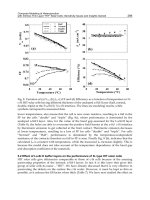
Tarnopol’skii and Roze (1969) in Fig. 7.47.
If the ply waviness varies through the laminate thickness as in Fig. 7.46(b),
Eq.
(7.72) can be generalized as
El
E:)
=
~ .
1
+g$
h
dz
0
and finally, for the local waviness (see Fig. 7.46(c)) we get
0.4
0.2
3
0
0
0.04
0.08
0.12
0.16
0.2
(7.73)
Fig. 7.47. Reduction
of
the normalized modulus
with
the ply waviness parameter,
f.
for
(1)
glass-,
(2)
carbon-,
and
(3)
aramid*poxy composites.
-
Eqs.
(7.72),
o
experiment
for
glass-epoxy
composite.
Chapter
7.
Environmental, special loading, and manufacturing
ejiec~s
355
where
and
Et’
is specified by Eq. (7.73).
Even moderate ply waviness dramatically reduces material strength under
compression along the fibers, as can be seen in Fig. 7.48 demonstrating experi-
mental results of
V.F.
Kutinov for unidirectional carbon-epoxy composite. The
other strength characteristics of unidirectional composites are just slightly affected
by the ply waviness.
There exist also some specific for composites manufacturing operations that cause
stresses and strains appearing in composite structural elements in the process of their
fabrication. As an example, consider the problem of bending
and
warping
of
unsymmetric laminates during the fabrication. Assume that some laminated
polymeric composite panel is cured under temperature
T,
and cooled
to
room
temperature
To.
Under slow cooling, the temperature change,
AT
=
TO
-
T,,
is the
same for all the layers. Because thus fabricated panel is free of loading (Le., no loads
are applied to its edges and surfaces) the forces and moments in the left-hand sides
of Eqs. (7.23) and (7.24) are zero, and these equations form a linear algebraic system
for generalized strains
ET,
yT
and
KT.
Integration of strain-displacement equations,
Eqs. (7.28), allows
us
to determine the shape of the fabricated panel.
Analysis of Eqs. (7.25) and (7.26) similar to that performed in Section 5.6 shows
that for symmetric laminates
M:,,
=
0.
Because
C,,,
=
0
for such laminates, the
0
0
0.1
0.2
0.3
Fig.
7.48.
Experimental dependence
of
carbon-epoxy composite longitudinal compression strength
related to the corresponding strength
of
material without ply waviness
on
the ratio
of
the
waviness
amplitude
to
the ply thickness.
356
Mechanics
and
analysis
of
composite
materials
last three equations of Eqs.
(7.23)
in which
M,
=My
=
Mxev
=
0
form a set of
homogeneous equations whose solution is
K~T
=
K~T
=
xXy~
=
0.
This means that a
flat symmetricpanel does not acquire curvature in the process of cooling. Naturally,
the in-plane dimensions of the panel become different from those that the panel had
before cooling. The corresponding thermal strains
&:T,~:T
and
y:yT
can
be
found
from the first three equations of Eqs.
(7.23)
in which
N,
=
N,
=Nxy
=0,
but
N:
,
N&
and
N&
are not zero.
However, for unsymmetric laminates, in general,
A42n
#
0,
and these laminates
experience bending and warping in the process
of
cooling.
To
demonstrate this,
consider two antisymmetric laminates studied in Section
5.7.
The first is
a
two-layered orthotropic cross-ply laminate shown in Fig.
5.13.
Using stiffness coefficients calculated in Section 5.7, taking into account that
for
a
cross-ply laminate
NL
=
MT2
=
0,
and applying Eqs. (7.23) for
Nxy
and
Mxy
we get
y:yT
=
0
and
Kxy~
=
0.
Thus, cooling of the cross-ply laminated panel does not
induce its in-plane shear and twisting. The other four of Eqs.
(7.23)
acquire the
form:
where
The solution of Eqs.
(7.74)
can be written as
(7.74)
(7.75)
(7.76)
Chapter
I.
Environmental, special loading, and manufacturing effects
351
where
As
follows from Eqs.
(7.75)
and (7.76),
E
and
K
do not depend on
x
and
y.
the form
To find the in-plane displacementswe should integrate
Eqs.
(7.28)
which acquire
Referring the panel to coordinates
x
and
y
shown in Fig.
7.49
and assuming that
u(x
=
0,
y
=
0)
=
0
and
v(x
=
0,y
=
0)
=
0
we get
u
=
8-TrX,
0
0
=
&,.TY
0
.
(7.77)
Now consider Eqs.
(7.24)
in which
V,
=
5.
=
0.
Thus,
yxT
=
yJ,T
=
0,
and
Eqs.
(7.30)
yield
8,
=
-&/ax,
8,
=
-aw/ay.
The plate deflection can be found from
Eqs.
(7.29)
which reduce to
Assuming that
w(x
=
0,
y
=
0)
=
0,
&(x
=
0,
y
=
0)
=
0,
write the result
of
integration as
w
=
-+(K~T~
+
K,T~)
.
=
0,
y
=
0)
=
0
we can
(7.78)
To
present thus obtained solution in an explicit form, consider, for the sake of
brevity, material with zero
Poisson’s
ratios
(v12
=
v21
=
0).
Then,
Eqs.
(7.75)-(7.78)
yield
X
/
JY
Fig.
7.49.
Deformed
shape
of
a cross-ply antisymmetric panel.
358
Mechanics and analysis
of
composite materials
The deformed shape of the panel is shown in
Fig.
7.49.
Note that displacements
u
and
u
correspond to the panel reference plane which is the contact plane of
0
and
90
layers (see
Fig.
5.13).
Another typical antisymmetric structure is the two-layered angle-ply laminate
shown in Fig. 5.14. Using stiffnesscoefficientsof this laminate found in Section
5.7
and
Eqs.
(7.25)
and
(7.27),
we can write
Eqs.
(7.23)
in the following form:
h
All&:~+A12$!~ -4A14K.xy~
=AT,,
A12&,~
+
A22&,,~
-
-A74KxyT
=
Al29
.
4-
0
o h
o h
A44?xyT
-
4
(A14JGT
$.
A24K,T)
=
0,
o h
-A14?.r,,;r +T(AllKxT +A12KvT)
=
0,
-A24?:.~
+
-
(A
IZK.XT
+
A22Ky-r)
=
0,
AI4Ex~
+
A24&$~
-
jA44K.ryT
=
AT2
,
h
3
0
o h
where
The solution is
Chapter
7.
Environmental. special loading, and manufacturing effects
359
where
A
=
A~IA~z
-
A:2.
Thus, the panel under study experiences only in-plane deformation and twisting.
Displacements
u
and
u
can be determined with
Eqs.
(7.34),
while the following
equations should be used to find
w
The result
is
The deformed shape of the panel is shown in Fig.
7.50.
Depending
on
the laminates structures and dimensions therc exist the whole class
of stable and unstable laminate configurations studied by Hyer (1
989).
Deformation and warping of laminates appearing after the manufacturing
process
is
over can occur not only due to cooling
of
the cured composite but also as
a result of material shrinkage due to release of fibers tension after the composite
part is removed from the mandrel or chemical setting of the polymeric matrix.
To demonstrate these effects, consider a thin unidirectional layer formed with
circumferential plies wound on
a
metal cylindrical mandrel (see Fig.
7.51)
under
some tension. Because the stiffness of the mandrel is much higher than that of the
layer, we can assume that under cooling from the curing temperature
Tc
to room
temperature
To
the strains in the principal material coordinates
of
the layer are
governed by the mandrel with which the cured layer is bonded, i.e.
Fig.
7.50.
Deformed shape of an angle-ply antisymmetric panel.
Fig.
7.51.
A
unidirectional circumferential layer on a cylindrical mandrel.
360
Mechanics and analysis
of
composite materials
&T_
I
-e2
T-
-aoAT,
(7.79)
where
a0
is the
CTE
of the mandrel material and
A T
=
TO
-
T,.
On the other hand,
if
the layer is cooled being preliminary removed from the mandrel, its strains can be
calculated as
The first terms in the right-hand sides of these equations are free temperature strains
along and across the fibers (see Fig.
7.51),
while
E(:
and
E!
correspond to the possible
layer shrinkage in these directions.
Using Eqs.
(7.79)
and
(7.80)
we can determine the strains that appear in the layer
when it
is
removed from the mandrel, i.e.
(7.81)
These strains can be readily found if we measure the layer diameter and length
before and after
it
is removed from the mandrel. Then, the shrinkage strains can be
determined
as
For a glass-epoxy composite with the following thermo-mechanical properties:
EI
=
37.24
GPa,
E2
=
2.37
GPa,
Gl2
=
1.2
GPa,
ltl2
=
0.26,
=
3.1
x
lo-‘ 1/”C,
~12
=
25
x
I/OC
,
Morozov and Popkova
(1987)
found
8:
=
-93.6
x
=
-64.
IO?
Further
experiments performed for different winding tensions and materials of the mandrel
have shown that, while strain
E(:
strongly depends on these parameters, strain
e!
-
practically does not change. This supports the assumption that strain
6;
is
caused by
the chemical shrinkage of the resin and depends only on its properties.
For a cylinder in which fibers make angle
4
with the x-axis in Fig.
7.51,
the
strains induced by the removal of the mandrel can be found from
Eqs.
(4.70),
i.e.
EX
=
11
cos2
4
+
~2
sin2
6,
E,,
=
11
sin2
4
+
cos2
4,
jJxy
=
(El
-
E2)
sin
24
,
(7.82)
where
El
and
E2
are specified by Eqs.
(7.81).
Dependencies of
E,,
E.”,
and
+,,
on
4
plotted with the aid
of
Eqs.
(7.82)
are shown
in
Fig.
7.52
together with expenmental