ECOLOGICAL BASIS OF AGROFORESTRY - CHAPTER 13 potx
Bạn đang xem bản rút gọn của tài liệu. Xem và tải ngay bản đầy đủ của tài liệu tại đây (761.57 KB, 18 trang )
13
Root Competition for Water
between Trees and Grass
in a Silvopastoral Plot of
10 Year Old Prunus avium
Philippe Balandier, François-Xavier de Montard, and Thomas Curt
CONTENTS
13.1 Introduction 253
13.2 Materials and Methods 255
13.2.1 Experimental Plot 255
13.2.2 Climate and Soil 255
13.2.3 Experimental Design 255
13.2.4 Measurements 256
13.2.4.1 Tree Dimension 256
13.2.4.2 Tree and Grass Water Status 256
13.2.4.3 Grass and Tree Root Growth 256
13.2.4.4 Soil Water Content 256
13.2.4.5 Data Analysis 257
13.3 Results 257
13.3.1 Aboveground Tree Growth 257
13.3.2 Soil Water Content 257
13.3.3 Water Status of Trees 260
13.3.4 Root Growth 262
13.4 Discussion 264
13.5 Conclusion 267
Acknowledgments 267
References 267
13.1 INTRODUCTION
In temperate Europe, fast-growing broad-leaved trees such as wild cherry (Prunus avium L.) supply
highly valued wood with a veneer end use. The wild cherry tree has a high light requirement
(Ruchaud, 1995), which makes it a species potentially well adapted for agroforestry purposes where
trees are planted with very wide spacing to allow intercropping or grazing (Balandier and Dupraz,
1999). Cattle or sheep maintain grass and shrubs at low height and add an income from animal
products for the owner. With the help of tree pruning (Balandier, 1997), such a silvopastoral system
has proved efficient in produci ng straight knot-free quality boles (Balandier et al., 2002).
Agroforestry practice requires that the biological and physical relationships between the differ-
ent components of the system (for instance tree and crop or pasture) generate a favorable balance
Batish et al./Ecological Basis of Agroforestry 43277_C013 Final Proof page 253 9.10.2007 9:35am Compositor Name: VAmoudavally
253
Copyright 2008 by Taylor and Francis Group, LLC
between negative and positive interactions (Anderson and Sinclair, 1993). In other words, the trees
must utilize resources that the crop does not (Cannell et al., 1996) and vice versa. This is also called
the niche theory: two or more species must use resources differently if they are to coexist on a site
(Kelty, 1992). However, though often postulated, such a relationship has seldom been demon-
strated, particularly as regards interactions at the root level (Kelty, 1992), namely competition for
water, nutrients uptake, allelopathy, etc.
The wild cherry tree is a species known to be sensitive to intra- and interspecies competition
(i.e., other trees, shrubs, or grass; Collet et al., 1993), which adversely affect its growth and the
quality of its wood (Le Goff et al., 1995). Therefore, when it is associated with a crop or pasture in
agroforestry, the question arises of whet her the balance of interactions will be positive.
The basic mechanisms that lead to growth impairment of wild cherry in competition with grass
or shrubs are not fully known (Lucot, 1997). Most studies have been indirect: the elimination of
weeds or shrubs around trees has a positive effect on growth in height and especially in diameter or
biomass for young trees (Monchaux, 1979; Frochot and Lévy, 1980; Britt et al., 1991; Collet and
Frochot, 1992; Campbell et al., 1994; Le Goff et al., 1995; Balandier et al., 1997; Cain, 1997; Davis
et al., 1999) and a positive effect on root growth (Larson and Schubert, 1969). Interactions between
trees and weeds or shrubs, although demonstrated practically, need to be more fully described in
terms of specific processes to form a basis for improving tree management (Nambiar and Sands,
1993). Some functional physiological studies have been conducted on very young trees, but often in
containers or not in natural conditions (Collet et al., 1996; Jäderlund et al., 1997; Johnson et al.,
1998; Mohammed et al., 1998). For instance, the leaf water potential of trees in association is often
more negative than that of trees in bare soil (e.g., Juglans regia L. with Trifolium subterraneum L.,
Pisanelli et al., 1997; Pinus strobus L. with Populus tremuloides Michx., Boucher et al., 1998;
Quercus robur L. and Fagus sylvatica L. with natural herbaceous vegetation, Löf, 2000). Tree
transpiration, leaf CO
2
assimilation, and leaf conductance can also be altered by herbaceous
competition (Pinus radiata D. Don with Dactylis glomerata L., Miller et al., 1998; J. regia with
Lolium perenne L., Picon-Cochard et al., 2001).
Girardin (1994) concluded from a study on 4 year old wild cherry trees that as this species has a
very shallow root system, it suffers badly from competition by grass. However, the study was
indirect and the true depth of the tree root system was not measured directly. Even so, all the studies
conducted suggest that trees do suffer from such competition, to different extents depending on the
competing species (Nambiar and Sands, 1993; Mil ler et al., 1998; Dupraz et al., 1999; Coll et al.,
2003) and that this competition can reduce their growth and sometimes prevent their establishment.
Allelopathy, the release of toxic chemicals in the environment by a plant or a tree is other possible
negative interference, which can reduce either tree growth or grass production. In agroforestry
systems, some trees were characterized as probably having an allelopathic inhibitory effect (e.g.,
Juglans sp., Eucalyptus sp., Gallet and Pellissier, 2002). Many grasses were also reported to have
such similar effects (Qasem and Foy, 2001). However, nothing is mentioned on a potential allelo-
pathic effect of the wild cherry tree or the main herbaceous species composing the pasture (see
Section 13.2) in the study reported here (Qasem and Foy, 2001), except perhaps for Holcus lanatus.
Much work has been done on competition between trees and grass in agroforestry systems with
pine (e.g., Nambiar and Sands, 1993; Yunu sa et al., 1995, for P. radiata) and Eucalyptus (Eastham
and Rose, 1990 for Eucalyptus grandis Maiden) and for warm climates (Scholes and Archer, 1997;
Balandier, 2002). However, the literature is much more scant for temperate climates and broad-
leaved species such as wild cherry.
Here we report on interactions at the root level between trees and grass in a temperate
silvopastoral system with 10 year old broad-leaved wild cherry trees in natural conditions. Compe-
tition for light and for nitrogen in such a system has already been reported (De Montard et al., 1999;
Méloni, 1999). Nutrients other than nitrogen are present in the soil in supraoptimal values and
competition for them was unlikely. Therefore, this chapte r focuses on interactions for water. We
studied not only the aerial growth of the tree but also its water status, its root growth through direct
Batish et al./Ecological Basis of Agroforestry 43277_C013 Final Proof page 254 9.10.2007 9:35am Compositor Name: VAmoudavally
254 Ecological Basis of Agroforestry
Copyright 2008 by Taylor and Francis Group, LLC
measurement, time course of volume soil water content, and the interactions between these different
parameters to understand more fully and so better manage the water competition relationships
between tree and grass.
13.2 MATERIALS AND METHODS
13.2.1 E
XPERIMENTAL PLOT
The experiments took place in a silvopastoral plot of 2.9 ha in Auvergne, Central France (approxi-
mate latitude 468N and longitude 38E), in hilly country, at an elevation of 810 m a.s.l. The plot
slopes moderately (from about 8% – 15%). Two year old wild cherry trees (Prunus avium L.) were
planted directly with minimum tillage of the soil in March 1989 at 200 stems ha
À1
(6 3 8m)ona
permanent pasture grazed by sheep. For practical reasons during the experiment—from 1997 to
1999—the sheeps were kept out of the experiment al plot (about 1000 m
2
) and the pasture was
regularly cut by hand to simulate sheep browsing. The main species of the pasture were orchard
grass (D. glomerata L.), hairy oat grass (Avena pubescens Huds.), yellow oat-grass (Trisetum
flavescens [L.] P. Beauv.), velvet grass (H. lanatus L.), Erect Brome (Bromus erectus Huds.), red
fescue (Festuca rubra L.), white clover (Trifolium repens L.), Bush vetch (Vicia sepium L.),
common yarrow (Achillea millefolium L.), and Germander speedwell (Veronica chamaedrys L.).
Trees were weeded with glyphosate (3.6 g L
À1
) during the first 4 years after planting (i.e., from
1989 to 1992) within a radius of 0.6 m around their trunk to ensure firm rooting. None of the trees in
this study were pruned.
13.2.2 CLIMATE AND SOIL
Average annual rainfall was 835 mm, fairly evenly distributed throughout the year but sometimes
with pronounced drought periods (e.g., about 15 March–07 May, 4–11 June, 18–25 June, 15–22
July, and 30 July–20 August in 1997, 10 May–09 June and 09–30 July in 1998, and 30 May–09
July in 1999). The mean annual temperature was about 98C. The soil was a slightly acid granitic
brown soil (brunisolic order—Orthic B, Canadian soil classification 1998; pH
water
¼ 5.8, the organic
matter ranged from about 65 g kg
À1
in the upper soil layer to 6 g kg
À1
in depth which corresponds to
a moderately fertile soil) topped by a thin basaltic colluvium, and soil depth reached up to 180 cm.
On average, the first layer (about 0–15 cm) of the soil displayed a sandy-silt texture with a micro-
lumpy structure. The proportion of coarse elements (i.e., >2 mm) was about 10%. The compactness
was low. The second layer (15–40 cm) had the same texture (sandy-silt) but was more compact with
a high density and coarser elements (40%); the structure was heavier. The next two layers had a
silty-sand texture with a heavy structure and a high proportion of coarse elements (60%–70%).
Taking into account the proportion of the coarse elements, the calculated total available water
content of the soil (Baize and Jabiol, 1995) to a depth of 120 cm deep was about 85 mm. Among the
different trees, there were some small differences in soil layer depth and compactness. Wherever
possible, we tried to take into account these small variations when analyzing growth data. For each
layer of soil, the soil wat er content corresponding to the wilting point (pF of 4.2 or 16 atm., i.e., by
convention, the soil potential over which plant roots cannot extract water) was assessed after
establishing curves of ‘‘soil potential–soil water content’’ (Lucot, 1997); on average, for a 20 cm
thick layer, the soil water content at the wilting point is about 12 mm. Apparent density was also
calculated from soil samples at different depths ( d ¼ total soil sample dry weight=soil sample
volume, g cm
À3
).
13.2.3 EXPERIMENTAL DESIGN
Observations and measurements were made on eight trees selected among the most vigorous ones
(i.e., trees that had heights and trunk diameters in the upper quartile). In this way, we avoided puny
Batish et al./Ecological Basis of Agroforestry 43277_C013 Final Proof page 255 9.10.2007 9:35am Compositor Name: VAmoudavally
Root Competition for Water between Trees and Grass in a Silvopastoral Plot 255
Copyright 2008 by Taylor and Francis Group, LLC
trees, for which poor growth may be due to disease and not due to competition with grass. At the
beginning of the experiment (spring 1997), the average height of the trees was 6.5 m and the average
trunk diameter at 1.3 m was 8 cm. Three trees were weeded (grass suppression, T À G treatment) in
March 1997 with glyphosate (3.6 g L
À1
) in a 4 m radius around the tree trunk to form a control with no
grass competition. Their growth was compared with that of five trees maintained in grass (T þ G
treatment). Two control plots (or subplots, 100 m
2
each) were installed about 30 m away from the
trees; a plot with only grass and no tree (G treatment) and a plot with bare soil (BS treatmen t). For the
T À G trees, regular treatments with glyphosate (3.6 g L
À1
, one treatment every year at the beginning
of the growing season) and manual harrowing (several times in the year) were carried out for 3 years to
keep the soil grassfree. All the trees were regularly treated against aphids and Blumeriella jaapii (with,
respectively, deltamethrine 0.00075 g L
À1
and doguadine 0.72 g L
À1
).
13.2.4 MEASUREMENTS
13.2.4.1 Tree Dimension
Tree trunk girth at breast height (1.3 m) and total height of each tree were measured manually every
week from 1997 (when trees were 10 years old) to 1999. In addition, for trunk diameter increment,
an automatic electric sensor (LVDT type, Solarton DF 2.5) was fitted to the trunk of each tree at
about 1.3 m height to record daily variations in trunk diameter: contraction in the day was due to
water loss through transpiration flow, and increase during the night was due to water uptake and
growth (Améglio and Cruiziat, 1992). The sensor was accurate to less than 2.3 mm.
13.2.4.2 Tree and Grass Water Status
Predawn (c
p
) and midday (c
m
) leaf water potentials of tree and grass were measured each week with
a pressure chamber (Scholander et al., 1965). The grass cover was made up of several species. As
we were unable to make water potential measurements on all the species present, we chose the most
representative species based on abundance for these measurements, that is, Avena pubescens in
1997 and D. glomerata in 1998 and 1999.
13.2.4.3 Grass and Tree Root Growth
Grass and tree root densities and elongations were calculated using rhizotrons. Three rhizotrons were
installed in April 1997 in three directions at 1.1, 2.2, and 3.3 m from the trunk of a T À G treatment
tree and from the trunk of a T þ G treatment tree. One rhizotron was set up in the G treatment. In
1998, two additional rhizotrons were installed 2.2 m from a T À G tree and a T þ G tree. Each
rhizotron was 1.25 m deep and 1.0 m wide. Such a dimension was necessary to assess 10 year old
tree root systems. The number of rhizotrons was voluntarily limited, given their dimension, to avoid
disrupting too much tree growth. In spite of some disadvantages such as modified microclimatic
conditions (Taylor et al., 1990; Vogt et al., 1998), rhizotrons allow sequential measurements to be
made of the same roots without any destruction (Lopez et al., 1996). Minirhizotrons were not used
because they are much more expensive and require numerous long tubes to estimate such large root
systems accurately (Franco and Abrisqueta, 1997).
13.2.4.4 Soil Water Content
Volume soil water content was measured every week in 20 cm thick layers to a depth of 80 cm with
a TDR probe (Time Domain Reflectometry IMKO device). The TDR probe used was a tube type
adapted for measurements in permanent thin-walled plastic tubes . Thin-walled tubes were driven
vertically into the soil with the help of an auger. Measurements were made every week by lowering
the probe into the tubes with a stop measurement every 20 cm to a maximum depth of 80 cm. Three
tubes were placed 1.1, 2.2, and 3.3 m (i.e., at the same distance as rhizotrons from tree trunks) from
Batish et al./Ecological Basis of Agroforestry 43277_C013 Final Proof page 256 9.10.2007 9:35am Compositor Name: VAmoudavally
256 Ecological Basis of Agroforestry
Copyright 2008 by Taylor and Francis Group, LLC
each T À G tree and each T þ G tree. Control tubes were driven below the G and BS treatments. The
use of the TDR technique is a proven method for measuring soil water content accurately with
limited disturbance of the soil and root distribution (Werkhoven, 1993; Todoroff and Langellier,
1994; Mastrorilli et al., 1998).
13.2.4.5 Data Analysis
It was not p ossible to perform all the measurements in this experiment on more than eight trees, which
was already a large task; a thorough statistical analysis was therefore impossible. However, as all the
measurements were done at tree scale, it was nevertheless possible to link individual tree growth to
each tree’s local conditions: soil characteristics, evolution of soil water content, depth and density of
tree and grass roots, etc. Hence, the response of each individual tree was analyzed taking into account
the ‘‘treatment’’ variable (with or without grass) as a first explanatory variable and the microsite
conditions for each individual tree as a secondary, or covariate factor. Variations in soil water content,
which are less sensitive to the initial conditions than absolute values, were set as a cofactor to explain
tree growth. In the same way, the relative growth rate (RGR) was calculated for the different tree
growth variables (height, diameter, root elongation, etc.), to take into account the initial size of the
tree in its growth response (Causton and Venus, 1981; Collet et al., 1996). RGR (day
À1
), for inst ance
for girth, for a given period of time t
1
to t
2
(in number of days) was calculated by:
RGR ¼
(C
2
À C
1
)=(t
2
À t
1
)½
C
1
, (13:1)
where
C
1
is the girth at t
1
C
2
is the girth at t
2
Relationship between tree growth and causal variables (i.e., soil water content) was based on
regression analysis using the general linear model (Statgraphics plus 5.1 software).
Each value of water potential was the mean of three leaf measurements sampled in different
parts of the crown of each tree. The value for grass was the mean of 8–10 leaves sampled on
different grass clumps. Each TDR value (i.e., for a 20 cm layer from a particular tube) was the mean
of three measurements made in three different directions.
13.3 RESULTS
13.3.1 A
BOVEGROUND TREE GROWTH
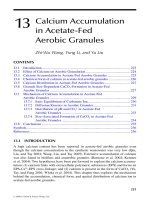
During the whole study period, T À G trees displayed a much better height and especially girth
growth than T þ G trees (Figure 13.1) and differences tended to increase with time. After 3 years,
the T À G tree girth increment was about twice that of T þ G. Over the season, girth RGRs (Figure
13.2) showed some global variations according to tree phenology (i.e., in general, RGR increased at
the beginning of the season and decreased at the end), and also that the girth RGRs of TÀG trees
were often greater than T þ G girth RGRs, especially during the drought periods (e.g., 4–11 June,
18–25 June, and 15–22 July in 1997; similar data were found in 1998 and 1999).
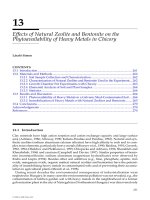
13.3.2 SOIL WATER CONTENT
Volume soil water content fluctuated according to rainfall events and treatments (Figure 13.3). Only
data of 1997 are presented, the same soil water patterns being recorded in 1998 and 1999. Only the
variations of the 0–20 cm and 40–60 cm soil layers are presented, the 20–40 cm soil layer showing
results intermediate between the 0–20 and 40–60 cm soil layers, and the 60 –80 cm soil layer
Batish et al./Ecological Basis of Agroforestry 43277_C013 Final Proof page 257 9.10.2007 9:35am Compositor Name: VAmoudavally
Root Competition for Water between Trees and Grass in a Silvopastoral Plot 257
Copyright 2008 by Taylor and Francis Group, LLC
showing no variation. For the 0–20 cm layer, the soil water content of the T À G treatment was
about the same as the BS treatment (Figure 13.3a). In contrast, the soil water contents of the G and
markedly for the T þ G treatment were much lower than under the BS and T À G treatments, and
fluctuated widely according to rainfall events. In the 40–60 cm deep layer, soil water content was
much more stable than in the 0–20 cm deep layer (Figure 13.3b) and showed only small variations
following some isolated rainfall events for the T À G treatments. In this layer, the soil water content
was globally low in comparison with the 0–20 cm layer (between 20 and 30 mm for the T þ G
treatment). As observed in the 0 – 20 cm deep layer, we recorded the same hierarchy among the
treatments regarding soil water content in the 40–60 cm deep layer, BS > T À G > G > T þ G.
0
5
10
15
20
25
Apr.
1997
Date
Girth increment (cm)
T − G
T
+ G
Sept.
1997
Apr.
1999
Sept.
1999
FIGURE 13.1 Mean tree girth increment at breast height for the T À G and T þ G treatments for the period
1997–1999 (data of 1998 not shown).
0
0.001
0.002
0.003
0.004
Apr. May Jun. Jul. Aug. Sept.
Month (1997)
Girth RGR (day
−1
)
T − G
T
+ G
FIGURE 13.2 Mean tree girth RGR time course for the T À G and T þ G treatments over the season: example
for 1997. Each point corresponds to the RGR between two consecutive dates.
Batish et al./Ecological Basis of Agroforestry 43277_C013 Final Proof page 258 9.10.2007 9:35am Compositor Name: VAmoudavally
258 Ecological Basis of Agroforestry
Copyright 2008 by Taylor and Francis Group, LLC
Focusing on the periods corresponding to marked differences in the T À G and T þ G girth
RGRs (Figure 13.2), it is clear that these periods corresponded to ranging degrees of soil water
deficit according to date and treatment (Table 13.1).Total soil water contents for the 0–80 cm deep
layer were always greater for the T À G treatment (about 200 mm) than for the T þ G treatment
(under 140 mm), resulting in a high availability of water for trees of this T À G treatment and a
corresponding high tree RGR (Table 13.1, RGRs were alw ays greater than 0.00163 day
À1
). When
the amount of available water decreased severely (less than 80 mm, i.e., close to the wilting point),
girth growth also decreased and even stopped in some particularly pronoun ced droughts (data not
shown). Pooling all the data, a close relationship betw een girth RGR (10
À3
day
À1
) and water
availability (WA) (mm) was established:
RGR ¼ 0:0177 WA À 0 :8083,
R
2
¼ 0:68,
n ¼ 12:
(13:2)
Figure 13.4 shows in detail the variations of soil water content a few days before and after 22 July
1997, a period of severe drought, according to soil layer depth, rainfall event, and treatment.
(a)
0
20
40
60
80
100
Volume water content (mm)
0
20
40
60
80
100
Rainfall (mm)
G
BS
T − G
T + G
Apr. May Jun. Jul. Aug. Sept.
Apr. May Jun. Jul. Aug. Sept.
(b)
0
20
40
60
80
100
Volume water content (mm)
0
20
40
60
80
100
Rainfall (mm)
Month (1997)
FIGURE 13.3 Volume soil water content dynamics (example for 1997) for the different experimental
conditions. Values for the T À G and T þ G trees are those at 2.2 m from the trunk. (a) 0–20 cm deep layer
and (b) 40– 60 cm deep layer. (Results of the other layers not shown.)
Batish et al./Ecological Basis of Agroforestry 43277_C013 Final Proof page 259 9.10.2007 9:35am Compositor Name: VAmoudavally
Root Competition for Water between Trees and Grass in a Silvopastoral Plot 259
Copyright 2008 by Taylor and Francis Group, LLC
Variations in the soil water content were much more marked for the T À G than for the T þ G
treatment (Figure 13.4). For the T À G treatment (Figure 13.4a), the soil water content of the 0–20 cm
deep layer varied according to the rainfall events: increase with rainfall, decrease with dry period. For
the deepest layers, there was a time lag between precipitation events and increase in the soil water
content. The water percolation toward the deepest layers sometimes took several days. For the T þ G
treatment (Figure 13.4b), no such variations were observed, nor was any water transfer toward the
deepest layers observed. Only the 0–20 cm deep layer showed some small variations. It seems that all
the water coming from rainfall events was taken up in this 0–20 cm layer as there was no variation in
the deepest layers.
13.3.3 WATER STATUS OF TREES
Table 13.2 gives the tree and grass leaf water potentials for two consecutive dates of measurement in
1998: 23 July and 30 July, respectively, before and after a period of water deficit. The total amount
of rainfall water between 11 June and 9 July was 40 mm; there was then no rainfall for 2 weeks till
23 July and a rainfall event of 15 mm between 23 and 30 July.
The mean value of c
m
for trees was very negative and some individual values were as low as
À2.5 MPa for some trees. Despite this severe stress during daytime, the much less negative values
of c
p
indicated that the trees rehydrated themselves partially during the night (Table 13.2).
However, there was a significant difference between trees of the T À G and T þ G treatments in
predawn leaf water potential, whereas values for the midday water potential were insignificantly
different (Table 13.2). Clearly T À G trees rehydrated themselves overnight more than T þ G trees.
The recorded tree diameter microvariations between 6 and 28 July 1998 (Figure 13.5) confirmed
the leaf water potential measurements: tree contraction during the day reached 0.5 mm (e.g., 20
July—day 201) indicating marked water stress. However, while T þ G tree growth was greatly
reduced during this period (Figure 13.5), T À G trees continued to display an impressive growth due
TABLE 13.1
Measured Total Soil Water Conten t (mm) Using the TDR Probe for the 0–80 Deep Layer at
2.2 m from Tree Trunk, Calculated Soil Water Content (mm) Corresponding to the Wilting
Point of the Same Layer (See Section 13.2) and Resulting Water Content Available for Plant
(Total Water Content–Wilting Point Water Content) for Three Different Dates and
Associated Girth RGRs (Year 1997)
Treatment
T À GT1 G
Date 11 June 25 June 22 July 11 June 25 June 22 July
Total soil water content
(mm) as measured with
TDR probe for the 0–80 cm
deep layer (1)
212 205 198 131 117 105
Soil water content (mm)
corresponding to the
wilting point for the 0–80 cm
deep layer as deduced
from ‘‘soil potential–water
content’’ curves (2)
53 53 53 42 42 42
Resulting soil water
content (mm) available
for plant (1–2)
159 152 145 89 75 63
Girth RGR (10
À3
day
À1
) 2.18 1.63 1.86 1.3 0.75 0.95
Batish et al./Ecological Basis of Agroforestry 43277_C013 Final Proof page 260 9.10.2007 9:35am Compositor Name: VAmoudavally
260 Ecological Basis of Agroforestry
Copyright 2008 by Taylor and Francis Group, LLC
T – G
0
10
20
30
40
Rainfall (mm)
−40
−30
−20
−10
0
10
20
30
40
−40
−30
−20
−10
0
10
20
30
40
Soil water content variations (mm)
0−20 cm
20−40 cm
40−60 cm
60−80 cm
09 Jul.
17 Jul.
22 Jul.
31 Jul.
06 Aug.
T + G
0
10
20
30
40
09 Jul.
17 Jul.
22 Jul.
31 Jul.
06 Aug.
Rainfall (mm)
Soil water content variations (mm)
(a)
(b)
FIGURE 13.4 Relative variations (according to the initial value at the beginning of the season) of volume soil
water content (mm) as measured by TDR probe at 2.2 m from tree trunk for the period around the 22 July 1997,
which was a dry one, according to rainfall events and treatment. (a) T À G and (b) T þ G. Each curve
corresponds to a soil layer.
TABLE 13.2
Mean Predaw n (c
p
) and Midday (c
m
) Leaf Water Potential for Trees and Grass (Dactylis
glomerata) for Two Dates in 1998 (see text for more details)
23 July 30 July
c
p
in Mpa (+SD) c
m
c
p
c
m
T – G À0.32 (0.05)
*
a
À1.64 (0.31) À0.28 (0.02)
*
a
À2.08 (0.26)
T þ G À0.74 (0.19) À1.77 (0.21) À0.57 (0.11) À1.92 (0.21)
Grass close to the tree
b
À2.98 (0.72) À3.77 (0.11) À0.84 (0.42) À2.75 (0.49)
Grass far from the tree À2.06 (1.41) À3.01 (0.30) À0.34 (0.08) À2.16 (0.12)
a
* Indicates a significant difference between TÀG and T þ G with a risk level of 5%.
b
Grass close to the tree is grass in a radius of 1 m around the tree trunk. Grass far from the tree is grass about 3 m from
the tree.
Batish et al./Ecological Basis of Agroforestry 43277_C013 Final Proof page 261 9.10.2007 9:35am Compositor Name: VAmoudavally
Root Competition for Water between Trees and Grass in a Silvopastoral Plot 261
Copyright 2008 by Taylor and Francis Group, LLC
to good rehydration during the night (i.e., the water balance between night and day was strongly
positive for T À G trees but near zero for T þ G trees).
Grass c
p
and c
m
for 23 July were strongly negative (Table 13.2). Grass located far from the tree
(3 m from the trunk) was always less stressed than grass close to the tree (1 m from the trunk)
although the relationship was not statistically significant because of a wide dispersion of the water
potential values for grass. After the 15 mm rainfall event betw een the two dates (23 and 30 July),
grass c
p
for 30 July reverted to a less negative value although c
m
values were always very negative
though increasing (Table 13.2). The trees did not benefit from this rainfall as much as the grass:
their c
p
values were barely less negative and their c
m
values were more negative than the values of
23 July.
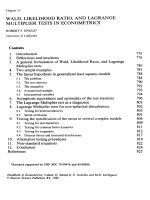
13.3.4 ROOT GROWTH
Rhizotron data showed that grass roots grew mainly in the first 60 cm of soil, with a peak in the
20–40 cm layer, but there were some roots growing even at a depth of 100 cm (Figure 13.6). Tree
roots grew mainly 20–80 cm deep, with a peak in the 40–60 cm layer but there were also some roots
growing at a depth of 100 cm. There was practically no tree root elongation in the top layer in
contrast to grass. Tree root elongation was high at 1.1 m from the trunk and decreased rapidly at 2.2
and 3.3 m from the trunk (Figure 13.6). Irrespective of the depth, the total length of the roots emitted
by the grass was much higher than that of the trees (Figure 13.7). The total root length of the grass
alone was higher than that of the grass under trees, and the T À G trees emitted longer roots than the
T þ G trees. Therefore, it seems that in the T þ G treatment, the soil space was a limiting factor and
both tree and grass root growth was limited. Although the grass root system was longer than the tree
root system, the roots of the trees grew faster than those of the grass (Figure 13.8), and it was the
0
4
8
12
16
187
188
189
190
191
192
193
194
195
196
197
198
199
200
201
202
203
204
205
206
207
208
209
Day number
Diameter increments (mm)
−0.6
−0.5
−0.4
−0.3
−0.2
−0.1
0
0.1
0.2
0.3
0.4
0.5
T − G
T
+ G
(night)
Contraction (mm) Growth (mm)
(day)
FIGURE 13.5 Tree diameter microvariations between 6 and 28 July 1998 for the T – G trees (thick line)
and the T þ G trees (thin line), each curve represents one tree, and in insert, comparison between the T – G and
T þ G tree diameter mean (and standard deviation) net growth during the night and contraction during the day
for three days (199, 200, and 201).
Batish et al./Ecological Basis of Agroforestry 43277_C013 Final Proof page 262 9.10.2007 9:35am Compositor Name: VAmoudavally
262 Ecological Basis of Agroforestry
Copyright 2008 by Taylor and Francis Group, LLC
T À G tree roots that had the highest growth rate. Lastly, the grass emitted a very high number of roots:
10 times more than the trees (Figure 13.9). Therefore, from Figures 13.6 through 13.9, one can
conclude that the grass had a very high number of roots but with a relative low growth rate,
concentrated in the upper horizons, and the tree emitted only a few roots but with a high growth
rate, mainly colonizing the deepest horizons.
Both tree and grass root growth was driven by the soil WA (Figures 13.10 and 13.11). When the
soil water content was greater than about 50 mm for a 20 cm depth layer, tree root RGR increased
significantly (Figure 13.10). In this figure, we can also see some low RGR at high water levels; they
corresponded to early and late low root growth in the season, that is, May and July (Figure 13.8).
Grass roots showed the same response to WA, and the maximum RGR was observed for deeper and
deeper horizons as the upper horizons became drier and drier as the season progressed (Figure 13.11).
In some particularly dry periods, we recorded some grass root deaths in the upper horizons, whereas a
high root growth rate was recorded for the deepest horizons (Figure 13.11).
0
10
20
30
0−20 20−40 40−60 60−80 80−100 100−120
Soil layer depth (cm)
Mean cumulated root daily
elongation (cm day
−1
)
sward root
tree root at 1.1 m
tree root at 2.2 m
tree root at 3.3 m
FIGURE 13.6 Mean cumulated root daily elongation (cm day
À1
) on the rhizotron window according to layer
depth of grass and tree of the T þ G treatment for the period from 1 May to 6 July 1998. Tree root elongation is
given for three distances from tree trunk. Vertical bar represents half the standard deviation.
0
2000
4000
6000
19 Apr. 9 May 29 May 18 Jun. 8 Jul. 28 Jul.
1999
Roots cumulated length (cm m
−2
)
Grass alone
Grass
under tree
T
− G
T
+ G
FIGURE 13.7 Root cumulated length (cm m
À2
) along the 1999 season as recorded on the rhizotron windows
for the different treatments.
Batish et al./Ecological Basis of Agroforestry 43277_C013 Final Proof page 263 9.10.2007 9:36am Compositor Name: VAmoudavally
Root Competition for Water between Trees and Grass in a Silvopastoral Plot 263
Copyright 2008 by Taylor and Francis Group, LLC
13.4 DISCUSSION
In this study on the interactions at the root level between 10 year old wild cherry and pasture, data
showed that there was clearly a separation of the soil horizons used by the two partners (niche separation
strategy, Casper and Jackson, 1997); the grass mainly grew in the upper layers and the tree in the deepest
layers, although there was not a strict separation between the two root systems. Moreover, the tree and
the grass displayed two different strategies in colonizing the soil space: the tree emitted a rather small
number of roots but they grew very fast; the grass emitted a very large number of roots but they grew
rather slowly. The length root density per soil volume unit was much greater for the grass than for the
trees in the T þ G association. The grass root density in the first layer was so abundant that it formed an
almost impenetrable cover (data not shown). In contrast, the tree roots were not very dense, but they
colonized the soil to a depth of more than 2 m (Lucot, 1997). Such a distribution of the root systems
0
0.2
0.4
0.6
0.8
19 Apr. 9 May 29 May 18 Jun. 8 Jul. 28 Jul.
1999
Root RGR (day
−1
)
T − G
T
+ G
Grass
FIGURE 13.8 Root relative growth rate (RGR, day
À1
) along the 1999 season as recorded on the rhizotron
windows for the different treatments. Each point corresponds to the RGR between two consecutive dates.
0
500
1000
1500
2000
2500
28 Apr. 12 May 26 May 9 Jun. 23 Jun. 7 Jul. 21 Jul.
1999
Number of roots m
−2
Grass
Tree
FIGURE 13.9 Cumulated number of roots for the trees and the grass along the 1999 season as recorded on the
rhizotron windows.
Batish et al./Ecological Basis of Agroforestry 43277_C013 Final Proof page 264 9.10.2007 9:36am Compositor Name: VAmoudavally
264 Ecological Basis of Agroforestry
Copyright 2008 by Taylor and Francis Group, LLC
in the soil between grasses and woody species has already been reported (by Dawson et al., 2001 for
very young wild cherries; by Burch et al., 1997 for a pine-hardwood forest; by Eastham et al., 1990
for E. grandis; and by Casper and Jackson, 1997 in a general way).
However, even with this different root distribution in the soil between the two plant types, the
presence of grass reduced tree diameter (and to a lesser extent, growth height) by at least 30% as
Soil water content (mm for 20 cm depth of soil)
T
+ G
T
− G
Root RGR (day
−1
, for a 20 cm depth horizon)
30 40 50 60 70 80
0
0.4
0.9
1.4
1.9
2.4
2.9
FIGURE 13.10 Tree root relative growth rate (RGR, day
À1
) calculated from the rhizotron windows for the
T þ G and T À G treatment in 1999 according to soil water availability (mm). Each point corresponds to a given
date and a given 20 cm depth soil layer and its corresponding soil water content.
−0.1
−0.05
0
0.05
0.1
0.15
0.2
27 Apr. 17 May 6 Jun. 26 Jun. 16 Jul.
1999
Grass root RGR (day
−1
)
0−20
20−40
40−60
60−80
80−100
+100
Horizon (cm)
Root death
Drought period
FIGURE 13.11 Grass root relative growth rate (RGR, day
À1
) calculated from the rhizotron windows for the G
treatment in 1999 according to the soil layer depth (0–20 cm, 20–40 cm, etc.).
Batish et al./Ecological Basis of Agroforestry 43277_C013 Final Proof page 265 9.10.2007 9:36am Compositor Name: VAmoudavally
Root Competition for Water between Trees and Grass in a Silvopastoral Plot 265
Copyright 2008 by Taylor and Francis Group, LLC
already noted in other studies or for other species (Monchaux, 1979; Frochot and Lévy, 1980; Collet
and Frochot, 1992; Le Goff et al., 1995; Cain, 1997; De Montard et al., 1999). In some circum-
stances of severe water deficit and especially for young trees with a poorly estab lished root system,
grass competition can even kill the tree (Balandier et al., 1997). The aboveground part of the tree
was not the only part that was affected by the presence of grass; tree root growth (and also grass root
growth) decreased in the wild cherry tree with grass treatment (T þ G), as observed for other species
(e.g., J. regia, Picon-Cochard et al., 2001).
This study provides new data concerning the mecha nisms that lead to tree water stress when
trees are planted with grass, even for 10 year old trees with deep roots, which ought to insure them
against water competition (Nambiar and Sands, 1993). The recorded data showed that the T þ G
trees were more strongly affected by water deficit than trees alone (T À G). In the case of severe
drought (available soil water content close to the wilting point, Table 13.1), the girth growth of the
T þ G trees sometimes stopp ed (RGR close to 0) and for higher values of soil water content, there
was a good relationship between tree girth RGR and soil water content (Equation 13.2). Even when
the drought was not very pronounced, different leaf water potentials between T À G and T þ G trees
were recorded, indicating that trees with grass were more stressed than trees alone. Therefore,
rainfall and grass seem to be very important in accounting for the water variations during the growth
season. Trunk diameter microvariations between night and day confirmed these observations and
showed that T À G trees grew better than T þ G trees even when drought increased (as demonstrated
by the increase in the trunk contraction range during the day). This indicated that T À G trees took
up more water than T þ G trees.
Volume soil water content in the 0–20 cm soil layer was the same in the T À G and bare soil
(BS) treatments, indicating that the tree took little water from this layer. Observations made with the
rhizotron confirmed this: whether associated or not with grass, tree roots were very weakly
developed in the upper soil layer. Tree roots were mainly distributed 20–80 cm deep, suggesting
that the trees took up water, essentially in those layers. Comparing c
p
with the mean soil water
potential of each layer (c
s
) (data not reported here) showed that the dynamics of c
p
tended to follow
those of c
s
for the 20–60 cm deep layers (Lucot, 1997). This suggests that the trees essentially
extracted water in the 20–60 cm deep soil layer, and confirms the analysis of the soil water content
time course and root localization in the soil. However, wild cherry can have roots as deep as 2 m in
the soil (Bienfait, 1995; Lucot, 1997). Consequently, it may be that in very pronounced water stress,
wild cherry can also stock up with water during the night from the very deep layers to survive
(Badot et al., 1994). Data recorded here support this possibility, at least for T À G trees: although the
leaf water potential was very negative during the day (to À2.50 MPa) and trunk microvariations
showed a strong contraction of the trunk indicating a pronounced water deficit, c
p
was close to zero
and the trunk increased notably during the night, indicating that the tree had found a water supply,
probably in the very deep layer. None of the methods we employed enabled us to record water
dynamics or root elongation in these very deep layers: we were not able to drive tubes for the TDR
measurements deeper than 0.8–1 m because of the presence of large stones in the deepest soil layers.
For practical reasons, rhizotrons were also limited to a depth of 1.2 m. This imposes a limit on this
study. The advantages and disadvantages of rhizotrons have already been discussed elsewhere
(Taylor et al., 1990). Another explanation for a pronounced water stress during the day and a water
recovery at night could be the very heterogeneous nature of the soil (numerous large stones); in this
case, some water ‘‘pockets’’ may have supplied the tree during the night but were not sufficient to
bear the transpiration flux during the day (Améglio and Archer, 1996).
Unlike the trees, the grass mainly colonized the 0–20 cm first soil layer and to a lesser extent the
deeper layers and displayed a greater total root elongation as also recorded in other studies (Nambiar
and Sands, 1993). This gave it an advantage in the uptake of rain water. As we recorded, soil water
content below the T À G tree increased following rainfall events, whereas it showed only few
variations for the T þ G treatments (Figure 13.4), grass roots close to the surface obviously removed
a large amount of rainfall water as shown by many other results in this study (e.g., the recording of the
Batish et al./Ecological Basis of Agroforestry 43277_C013 Final Proof page 266 9.10.2007 9:36am Compositor Name: VAmoudavally
266 Ecological Basis of Agroforestry
Copyright 2008 by Taylor and Francis Group, LLC
leaf water potentials after a small rainfall reported in Table 13.1 clearly shows that only the grass was
able to benefit from a small rainfall event: grass c
p
and c
m
were significantly less negative after the
rainfall event, whereas tree c
p
and c
m
hardly changed or even became more negative). Consequently,
the deepest soil horizons might have gradually dried up. Moreover, following Davies (1987) for other
tree species, even when tree and grass roots colonized the same soil layer, grass roots would absorb
water faster than tree roots, owing to their better physiological ability to take up and transport water
(Casper and Jackson, 1997). Lastly, as tree root growth is largely driven by the soil WA as shown in
this study, the grass, in taking up the rain water preferentially, could maintain a fairly high root growth
rate (Figure 13.11), allowing it to prospect more soil volume as soil dryness increased (Figure 13.11),
whereas tree roots in the deepest horizons were maintained at a low growth rate, owing to the water
uptake by grass roots, and so had a low potential for soil prospectin g.
The part played by the water in the interaction mechanism between tree and grass is shown here.
However, tree and grass growth are obviously influenced by other factors, associated or not with
water, such as nitrogen avail ability (De Montard et al., 1999). How nitrogen and water act together
remains to be studied: a low level of water can limit nitrogen uptake by plant roots, and a high level
of nitrogen can increase a tree’s resistance to drought.
13.5 CONCLUSION
As stated in Section 13.1, one of the principles of agroforestry is that the different components of the
system—here trees and grass—use different resources, or get resources from different locations or at
different times, so that the total available resources of the field are utilized. In this study on the
association betw een 10 year old wild cherry and pasture, this assumption seems to be justified, at
least at the root level, as there was clearly a separation of the soil horizons used by the two partners;
the grass mainly grew in the upper layers, and the tree in the deepest layers, although there was no
strict separation between the two root systems. Moreover, the tree and the grass displayed two
different strategies in colonizing the soil space: the tree emitted a rathe r small number of roots but
they grow very fast; the grass emitted a very large number of roots but they grew rather slowly.
Even so, when wild cherry trees are in the presence of grass, they can suffer severe competition for
water, even though they have roots in the deepest horiz on that grass roots cannot colonize. This may
be the consequence of an almost complete withdrawal of soil water coming from rainfall by the
grass roots in the upper soil layer, gradually drying up the deeper soil layers. Hence, the filling of all
the soil layers with water in spring is fundamental for tree growth and, in the case of severe water
deficit, tree survival. Of co urse in the worst water climate conditions, weeding the trees, and
particularly young trees, even in a small radius around the trunk, can favor better tree growth or
survival and so help optimize the agroforestry system.
ACKNOWLEDGMENTS
The authors thank A. Marquier, F. Landré, P. Massey, and J.M. Vallée for their technical contri-
butions in the field. The study was supported by grants from the Auvergne Region and the
Agricultural Ministry of France, Directo rate for Forests and Rural Environment (DERF), through
the AGRIFOR research programme.
REFERENCES
Améglio, T. and P. Archer. 1996. Représentativité du potentiel de base sur sols à humidité hétérogène.
Agronomie 16:493–503.
Améglio, T. and P. Cruiziat. 1992. Daily variations of stem and branch diameter: short overview from a
developed example. In Mechanics of Swelling, ed. T.K. Karalis, 193–204. H64 of NATO ASI. Springer:
Berlin, Heidelberg, New York.
Batish et al./Ecological Basis of Agroforestry 43277_C013 Final Proof page 267 9.10.2007 9:36am Compositor Name: VAmoudavally
Root Competition for Water between Trees and Grass in a Silvopastoral Plot 267
Copyright 2008 by Taylor and Francis Group, LLC
Anderson, L.S. and F.L. Sinclair. 1993. Ecological interactions in agroforestry systems. Agroforestry Abstracts
6(2):57–91.
Badot, P.M., E. Lucot and S. Bruckert. 1994. L’humidité du sol en profondeur constitue en milieu de journée la
principale source de variation du potentiel hydrique foliaire de peuplements de chêne (Quercus sp.). Les
Comptes Rendus de l’Académie des Sciences 317:341–345.
Baize, D. and B. Jabiol (eds.). 1995. Guide Pour la Description des Sols. Paris, France: INRA.
Balandier, P. 1997. A method to evaluate needs and efficiency of formative pruning of fast-growing broad-
leaved trees and results of an annual pruning. Canadian Journal of Forest Research 27:809–816.
Balandier, P. 2002. Symposium international sur les systèmes sylvo-pastoraux au Costa Rica: quels avantages
du sylvo-pastoralisme pour restaurer les pâturages tropicaux dégradés. Bois et Forêts des Tropiques
272(2):104–106.
Balandier, P. and C. Dupraz. 1999. The growth of widely spaced forest trees. A case study from recent
temperate agroforestry plantations in France. Agroforestry Systems 43:151–167.
Balandier, P., H. Rapey and J.L. Guitton. 1997. Improvement and sustainable development of medium altitude
areas through agroforestry: tree-grass-animal association. In Proceedings of the XI World Forestry Congress,
Vol. 1, 80. Italy: Food and Agricultural organisation; Antalya, Turkey: Ministry of Forestry of Turkey.
Balandier, P., H. Rapey, F. Ruchaud and F.X. De Montard. 2002. Agroforesterie en Europe de l’Ouest:
pratiques et expérimentations sylvopastorales des montagnes de la zone tempérée. Cahiers Agricultures
11:103–113.
Bienfait, D. 1995. L’enracinement du cerisier greffé sur Sainte-Lucie ou sur Franc: Eléments de morphologie
avec ou sans incidence du sol; observations et questions sur les relations enracinements-partie aérienne.
In La Racine et le Système Racinaire,31–41. Paris, France: INRA.
Boucher, J.F., S. Wetzel and A.D. Munson. 1998. Leaf level response of planted eastern white pine (Pinus strobus
L.) seven years after intense silvicultural treatments. Forest Ecology and Management 107:291–307.
Britt, J.R., R.J. Mitchell, B.R. Zutter, D.B. South, D.H. Gjerstad and J.F. Dickson. 1991. The influence of
herbaceous weed control and seedling diameter on six years of Loblolly Pine growth—a classical growth
analysis approach. Forest Science 37(2):655– 668.
Burch, W.H., R.H. Jones, P. Mou and R.J. Mitchell. 1997. Root system development of single and mixed plant
functional type communities following harvest in a pine-hardwood forest. Canadian Journal of Forest
Research 27:1753–1764.
Cain, M.D. 1997. Woody and herbaceous competition effects on the growth of naturally regenerated loblolly
and shortleaf pines through 11 years. New Forests 14:107–125.
Campbell, C.D., D. Atkinson, P.G. Jarvis and P. Newbould. 1994. Effects of nitrogen fertilizer on tree=pasture
competition during the establishment phase of a silvopastoral system. Annals of Applied Biology 124:83–
96.
Cannell, M.G.R., M. Van Noordwijk and C.K. Ong. 1996. The central agroforestry hypothesis: the trees must
acquire resources that the crop would not otherwise acquire. Agroforestry Systems 34:27–31.
Casper, B.B. and R.B. Jackson. 1997. Plant competition underground. Annual Review of Ecology and
Systematics 28:545–570.
Causton, D.R. and J.C. Venus. 1981. The Biometry of Plant Growth. London: Edward Arnold Publishers.
Coll, L., P. Balandier, C. Picon-Cochard, B. Prévosto and T. Curt. 2003. Competition for water and light
between beech seedlings and the surrounding vegetation in abandoned meadows colonized by woody
species. Annals of Forest Science 60:593–600.
Collet, C. and H. Frochot. 1992. Effet d’un abri latéral artificiel sur le développement de jeunes merisiers
(Prunus avium L.) installés en pépinière. Revue Forestière Française 44:85–90.
Collet, C., A. Ferhi, J.M. Guehl and H. Frochot. 1993. Growth, gas exchange and carbon isotope discrimination
in young Prunus avium trees growing with or without individual lateral shelters. Annals of Forest Science
50:353–362.
Collet, C., J.M. Guehl, H. Frochot and A. Ferhi. 1996. Effect of two forest grasses differing in their growth
dynamics on the water relations and growth of Quercus petraea seedlings. Canadian Journal of Botany
74:1562–1571.
Davies, R.J. (ed.). 1987. Trees and Weeds: Weed Control for Successful Tree Establishment. Forestry
Commission Handbook 2. London, England: HMSO Publications.
Davis, M.A., K.J. Wrage, P.B. Reich, M.G. Tjoelker, T. Schaeffer and C. Muermann. 1999. Survival, growth,
and photosynthesis of tree seedlings competing with herbaceous vegetation along a water-light-nitrogen
gradient. Plant Ecology 145:341–350.
Batish et al./Ecological Basis of Agroforestry 43277_C013 Final Proof page 268 9.10.2007 9:36am Compositor Name: VAmoudavally
268 Ecological Basis of Agroforestry
Copyright 2008 by Taylor and Francis Group, LLC
Dawson, L.A., E.I. Duff, C.D. Campbell and D.J. Hirst. 2001. Depth distribution of cherry (Prunus avium L.)
tree roots as influenced by grass root competition. Plant and Soil 231:11–19.
De Montard, F.X., P. Balandier, H. Rapey, F. Lucot and J.P. Drouot. 1999. Compétition pour l’azote entre arbre
et herbe dans des plantations de noisetier (Corylus avellana L.) et de merisier (Prunus avium L.). In Bois
et Forêt des Agriculteurs, ed. F. Caillez and E. Lecomte, 73–94. Antony, France: Cemagref.
Dupraz, C., V. Simorte, M. Dauzat, G. Bertoni, A. Bernadac and P. Masson. 1999. Growth and nitrogen status
of young walnuts as affected by intercropped legumes in a Mediterranean climate. Agroforestry Systems
43:71–80.
Eastham, J. and C.W. Rose. 1990. Tree=pasture interactions at a range of tree densities in an agroforestry
experiment. I. Rooting patterns. Australian Journal of Agricultural Research 41:683–695.
Eastham, J., C.W. Rose and D.A. Charles-Edwards. 1990. Planting density effects on water use efficiency of
trees and pasture in an agroforestry experiment. New Zealand Journal of Forest Science 20(1):39–53.
Franco, J.A. and J.M. Abrisqueta. 1997. A comparison between minirhizotron and soil coring methods of
estimating root distribution in young almond trees under trickle irrigation. Journal of Horticultural
Science 72(5):797–805.
Frochot, H. and G. Lévy. 1980. Facteurs limitants de la croissance initiale d’une plantation de merisier (Prunus
avium L.) sur rendzine brunifiée. Annals of Forest Science 37(3):239–248.
Gallet, C. and F. Pellissier. 2002. Interactions allélopatiques en milieu forestier. Revue Forestière Française
54(6):567–576.
Girardin, N. 1994. Caractérisation des Relations de Compétition Pour L’eau Entre de Jeunes Arbres (Prunus
avium L.) et Deux Types de Cultures Fourragères Intercalaires: Le Sainfoin (Onobrychis sativa L.) et la
Fétuque Élevée (Festuca eliator L.). Montpellier, France: INRA, 25 pp.
Jäderlund, A., O. Zackrisson, A. Dahlberg and M.C. Nilsson. 1997. Interference of Vaccinium myrtillus on
establishment, growth, and nutrition of Picea abies seedlings in a northern boreal site. Canadian Journal
of Forest Research 27:2017–2025.
Johnson, J.E., S.G. Lindow and R. Rogers. 1998. Light, soil, and seedling characteristics associated with
varying levels of competition in a red pine plantation. New Forests 15:23–36.
Kelty, M.J. 1992. Comparative productivity of monocultures and mixed-species stands. In The Ecology and
Silviculture of Mixed-Species Forests, ed. M.J. Kelty, 125–141. Dordrecht, the Netherlands: Kluwer
Academic Publishers.
Larson, M.M. and G.H. Schubert. 1969.
Root Competition between Ponderosa Pine Seedlings and Grass.
Research paper RM-54. Fort Collins, CO: USDA Forest Service.
Le Goff, N., A. Hautot and F. Ningre. 1995. Growth and development of young stands of ash (Fraxinus
excelsior L.) and wild cherry (Prunus avium L.). In Production of Quality Wood from Broadleaves, ed.
A. Dohrenbusch, 19–24. Final Report of a European contract, AIR1-CT92–0608, Task 3. Germany:
Göttingen University.
Löf, M. 2000. Establishment and growth in seedlings of Fagus sylvatica and Quercus robur:influence of
interference from herbaceous vegetation. Canadian Journal of Forest Research 30:855–864.
Lopez, B., S. Sabaté and C. Gracia. 1996. An inflatable minirhizotron system for stony soils. Plant and Soil
179:255–260.
Lucot, F. 1997. Ecophysiologie du Douglas (Pseudotsuga menziesii (Mirb.) Franco) et du Merisier (Prunus
avium L.). Analyse Bibliographique et Étude in situ de la Relation Entre Croissance et Partage des
Ressources. Clermont-Ferrand, France: Cemagref.
Mastrorilli, M., N. Katerji, G. Rana and B. Ben Nouna. 1998. Daily actual evapotranspiration measured with
TDR technique in Mediterranean conditions. Agricultural and Forest Meteorology 90:81–89.
Méloni, S. 1999. A simplified description of the three-dimensional structure of agroforestry trees for use with a
radiative transfer model. Agroforestry systems 43(1–3):121–134.
Miller, B.J., P.W. Clinton, G.D. Buchan and A.B. Robson. 1998. Transpiration rates and canopy conductance
of Pinus radiata growing with different pasture understories in agroforestry systems. Tree Physiology
18:575–582.
Mohammed, G.H., T.L. Noland and R.G. Wagner. 1998. Physiological perturbation in jack pine (Pinus banksiana
Lamb.) in the presence of competing herbaceous vegetation. Forest Ecology and Management 103:77–85.
Monchaux, P. 1979. Contribution à L’étude du Merisier. Nancy, France: ENGREF.
Nambiar, E.K.S. and R. Sands. 1993. Competition for water and nutrients in forests. Canadian Journal of
Forest Research 23:1955–1968.
Batish et al./Ecological Basis of Agroforestry 43277_C013 Final Proof page 269 9.10.2007 9:36am Compositor Name: VAmoudavally
Root Competition for Water between Trees and Grass in a Silvopastoral Plot 269
Copyright 2008 by Taylor and Francis Group, LLC
Picon-Cochard, C., A. Nsourou-Obame, C. Collet, J.M. Guehl and A. Ferhi 2001. Competition for water
between walnut seedlings (Juglans regia) and rye grass (Lolium perenne) assessed by carbon isotope
discrimination and d
18
O enrichment. Tree Physiology 21:183–191.
Pisanelli, A., P. Paris, L. Todaro, G. Olimpieri and F. Cannata. 1997. Early responses in growth and soil-plant
water relations of common walnut (Juglans regia L.) intercropped with subterranean clover (Trifolium
subterranean L.). In Proceedings of the XI World Forestry Congress, Vol. 1, 4. Rome, Italy: Food and
Agricultural Organisation; Antalya, Turkey: Ministry of Forestry of Turkey.
Qasem, J.R. and C.L. Foy. 2001. Weed allelopathy, its ecological impacts and future prospects: a review.
In Allelopathy in Agroecosystems, ed. R.K. Kohli, H.P. Singh and D.R. Batish, 43–120. New York: Food
Product Press.
Ruchaud, F. 1995. Caractérisation autécologique et sylvicole des feuillus précieux. Ingénierie—EAT 4:33–42.
Scholander, P.F., H.T. Hammel, E.D. Bradstreet and E.A. Hemmingsen. 1965. Sap pressure in vascular plants.
Science 148:339–346.
Scholes, R.J. and S.R. Archer. 1997. Tree-grass interactions in Savannas. Annual Review of Ecology and
Systematics 28:517–544.
Taylor, H.M., D.R. Upchurch and B.L. McMichael. 1990. Applications and limitations of rhizotrons and
minirhizotrons for root studies. Plant and Soil 129:29–35.
Todoroff, P. and P. Langellier. 1994. La réflectométrie temporelle: une nouvelle approche des mesures
d’humidité du sol. Agriculture et développement 3:32–37.
Vogt, K.A., D.J. Vogt and J. Bloomfield. 1998. Analysis of some direct and indirect methods for estimating
root biomass and production of forests at an ecosystem level. Plant and Soil 200:71–89.
Werkhoven, C. 1993. Time-domain reflectometry and tensiometers for detecting soil moisture content.
In International Symposium on Irrigation of Horticultural Crops, ed. J. Lopez-Galvez. Acta Horticul-
turae 335:491–496.
Yunusa, I.A.M., D.J. Mead, K.M. Pollock and R.J. Lucas. 1995. Process studies in a Pinus radiata—pasture
agroforestry system in a subhumid temperate environment. Parts I and II. Agroforestry Systems
32:163–204.
Batish et al./Ecological Basis of Agroforestry 43277_C013 Final Proof page 270 9.10.2007 9:36am Compositor Name: VAmoudavally
270 Ecological Basis of Agroforestry
Copyright 2008 by Taylor and Francis Group, LLC