Environmental Sampling and Analysis for Metals - Chapter 7 docx
Bạn đang xem bản rút gọn của tài liệu. Xem và tải ngay bản đầy đủ của tài liệu tại đây (325.13 KB, 18 trang )
103
Atomic Absorption
Spectrometry
7.1 INTRODUCTION
7.1.1 A
TOMIC SPECTROMETRY (AS)
As discussed previously, AS is a class of elemental analysis techniques that use the interaction of
electromagnetic radiation with atoms or ions to detect the presence of elements of interest.
7.1.2 ATOMIC ABSORPTION (AA)
Atomic absorption occurs when a ground-state atom absorbs energy in the form of light of a specific
wavelength and is elevated to an excited state. The amount of light energy absorbed at this wave-
length increases as the number of atoms of the selected element in the light path increases. The rela-
tionship between the amount of light absorbed and the concentration of analyte present in known
standards can be used to determine unknown concentrations by measuring the amount of light ab-
sorbed. Instrument readouts can be calibrated to directly display concentrations.
7.1.3 ATOMIC ABSORPTION SPECTROMETRY (AAS)
Atomic absorption spectrometry is an element analysis technique that uses absorption of electromag-
netic radiation to detect the presence of the elements of interest. Molecular spectrophotometry and
working techniques were discussed in Chapter 6; this chapter focuses on analytical methods using
atomic spectra. This technique has been applied to the determination of numerous elements and is a
major tool in studies involving trace metals in the environment and in biological samples. It is also fre-
quently useful in cases where the metal is at a fairly high concentration level in the sample but only a
small sample is available for analysis, which sometimes occurs with metalloproteins, for example. The
first report of an important biological role for nickel was based on a determination via AA that the ure-
ase enzyme, at least in certain organisms, contains two nickel ions per protein molecule.
Light absorption is measured and related to element concentration in both AAS and molecular
spectrophotometry (see Chapter 6). The major differences lie in instrument design, especially with
respect to the light source, sample cell, and placement of the monochromator. As outlined in previ-
ous chapters, the absorption of light by individual, nonbonded atoms must be considered separately
from molecular absorption. In atoms, all energy transitions are electronic; therefore, only individual,
discrete, electronic transitions are possible. Consequently, atomic spectra are made up of lines, which
are much sharper than the bands observed in molecular spectroscopy. Each discrete energy increase
is due to the absorption of the wavelength corresponding to an energy transition; therefore, only those
wavelengths are absorbed, and only those wavelengths show up in the atomic spectrum, or
line spec-
trum
. Atomic absorption spectra are produced when the free atoms absorb radiant energy at charac-
teristic wavelengths. To produce an atomic spectrum, a compound must first absorb enough energy
to vaporize it to a molecular gas and dissociate the molecules into free atoms. Because the amount of
7
© 2002 by CRC Press LLC
104 Environmental Sampling and Analysis for Metals
light absorbed by a sample is proportional to the concentration of the absorbing species, light ab-
sorption can be used in quantitative analytical chemistry.
Metals in solution can be readily determined by AAS. The method is simple, rapid, and applica-
ble to a large number of metals in different samples. While drinking water that is free of particulate
matter can be analyzed directly, samples containing suspended material, sludge, sediment, and other
solids are analyzed after proper pretreatment. Sample preparations are discussed in Chapter 15.
7.1.3.1 Atomic Absorption Measurement
The light of a wavelength, which is characteristic of the element of interest, is beamed through an
atomic vapor. Some of this light is then absorbed by the atoms of the element. The amount of light
that is absorbed by these atoms is then measured and used to determine the concentration of that el-
ement in the sample. The use of special light sources and careful selection of wavelengths allow the
specific quantitative determination of individual elements in the presence of others. The atom cloud
required for atomic absorption measurements is produced by supplying enough thermal energy to the
sample to dissociate the chemical compounds into free atoms. Aspirating a solution of the sample
into a flame aligned in the light beam serves this purpose. Under the proper flame conditions, most
of the atoms will remain in the ground-state form and are capable of absorbing light at the analytical
wavelength from a source lamp. The light is then directed onto the detector where the reduced in-
tensity is measured.
7.2 STEPS IN THE ATOMIC ABSORPTION PROCESS
The solvent is evaporated or burned, and the sample compounds are thermally decomposed and con-
verted into a gas of the individual atoms present. The atoms of this element in the
flame absorb light
only from the
hollow-cathode source that emits the characteristic wavelength of the single element
being determined. Some of the light is absorbed and the rest passes through. The amount of light ab-
sorbed depends on the number of atoms in the light path. The selected spectral line from the light
beam is isolated by a
monochromator. The wavelength of light selected by the monochromator is di-
rected onto the
detector. The detector is a photomultiplier tube that produces an electrical current de-
pendent on the light intensity. The electrical current from the photomultiplier is then amplified and
processed by the instrument electronics to produce a signal that is a measure of the light attenuation
occurring in the sample cell. This signal can be further processed to produce an instrument
readout
directly in concentration units. Steps of the above process are described in the following sections.
7.2.1 NEBULIZATION
Aspirate the sample into the burner chamber. The sample becomes an aerosol and mixes with the fuel
and oxidant gases. In this step the metals are still in solution in the fine aerosol.
7.2.2 EVAPORATION OR DESOLVATION
The aerosol droplets move into the heat of the flame, where the solvent is evaporated and solid par-
ticles of the sample remain.
7.2.3 LIQUEFACTION AND VAPORIZATION
Heat is applied and the solid particles are liquefied. With additional heat, the particles will vaporize.
At this point, the metal of interest (analyte) still contains anions to form molecules.
© 2002 by CRC Press LLC
Atomic Absorption Spectrometry 105
7.2.4 ATOMIZATION
By applying more heat, the molecules are broken down and individual atoms form.
7.2.5 EXCITATION AND IONIZATION
The ground-state atoms formed during the atomization step will excite and determine the amount of
light absorbed. Concentration is determined by comparing the absorbance of the sample to standards
with known concentrations.
7.3 ATOMIC ABSORPTION SPECTROPHOTOMETER COMPONENTS
7.3.1 LIGHT SOURCE
As indicated previously, an atom absorbs light at discrete wavelengths. To measure this narrow light
absorption with maximum sensitivity, it is necessary to use a light source that emits specific wave-
lengths which can be absorbed by the atom. In other words, the light emitted from the lamp should
be exactly the light required for the particular analysis. To satisfy this criterion, the atoms of the ele-
ment tested are present in the lamp. When the lamp is on, these atoms are supplied with energy that
causes them to enter into
excited states. When the promoted atoms return to their ground state, the
light energy will be emitted at the wavelength characteristic to the metal. Thus, each metal analyzed
requires a separate source lamp. The most common light sources used in atomic absorption are the
hollow cathode lamp and the electrodeless discharge lamp.
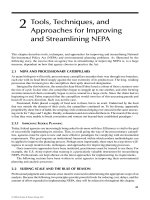
The
hollow cathode lamp (HCL) is an evacuated glass tube filled with either neon or argon gas.
The HCL is illustrated in Figure 7.1. The
cathode (− charged electrode), which is made of the metal
to be determined, and the
anode (+ charged electrode) are sealed in the tube. A window, transparent
to the emitted radiation, is at the end of the tube. When the lamp is on, an electrical potential is applied
between the anode and cathode, and the gas atoms are ionized. The actively charged gas ions collide
with the cathode and liberate metal atoms. These atoms are excited by the energy liberated through the
collision. By returning to the ground state, the atoms emit light energy as described above. HCLs have
a limited lifetime. Because of the rapid vaporization of the cathode for volatile metals, such as arsenic
(As), selenium (Se), and cadmium (Cd), the lifetime of these lamps is especially short.
It is possible to construct a cathode from several metals. This kind of lamp is called a
multi-
element lamp. The intensity of emission for an element in a multielement lamp is not as great as that
observed for the element in a single-element lamp. Thus, special consideration is necessary before using
multielement lamps in applications where high precision and low detection limits are necessary.
Anode
Window
Cathode
Fill gas
Ar
FIGURE 7.1 Hollow cathode lamp.
© 2002 by CRC Press LLC
106 Environmental Sampling and Analysis for Metals
In some applications — primarily in the determination of volatile elements — the resistivity of
the HCL is not satisfactory. The analytical performance of these elements by AA can be improved
dramatically by using
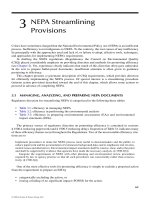
electrodeless discharge lamps (EDLs). EDLs offer the analytical advantages
of better precision and lower detection limits. In addition to providing superior performance, the use-
ful lifetime of an EDL is much longer than that of a HCL for the same element. EDL design is illus-
trated in Figure 7.2. A small amount of the metal or its salt is sealed inside a quartz bulb. The bulb is
placed inside a ceramic holder on which the antenna from a radio frequency (RF) generator is coiled.
When an RF field of sufficient power is applied, the coupled energy will vaporize and excite the
atoms inside the bulb, causing them to emit their characteristic spectrum. An accessory power sup-
ply is required to operate an EDL.
7.3.2 FLAMES
In order for the atomic absorption process to occur, individual atoms must be produced from the sam-
ple, which starts out as a solution of ions. The function of the flame is to evaporate the solvent, de-
compose and dissociate molecules, and provide ground-state atoms for absorption of the emitted ra-
diation. All flames require both a fuel and an oxidant.
The two flames used for AA are air–acetylene and nitrous oxide (N
2
O)–acetylene. In the case of
air–acetylene flames, acetylene is the fuel and air is the oxidant. The temperature is 2130 to 2400°C.
In the
nitrous oxide–acetylene flame, acetylene is the fuel but nitrous oxide is used as an oxidant. The
temperature of this flame is 2600 to 2800
°C.
While the air–acetylene flame is satisfactory for the majority of elements determined by atomic
absorption spectrophotometry, the hotter nitrous oxide–acetylene flame is required for many refrac-
tory-forming elements. The recommended flame used for any given element is available in reference
books or in the application manual issued by the manufacturer of the instrument.
7.3.3 NEBULIZER AND BURNER
Typically, the nebulizer (often called atomizer) and burner comprise a single unit.
7.3.3.1 Nebulizer
The purpose of the nebulizer is to suck up the sample and spray it into the flame at a constant and re-
producible rate. In order to provide for the most efficient nebulization for variable sample solution
systems, the nebulizer should be adjustable. The most common material of the nebulizer is stainless
steel, but this material corrodes in contact with highly acidic samples. A nebulizer made of corrosion-
resistant materials, such as plastic or
platinum–rhodium alloy, is preferable.
RF Coil
Lamp
Ceramic
Holder
Quartz
Window
FIGURE 7.2 Electrodeless discharge lamp.
© 2002 by CRC Press LLC
Atomic Absorption Spectrometry 107
7.3.3.2 Burner
Two basic types of burner are used in atomic absorption spectrophotometers: “total consumption
burner” and “premix burner.”
• In the
total consumption burner, the channels of the fuel gas, oxidizing gas, and sample
meet in a single opening at the base of the flame. The resulting flame is turbulent and non-
homogeneous. This type of burner is used in flame photometry.
• The
premix burner produces a quieter flame that is less turbulent and homogenous; there-
fore, it is preferable in atomic absorption.
The sample is nebulized and mixed with the fuel and oxidant before introducing it to the flame.
Only the finest droplets of the nebulized sample enter the flame; the larger droplets are caught and
rejected through a drain. The drain uses a liquid trap to prevent combustion gases from escaping
through the drain line.
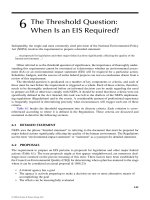
To deflect larger droplets and remove them from the burner through the drain, an
impact device
is placed in the front of the nebulizer. The impact device can be a flow spoiler or a glass or ceramic
spoiler
. For routine work, a chemically inert flow spoiler is preferred; glass beads may be used in
cases where additional sensitivity is needed. Components of an atomic absorption burner system are
shown in Figure 7.3.
Burner heads are constructed of titanium to provide extreme resistance to heat and corrosion. For
various types of flames, diverse burner-head geometries are required. For the air–acetylene flame, a
10-cm, single-slit burner head is used, and, for the nitrous oxide–acetylene flame, a 5-cm slit burner
head
is recommended.
7.3.4 OPTICS AND MONOCHROMATOR SYSTEM
The function of the monochromator is to isolate a single line of the analyte’s spectrum. Light from the
source must be focused on the sample cell and directed to the monochromator at the entrance slit and
then directed to the
grating where dispersion takes place. The grating consists of a reflective surface
with many fine, parallel lines very close together. Reflection from this surface generates an interference
known as
diffraction, in which different wavelengths of light diverge from the grating at different
Flow Spoiler
Impact Bead
Mixing Chamber
With Burner Head
End Cap
Nebulizer
FIGURE 7.3 Premix burner system.
© 2002 by CRC Press LLC
108 Environmental Sampling and Analysis for Metals
angles. By adjusting the angles of the grating, a selected emission light from the source is allowed to
pass through the exit slit and focuses on the detector. Curved mirrors within the monochromator com-
prise the focusing control of the source lamp. A typical monochromator design is shown in Figure 7.4.
The size of the entrance and exit slits should be the same. The size of the slit is variable and ad-
justed for each element analyzed, according to recommendations by the instrument manufacturer and
pertinent reference materials.
7.3.5 DETECTOR
The detector measures the light intensity and transfers it to the readout system. The detector is a mul-
tiplier phototube, or photomultiplier (PM) tube.
7.3.6 READOUT SYSTEM
As with molecular spectrophotometry, the readout of the absorbance and transmittance data consists
of a meter, recorder, or both. Modern atomic absorption instruments include microcomputer-based
electronics. Figure 7.5 shows the basic components of an atomic absorption spectrophotometer.
Exit slit
Photomultiplier
Entrance slit
Grating
FIGURE 7.4 A monochromator.
Light chopper
Flame
Source
Fuel
Air
Sample
Monochromator
Readout
Detector
Light chopper
Flame
Source
Fuel
Air
Sample
Monochromator
Readout
Detector
FIGURE 7.5 Basic AA instrument.
© 2002 by CRC Press LLC
Atomic Absorption Spectrometry 109
7.3.7 AUTOMATIC SAMPLERS
Automatic samplers offer labor and time savings and thus speed up the analytical process.
7.3.8 AUTOMATED MULTIELEMENT AA INSTRUMENTS
These instruments set up parameters to preprogrammed values and make it possible to analyze mul-
tiple elements in a tray full of samples without operator intervention.
7.3.9 MICROCOMPUTER-BASED ELECTRONICS
Most modern instruments include microcomputer-based electronics. AA instruments are provided
with calculation and calibration abilities. Computers can be connected to the instrument output ports
to receive, manipulate, and store data and to print reports of calculations.
7.4 SINGLE- AND DOUBLE-BEAM INSTRUMENTS
The differences between single- and double-beam spectrophotometers were discussed in Chapter 6. In
the AA technique, the double-beam optical design is generally preferable. Double-beam technology,
which automatically compensates for source and common electronics drift, allows these instruments
to begin the analysis immediately after the installation of the lamp, with little or no warm-up. This not
only reduces analysis time but also prolongs lamp life, as lamp warm-up time is eliminated. Optimized
double-beam instruments offer excellent performance, high-speed automation benefits, and opera-
tional simplicity. Schematic outlines of the single- and double-beam spectrophotometers are shown in
Figures 6.4 and 6.5, respectively.
7.5 ATOMIC ABSORPTION MEASUREMENT TERMS
7.5.1 C
ALIBRATION
Calibrations are performed at the beginning of the analysis to ensure that the instrument is working
properly. Calibrations must be performed according to the analytical methods to be used.
Initial cal-
ibration is determined for each parameter tested and based on the instrument responses for different
concentrations of standards, known as
calibration standards. The number and optimum concentra-
tion range of the calibration standards used for each particular method are provided by the approved
methodology. A minimum of a blank and three standards must be utilized for calibration. Calibration
varies according to the type and model of the equipment. Detailed operation and calibration proce-
dures for each instrument are available in the laboratory’s standard operation procedures (SOPs) and
the manufacturer’s instructions. The instrument response should be linear with the concentration of
the introduced standards and plot on a calibration curve, or the instrument software should automat-
ically prepare a curve. Details of calibration curve preparation and the calibration process are pro-
vided in Chapter 6.
Calibration accuracy during each analytical run should be ensured via
continuing calibration.
The continuing calibration standard represents the midpoint initial calibration standard. To confirm
the calibration curve and to verify the accuracy of the standards and the calibration, run a standard
prepared from another source as the calibration standards. Prepare standard solutions of known metal
concentrations in water with a matrix similar to the sample.
For samples containing high and variable concentrations of matrix materials, make the major
ions in the sample and the standards similar. If the sample matrix is complex and components can-
not be matched accurately with standards, use the method of standard addition (see Section 7.7.1). If
© 2002 by CRC Press LLC
110 Environmental Sampling and Analysis for Metals
digestion or another method is used for sample preparation (see Chapter 15), carry standards through
the same procedure used for samples.
The range of concentrations over which the calibration curves for an analyte are linear is called
the
linear dynamic range. The highest concentration for an analyte that will result in a linear ab-
sorption signal response is the
maximum linear concentration.
7.5.2 CONCENTRATION
When the absorbance of standard solutions containing known concentrations of analyte are measured
and the absorbance data plotted against the concentration, a calibration relationship is established.
(See calibration details in Section 6.6.) Directly proportional behavior between absorbance and con-
centration (Beer’s law, see Section 5.5) is observed in atomic absorption.
After such calibration, the absorbance of solutions of unknown concentrations may be measured
and the concentration determined from the calibration curve. In modern instrumentation, the cali-
bration can be made within the instrument to provide a direct readout of unknown concentrations.
Built-in microcomputers make accurate calibration possible, even in the nonlinear region.
7.5.3 SENSITIVITY
Sensitivity or “characteristic concentration” is a convention for defining the magnitude of the ab-
sorbance signal that will be produced by a given concentration of analyte. For flame absorption, this
term is expressed in milligrams per liter (mg/l) required to produce a 1% absorption (0.0044 ab-
sorbance) signal:
Sensitivity (mg/l) = concentration of standard
× 0.0044/measured absorbance (7.1)
7.5.4 DETECTION LIMIT (DL)
The DL is the smallest measurable concentration at which the analyte can be detected with a specific
degree of certainty. The detection limit may be defined as the concentration that will give an ab-
sorbance signal of two (sometimes three) times the magnitude of the baseline noise. The baseline
noise can be statistically quantitated by making ten or more replicate measurements of the baseline
absorbance signal observed for an analytical blank (reagent blank) and determining the standard de-
viation of the measurements. Therefore, the DL is the concentration that will produce an absorbance
signal twice (or three times) the standard deviation of the blank.
Details of the method detection limit, instrument detection limit, and practical detection limit
(PDL) are provided in Section 13.8.
7.5.5 OPTIMUM CONCENTRATION RANGES
The optimum concentration range usually starts from the concentration of several times the sensitiv-
ity and extends to the concentration at which the calibration curve starts to flatten. To achieve best
results, use concentrations of samples and standards within the optimum concentration ranges.
Sensitivity, detection limits, and optimum ranges vary according to complexity of the matrix, element
determined, instrument models, and technique. Table 7.1 shows detection limits obtainable by direct
aspiration and furnace techniques for 34 metals.
The concentration range may be extended downward by scale expansion, and extended upward
by dilution, using a less sensitive wavelength, rotating the burner head, or utilizing a microprocessor
to linearize the calibration curve at high concentrations. Detection limits by direct aspiration may
also be extended through concentration of the sample. Lower concentrations may also be detected by
© 2002 by CRC Press LLC
Atomic Absorption Spectrometry 111
TABLE 7.1
Atomic Absorption Concentration Ranges
a
Flame AA Graphite AA
Detection Optimum Detection Optimum
Limit Concentration Limit Concentration
Metal (mg/l) Range (mg/l) (µg/l) Range (µ/l)
Aluminum 0.1 5–50 3 20–200
Antimony 0.2 1–40 3 20–200
Arsenic
b
0.002 0.002–0.02 1 5–100
Barium (p) 0.1 1–20 2 10–200
Beryllium 0.005 0.005–2 0.2 1–30
Cadmium 0.005 0.05–2 0.1 0.5–10
Calcium 0.01 0.2–7 ——
Chromium 0.05 0.5–10 1 5–100
Cobalt 0.05 0.5–515–100
Copper 0.02 0.2–515–100
Gold 0.1 0.5–20 1 5–100
Iridium (p)3 20–500 30 100–1500
Iron 0.03 0.3–515–100
Lead 0.1 1–20 1 5–100
Magnesium 0.01 0.02–0.5 ——
Manganese 0.01 0.1–3 0.2 1–30
Mercury
c
0.0002 0.0002–0.1 ——
Molybdenum (p) 0.1 1–40 1 3–60
Nickel (p) 0.04 0.3–515–100
Osmium 0.3 2–100 20 50–500
Palladium (p) 0.1 0.5–15 5 20–400
Platinum (p) 0.2 5–75 20 100–2000
Potassium 0.01 0.1–2 ——
Rhenium (p)5 50–1000 200 500–5000
Rhodium (p) 0.05 1–30 5 20–400
Ruthenium 0.2 1–50 20 100–2000
Selenium (2)
b
0.002 0.002–0.02 2 5–100
Silver 0.01 0.1–4 0.2 1–25
Sodium 0.02 0.03–1 ——
Thallium 0.1 1–20 1 5–100
Tin 0.8 10–300 5 20–300
Titanium (
p) 0.4 5–100 10 50–500
Vanadium (
p) 0.2 2–100 4 10–200
Zinc 0.005 0.05–1 0.05 0.2–4
Note: The listed furnace values are expected when using a 20-µl injection and normal gas flow except in the cases of As and
Se where gas interrupt is used. The
p indicates use of pyrolytic graphite with the furnace procedure.
a
The concentrations shown should be obtainable with any good-quality AAS.
b
Gaseous hydride method.
c
Cold-vapor technique.
© 2002 by CRC Press LLC
112 Environmental Sampling and Analysis for Metals
using furnace techniques. In cases where flame AAS does not provide adequate sensitivity, special-
ized furnace procedures are used, such as the gaseous hydride method (see Section 7.6.3 and Chapter
11) for arsenic and selenium, the cold vapor technique (see Section 7.6.4 and Chapter 10) for mer-
cury, and the chelation-extraction procedure (see Section 7.6.2). Table 7.1 contains the detection lim-
its and optimum concentration ranges of atomic absorption spectrophotometers.
7.6 TECHNIQUES IN AAS MEASUREMENT
Atomic absorption is a mature analytical technique. Interferences are well documented and, for the
most part, easy to control. Various atomizer alternatives make atomic absorption one of the most ver-
satile analytical techniques, capable of determining a great number of elements over wide concen-
tration ranges.
7.6.1 DIRECT-ASPIRATION OR FLAME ATOMIC ABSORPTION
SPECTROPHOTOMETRY (FAAS)
In direct-aspiration atomic absorption or flame atomic absorption spectrophotometry (FAAS), a sam-
ple is aspirated and atomized in a flame. A light beam from a hollow cathode lamp (HCL) or an elec-
trodeless discharge lamp (EDL) is directed through the flame into a monochromator and onto a de-
tector that measures the amount of absorbed light. Absorption depends on the presence of free ex-
cited ground-state atoms in the flame. Because the wavelength of the light beam is characteristic of
only the metal being determined, the light energy absorbed by the flame is a measure of the concen-
tration of that metal in the sample. This principle is the basis of AAS. Flames used in the FAAS tech-
nique are discussed in Section 7.3.2, and details of the technique appear in Chapter 8.
7.6.2 CHELATION-EXTRACTION METHOD
Many metals at low concentrations — including Cd, Cr, Co, Cu, Fe, Pb, Mn, Ni, Ag, and Zn — can
be determined by the chelation-extraction technique. A chelating agent, such as
ammonium pyrroli-
dine dithiocarbamate
(APDC), reacts with the metal, forming the metal chelate that is then extracted
with methyl isobutyl ketone (MIBK). An aqueous sample of 100 ml is acidified to a pH 2 to 3 with
1 ml of 4% APDC solution. The chelate is extracted with MIBK by shaking the solution vigorously
for 1 min. If an emulsion formation occurs at the interface of the water and MIBK, use anhydrous
sodium sulfate (Na
2
SO
4
). The extract is aspirated directly into the air–acetylene flame. APDC
chelates of certain metals such as Mn are not very stable at room temperature. Therefore, analysis
should commence immediately after extraction.
The chelation-extraction method determines Cr in the hexavalent state. In order to determine total
Cr, the metal must be oxidized with potassium permanganate (KMnO
4
) at boiling temperature and the
excess KMnO
4
is destroyed by hydroxylamine hydrochloride prior to chelation and extraction.
Low concentrations of Al and Be can be determined by chelating with 8-hydroxyquinoline and
extracting the chelates into MIBK and aspirating into an N
2
O–acetylene flame.
Calibration standards of the metal are similarly chelated and extracted in the same manner, and
the absorbances are plotted against concentrations.
7.6.3 HYDRIDE GENERATION METHOD
Samples are reacted in an external vessel with a reducing agent, usually sodium borohydride.
Gaseous reaction products are then carried to the sampling cell in the light path of the AA spec-
trophotometer. The gaseous reaction products are not free analyte atoms, but rather volatile hydrides.
© 2002 by CRC Press LLC
Atomic Absorption Spectrometry 113
To dissociate the hydride gas into free atoms, the sample cell must be heated. The cell is heated by
an air–acetylene flame or with another electricity-driven system. The maximum absorption reading
or peak height is understood as the analytical signal. This technique is discussed in Chapter 11.
7.6.4 COLD VAPOR ATOMIC ABSORPTION SPECTROPHOTOMETER
Because atoms cannot exist in the free ground state at room temperature, heat must be applied to the
sample to break the bonds connecting atoms into molecules. The only notable exception to this gen-
eral rule is mercury. Free mercury atoms can exist at room temperature; therefore, mercury can be
measured by atomic absorption without a heated sample cell. The cold vapor method, which is ap-
plicable to the determination of mercury, is described in Chapter 10.
7.6.5 ELECTROTHERMAL OR GRAPHITE FURNACE ATOMIC ABSORPTION
SPECTROPHOTOMETRY (GRAAS)
When using the furnace technique in conjunction with an atomic absorption spectrophotometer, a
representative aliquot of a sample is placed in the
graphite tube in the furnace, evaporated to dryness,
charred, and atomized. As a greater percentage of available analyte atoms is vaporized and dissoci-
ated for absorption in the tube rather than the flame, the use of smaller sample volumes or detection
of lower concentrations of elements is possible.
The principle underlying GrAAS and FAAS is essentially the same, except that a furnace instead
of a flame, respectively, is used to atomize the sample. Radiation from a given excited element is
passed through the vapor containing ground-state atoms of that element. The intensity of the trans-
mitted radiation decreases in proportion to the amount of ground-state element in the vapor. The
metal atoms to be measured are placed in the radiation by increasing the temperature of the furnace,
thereby causing the injected specimen to be volatilized. A monochromator isolates the characteristic
radiation from the hollow cathode lamp or electrodeless discharge lamp, and a photosensitive device
measures the attenuated transmitted radiation. Electrothermal methods generally increase sensitivity.
This technique is described in Chapter 9.
7.7 INTERFERENCE IN AAS TECHNIQUES
When the sample alters one or more steps of the above process (Section 7.3) from the performance
of the standard, interference exists. If the interference is not recognized and corrected, or compen-
sated, the measured concentration will be inaccurate. Interferences in AAS can be divided into two
general categories: nonspectral and spectral.
7.7.1 NONSPECTRAL INTERFERENCES
Nonspectral interferences affect the formation of analyte atoms.
7.7.1.1 Matrix Interference
If the sample is more viscous or has different surface tension characteristics than the standards, the
sample nebulization may be different from the standards. Consequently, the number of the atoms and
thus the absorbance of the standards and samples will not correlate. This situation is known as ma-
trix interference.
For example,
negative interference is caused by increased acids or dissolved solids in the sam-
ple.
Positive error is caused by the presence of organic solvent in a sample, resulting in increased
© 2002 by CRC Press LLC
114 Environmental Sampling and Analysis for Metals
absorption. To eliminate this interference, any acid or other reagent added to the sample during prepa-
ration should also be added to the standard and blank in a similar concentration.
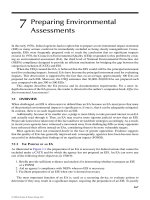
7.7.1.1.1 Correction by Standard Addition Method
In this technique, the accurate concentration of the analyte is obtained without the elimination of the
interfering substance. Aliquots of the standard are added to portions of the sample, which allow the
interfering substance in the sample to affect the standard as well.
1. Take equal volumes of aliquot from the sample.
2. Add nothing to the first aliquot.
3. Add a measured amount of standard to the second aliquot. The volume of the standard is
selected to give the approximate concentration of the analyte in the sample.
4. Add twice the volume of the same standard to the third aliquot of the sample.
5. Add three times the first addition of the standard volume to the next aliquot of the sample.
6. Finally, all portions are diluted to the same volume so that the final concentrations of the
original sample constituents are the same in each case. Only the added analyte differs by
a known amount.
The absorbance for all of the solutions must fall within the linear portion of the working curve. If
there is no interference in the sample, a plot of the measured absorbance vs. concentration of the added
standard would be parallel to the aqueous standard calibration. If no interfering substance is present,
the absorbance also increases in the added standards and will be proportional to the analyte in the sam-
ple. Therefore, the result is also a straight line, but because of the interference substance, its slope will
be different from the aqueous standards. Continue the concentration calibration on the abscissa back-
ward from zero and extrapolating the calibration line backward until it intercepts the concentration
axis. This will be the concentration corresponding to the absorbance of the unspiked sample. Thus, the
presence of interference in the sample can be determined easily by the standard addition method. If
the calibration curve of the spiked sample is not parallel with the calibration line of the aqueous stan-
dards, interference is present. The standard addition technique is illustrated in Figure 7.6.
7.7.1.2 Chemical Interferences
During the atomization process, sufficient energy should be available to dissociate the molecular
form of the analyte and create free atoms. If the sample contains a component that forms a thermally
No
interference
Concentration
Absorbance
Aqueous
standards
Spiked
sample
4.0 2.0 0 2.0 4.0
FIGURE 7.6 Standard additions method.
© 2002 by CRC Press LLC
Atomic Absorption Spectrometry 115
stable compound with the analyte, complete decomposition is not possible. For example, phosphate
causes this effect in calcium, because calcium phosphate does not totally dissociate in an air–acety-
lene flame.
7.7.1.2.1 Correction by Addition of Excess of
One Chemical Element or Compound
The first solution to chemical interferences is the addition of an excess of one chemical element or
compound that also forms a thermally stable compound with the interfering substance. In the case of
calcium, the addition of lanthanum is the solution. Lanthanum combines with phosphate and allows
the calcium to be completely atomized.
7.7.1.2.2 Correction by the Use of Nitrous Oxide–Acetylene Flame
The second solution to this kind of interference problem is to use a hotter flame. The nitrous
oxide–acetylene flame is considerably hotter than the air–acetylene type and can therefore be used
in interference elimination.
7.7.1.3 Ionization Interference
Most of this type of interference occurs in a hot nitrous oxide–acetylene flame. During the dissocia-
tion process of the molecules, the excess energy causes atoms to easily lose electrons and become
ions. In this case, the excited number of atoms decreases and atomic absorption is reduced, and ion-
ization interference exists.
7.7.1.3.1 Correction by Addition of Ionization Suppressant
Ionization interference can be eliminated with the addition of one element that is very easily ionized,
creating a large number of free electrons in the flame and suppressing ionization of the analyte.
Potassium (K), rubidium (Rb), and cesium (Cs) salts are commonly used as ionization suppressants.
For example, in barium (Ba) determination, adding 1000 to 5000 mg/l potassium (K) to all standards
and samples can eliminate the ionization effect. Recommended additions of ionization suppressants
are listed below.
1. In
aluminum (Al), barium (Ba), and chromium (Cr) determination, the addition of 1000
µg/ml (1000 µg/l = 1 mg/l) of potassium (K) is recommended.
a. Preparation of the stock K solution: Dissolve 95 g of potassium chloride (KCl) in
analyte free water and dilute to 1 liter.
b. Add 2 ml of this stock solution into each 100-ml standard and each 100 ml of sample
prior to analysis.
2. In
calcium (Ca) and magnesium (Mg) determination, the addition of 1000 µg/ml of lan-
thanum (La) is advised.
a. Preparation of the stock La solution: Dissolve 29 g of lanthanum oxide (La
2
O
3
) in 250
ml of HCl concentrate (be careful, reaction is violent!), and dilute to 500 ml with
analyte-free water.
b. Add 2 ml of this stock solution into each 100-ml standard and sample prior to analysis.
3. In
molybdenum (Mo) and vanadium (V) determination, the addition of 1000 mg/ml of alu-
minum (Al) is helpful.
a. Preparation of stock solution: Dissolve 139 g of aluminum nitrate nonahydrate
(Al(NO
3
)
3
.9H
2
O) in 150 ml of analyte-free water by heating. After the solution is
completely cool, dilute to 200 ml.
b. Add 2 ml of this stock solution to each 100-ml standard and sample prior to analysis.
© 2002 by CRC Press LLC
116 Environmental Sampling and Analysis for Metals
7.7.2 SPECTRAL INTERFERENCES
Spectral interferences are present when the measured light absorption is higher than the absorption
of the analyte. This type of interference is the result of light absorption by a nonanalyte element in
the sample.
7.7.2.1 Background Absorption
In reality, not all of the matrix materials in the sample are 100% atomized. Undissociated matrix mol-
ecules may have broadband absorption spectra, and tiny particles in the flame may scatter light over
a wide wavelength region. This type of absorption covers the atomic absorption wavelength of the
analyte, and background absorption occurs.
7.7.2.1.1 Continuous Source Background Correction
To eliminate this type of interference, the background absorption must be measured and subtracted
from the total absorption to verify the analyte’s absorption. The lack of accuracy of this method led
to the development of a more convenient technique called
continuous source background correc-
tion
, which automatically measures and compensates for any background absorption. This method
incorporates a continuum light source in the optical system. Light from both the primary and con-
tinuum lamps are combined and pass through the flame and monochromator and reach the detector.
The instrument itself separates the detector’s response. The continuum source signal can be sub-
tracted electronically from the primary signal source, which contains the sum of the background and
atomic absorption signals. The displayed absorbance and concentration will correspond to the dif-
ference of the absorbance of the lamps. Figure 7.7 shows how background absorption is eliminated
by using this technique.
7.7.2.1.2 Zeeman Background Correction
The other method for correcting background absorbance is the Zeeman background correction. The
principle of this technique is that the energy levels of an atom change when the atom is placed in a
strong magnetic field. The spectrum of the atom, which is a measure of energy levels, also changes,
but the background absorption is usually unaffected by the magnetic field. When an atom is placed
in a magnetic field and its atomic absorption is observed with a
polarized light (polarized light vi-
brates in only one plane, in contrast to ordinary light, which vibrates in all planes, as can seen in
Appendix G), the normal single-line atomic absorption is split into two components symmetrically
displaced about the normal position, as seen in Figure 7.8. In the Zeeman background correction, a
Monochromator
Primary
source
Continuum
source
Detector
FIGURE 7.7 Continuum source background corrector.
© 2002 by CRC Press LLC
Atomic Absorption Spectrometry 117
magnetic field is placed around the atomizer and makes alternating absorption measurements with
the magnet off and on. At the “magnet off” position, the uncorrected total absorbance can be meas-
ured, and in the “magnet on” position, the background absorbance reading is made, as seen in
Figure 7.9. The comparison automatically made by the instrument to compensate for background
correction is similar to the continuum source technique. In the Zeeman background correction, the
emission profile of the light source is identical in both AA and background measurements. As a re-
sult, most complex structured background situations can be accurately corrected with the Zeeman
background correction.
7.7.3 SUMMARY OF INTERFERENCES
7.7.3.1 Nonspectral Interference
1. Matrix interference: Sample nebulization is different from standards, so the absorbance of
samples is not correlated with standards. This type of interference can be eliminated by
special care and selection of the sample preparation technique, or by using the standard
addition method.
2.
Chemical interference: If the sample contains a component that forms a thermally stable
component with the analyte, it is not able to complete decomposition. It can be clarified
by the addition of an excess of an appropriate chemical element or compound, or by
changing to a hotter nitrous oxide-acetylene flame.
3.
Ionization interference: In the hot nitrous oxide–acetylene flame during the dissociation
process, atoms lose electrons and become ions. Consequently, the number of atoms and
thus the atomic absorptions are reduced. The interference may be reduced by adding an
excess of an element (called a suppressant) that is very easily ionized and suppresses the
ionization of the analyte.
Normal
Zeeman
Pattern
No
Magnetic
Field
νo
νo σ+
σ+
π
FIGURE 7.8 Zeeman effect.
Absorption
Line
Background
Background
Magnetic
Field On
Magnetic
Field Off
Emission
Line
Absorption
Lines
Emission
Line
νo
νo
σ
+
σ
-
FIGURE 7.9 Zeeman effect background correction.
© 2002 by CRC Press LLC
118 Environmental Sampling and Analysis for Metals
7.7.3.2 Spectral Interference
The measured absorption is higher than the absorption of the analyte, caused by the light absorption
by a nonanalyte element in the sample. This type of interference is called
background absorption,
and is compensated by instrument correction, such as the continuum source background correction
and Zeeman background correction techniques.
7.8 SAFETY IN AAS WORK
Important safety considerations regarding the use of AAS equipment are summarized in the follow-
ing sections.
7.8.1 FLAMMABILITY OF ACETYLENE
Acetylene, a common fuel in AAS work, is flammable. Its flammability poses a safety problem.
7.8.2 COMBUSTION PRODUCTS
During equipment operation, combustion products can easily pollute the laboratory atmosphere. For
this reason, an independently vented fume hood is placed above the burner to remove burned and un-
burned fuel from the area as illustrated in Figure 7.10.
7.8.3 FLASHBACKS
Flashbacks are minor explosions due to improperly mixed fuel and air. Some specific causes of flash-
backs are:
1. Air being drawn back through the drain hole in the mixing chamber of the premix burner.
This problem can be avoided by connecting a 6-ft-long tube to the drain hole and forming
the tube into a loop, which is then filled with water. The other end is then placed into a con-
tainer of water (see Figure 7.10).
2. Shutting off all air to the burner before the fuel has been shut off. The solution here is
proper operation and proper instruction of operators.
3. Improper proportioning of the fuel air while adjusting the fuel or airflow rate. The solu-
tion to this problem is the same as in (2).
Because of the danger of flashbacks, safety glasses must be worn at all times while operating the in-
strument. General laboratory safety considerations are discussed in Chapter 19.
7.9 QUALITY CONTROL
See Chapter 13 for detailed quality control procedures to be followed during analysis.
7.10 MAINTENANCE OF AA SPECTROPHOTOMETERS
Constant care and routine maintenance are the secret for maintaining proper working conditions of
laboratory instruments. Maintenance activities for each instrument are found in the manufacturer’s
manual. A written maintenance schedule for each instrument must be available. The laboratory must
have a maintenance expert on staff or contract with the vendor to provide a specialist for maintenance
© 2002 by CRC Press LLC
Atomic Absorption Spectrometry 119
activities. Routine maintenance activities are based on recommendations of the manufacturer of each
type and model. Maintenance frequency may also change according to the workload and the type of
samples analyzed. Scheduling of maintenance activities by AAS type is presented in Table 7.2.
7.11 AAS PERFORMANCE CHECKS
Performance checks should occur every time a different metal is analyzed as part of the analytical
procedure. The performance check is an indicator of deterioration of the lamps or the spectropho-
tometer and reveals the instrument’s optimal operating condition. Performance is measured via a
“sensitivity check standard” based on a concentration specific to the method for each metal. The ab-
sorbance of this standard should be 0.200. If the absorbance differs by more than ±10%, the instru-
ment is not performing correctly and has to be corrected. Metal concentrations used in sensitivity
check data for flame and graphite techniques are presented in Tables 8.1 and Table 9.4, respectively.
7.12 SAMPLE COLLECTION AND SAMPLE PREPARATION
Collection and preparation of environmental samples for analysis using atomic absorption and
atomic emission spectrophotometers are discussed in Chapters 14 and 15.
Fume hood
Waste solution
Liquid in "trap"
in drain line
FIGURE 7.10 AA instrument showing fume hood and drain line.
© 2002 by CRC Press LLC
120 Environmental Sampling and Analysis for Metals
TABLE 7.2
Maintenance of Atomic Absorption Spectrophotometer
Instrument Type Maintenance Activity Frequency
UV/Vis Check lamp alignment W
Replace lamp AN
Clean windows Q (I) (C)
Clean sample compartment D
Clean cuvettes after use D
IR Clean sample cell D
Clean windows M
Change dessicant Q
Check gas leakage D
AA flame Clean nebulizer D
Clean burner head D
Check tubing, pump, and lamps D
Clean quartz windows W
Check electronics SA (I) (C)
Check optics A (I) (C)
AA graphite Check graphite tube D
Flush autosampler tubing D
Clean furnace housing and injector tip W
Check electronics SA (I) (C)
Note: D = daily; W = weekly; M = monthly; Q = quarterly; SA = semiannually; A = annually; AN = as
needed; I = instrumentation specialist; C = on contract.
© 2002 by CRC Press LLC