báo cáo khoa học: " A newly-developed community microarray resource for transcriptome profiling in Brassica species enables the confirmation of Brassica-specific expressed sequences" pdf
Bạn đang xem bản rút gọn của tài liệu. Xem và tải ngay bản đầy đủ của tài liệu tại đây (520.26 KB, 10 trang )
BioMed Central
Page 1 of 10
(page number not for citation purposes)
BMC Plant Biology
Open Access
Research article
A newly-developed community microarray resource for
transcriptome profiling in Brassica species enables the confirmation
of Brassica-specific expressed sequences
Martin Trick
1
, Foo Cheung
2
, Nizar Drou
1
, Fiona Fraser
1
,
Edward K Lobenhofer
3,4
, Patrick Hurban
3
, Andreas Magusin
1
,
Christopher D Town
2
and Ian Bancroft*
1
Address:
1
John Innes Centre, Norwich Research Park, Colney, Norwich, NR4 7UH, UK,
2
The J Craig Venter Institute, 9704 Medical Center Drive,
Rockville, MD 20850, USA,
3
Cogenics, A Division of Clinical Data, Inc, 100 Perimeter Park Drive, Suite C, Morrisville, NC 27560, USA and
4
Current address : Amgen Inc, 1 Amgen Center Drive, Thousand Oaks, CA 91320, USA
Email: Martin Trick - ; Foo Cheung - ; Nizar Drou - ;
Fiona Fraser - ; Edward K Lobenhofer - ; Patrick Hurban - ;
Andreas Magusin - ; Christopher D Town - ; Ian Bancroft* -
* Corresponding author
Abstract
Background: The Brassica species include an important group of crops and provide opportunities
for studying the evolutionary consequences of polyploidy. They are related to Arabidopsis thaliana,
for which the first complete plant genome sequence was obtained and their genomes show
extensive, although imperfect, conserved synteny with that of A. thaliana. A large number of EST
sequences, derived from a range of different Brassica species, are available in the public database,
but no public microarray resource has so far been developed for these species.
Results: We assembled unigenes using ~800,000 EST sequences, mainly from three species: B.
napus, B. rapa and B. oleracea. The assembly was conducted with the aim of co-assembling ESTs of
orthologous genes (including homoeologous pairs of genes in B. napus from each of the A and C
genomes), but resolving assemblies of paralogous, or paleo-homoeologous, genes (i.e. the genes
related by the ancestral genome triplication observed in diploid Brassica species). 90,864 unique
sequence assemblies were developed. These were incorporated into the BAC sequence annotation
for the Brassica rapa Genome Sequencing Project, enabling the identification of cognate genomic
sequences for a proportion of them. A 60-mer oligo microarray comprising 94,558 probes was
developed using the unigene sequences. Gene expression was analysed in reciprocal resynthesised
B. napus lines and the B. oleracea and B. rapa lines used to produce them. The analysis showed that
significant expression could consistently be detected in leaf tissue for 35,386 unigenes. Expression
was detected across all four genotypes for 27,355 unigenes, genome-specific expression patterns
were observed for 7,851 unigenes and 180 unigenes displayed other classes of expression pattern.
Principal component analysis (PCA) clearly resolved the individual microarray datasets for B. rapa,
B. oleracea and resynthesised B. napus. Quantitative differences in expression were observed
between the resynthesised B. napus lines for 98 unigenes, most of which could be classified into
non-additive expression patterns, including 17 that showed cytoplasm-specific patterns. We further
Published: 8 May 2009
BMC Plant Biology 2009, 9:50 doi:10.1186/1471-2229-9-50
Received: 31 October 2008
Accepted: 8 May 2009
This article is available from: />© 2009 Trick et al; licensee BioMed Central Ltd.
This is an Open Access article distributed under the terms of the Creative Commons Attribution License ( />),
which permits unrestricted use, distribution, and reproduction in any medium, provided the original work is properly cited.
BMC Plant Biology 2009, 9:50 />Page 2 of 10
(page number not for citation purposes)
characterized the unigenes for which A genome-specific expression was observed and cognate
genomic sequences could be identified. Ten of these unigenes were found to be Brassica-specific
sequences, including two that originate from complex loci comprising gene clusters.
Conclusion: We succeeded in developing a Brassica community microarray resource. Although
expression can be measured for the majority of unigenes across species, there were numerous
probes that reported in a genome-specific manner. We anticipate that some proportion of these
will represent species-specific transcripts and the remainder will be the consequence of variation
of sequences within the regions represented by the array probes. Our studies demonstrated that
the datasets obtained from the arrays can be used for typical analyses, including PCA and the
analysis of differential expression. We have also demonstrated that Brassica-specific transcripts
identified in silico in the sequence assembly of public EST database accessions are indeed reported
by the array. These would not be detectable using arrays designed using A. thaliana sequences.
Background
The cultivated Brassica species are the group of crops most
closely related to Arabidopsis thaliana. They are members
of the Brassicaceae (sometimes referred to as the Crucifer-
eae) family [1]. The species typically termed the "diploid"
Brassica species, B. rapa (n = 10), B. nigra (n = 8) and B.
oleracea (n = 9) contain the A, B and C genomes, respec-
tively. Each pairwise combination has hybridized sponta-
neously to form the three allotetraploid species [2], B.
napus (n = 19, comprising A and C genomes), B. juncea (n
= 18, comprising A and B genomes) and B. carinata (n =
17, comprising B and C genomes). The genome of B. rapa
is the smallest, at ca. 500 Mb [3], and a genome sequenc-
ing project is under way, with both sequences and
sequence annotations in the public domain http://
brassica.bbsrc.ac.uk/
The lineages of B. rapa and B. oleracea diverged ca. 3.7 Mya
[4] and genetic mapping has confirmed that the overall
organisation of their genomes is highly collinear [5]. Their
hybridisation to form B. napus probably occurred during
human cultivation, i.e. less than 10,000 years ago. Com-
parative genetic mapping showed that the progenitor A
and C genomes in B. napus have undergone little or no
gross rearrangement during that time [6] and also
revealed extensive duplication within the Brassica
genomes [5]. Recent cytogenetic studies have shown that
a distinctive feature of the Brassiceae tribe, of which the
Brassica species are members, is that they contain exten-
sively triplicated genomes [7].
Even at the resolution of linkage maps, extensive colline-
arity can be identified between the genomes of Brassica
species and A. thaliana. For example, a landmark study
using sequenced RFLP markers demonstrated that 21 seg-
ments of the genome of A. thaliana, representing almost
its entirety, could be replicated and rearranged to generate
a structure approximating that of the B. napus genome [8].
A study across the Brassicaceae subsequently identified 24
conserved chromosomal blocks, relating them to a pro-
posed ancestral karyotype of n = 8 [9]. A number of
genome analyses have been conducted in B. oleracea, B.
rapa and B. napus using physical mapping techniques. The
results have shown that the diploid Brassica genomes con-
tain extensive triplication, consistent with their having
evolved from a hexaploid ancestor [10-12]. Two
sequence-level studies, one in B. oleracea [13] and one in
B. rapa [14] have provided further support for the hypoth-
esis of hexaploid ancestry for the Brassica species. If this
hypothesis were true, the duplicate genes we observe in
the extant diploid genomes would formally be "paleo-
homoeologues". However, here we will use the more gen-
eral term paralogue, which is free of this assumption, to
clearly delineate from the recognisable homoeologues in
B. napus arising from the very recent hybridisation of the
A and C genomes. The studies using physical mapping
and sequencing approaches showed that, although sets of
three related genome segments (paralogues) will often be
identifiable within the genome of the diploid Brassica spe-
cies, a proportion of the genes in these segments will have
been lost.
Brassica polyploids can be synthesised artificially. For
example, B. napus can be resynthesised by hybridization
of B. rapa and B. oleracea. However, it has been found that
such lines display genome instability [15], which can per-
sist for many generations and is thought to involve
homoeologous non-reciprocal translocations. They have
been shown to be correlated with qualitative changes in
the expression of specific genes and with phenotypic vari-
ation [16].
Microarrays have become a widely-used tool for transcrip-
tome analysis in plants. Essentially, they consist of an
immobilised array of DNA sequences (probes) which are
hybridized in situ using fluorescently-labelled sequences
(targets) derived by reverse transcription of polyade-
nylated transcripts. Imaging of the hybridized array, fol-
lowed by computational analysis of the signal intensity
data, leads to a quantification of the transcript abundance,
BMC Plant Biology 2009, 9:50 />Page 3 of 10
(page number not for citation purposes)
in the sampled tissue, of the genes represented by the
probes in the array. There are numerous microarray plat-
forms available and they have been applied to a wide
range of studies in plant biology, reviewed by Galbraith
[17].
As the Brassica species diverged from A. thaliana only ca.
17 Mya [18], exon sequences show a high level of conser-
vation, ca. 85% at the nucleotide level [19]. Therefore
some types of microarrays designed for use in A. thaliana
can be used for the analysis in Brassica of the related genes.
However, an analysis of ca. 100,000 Brassica EST
sequences showed that ca. 9% showed no similarity with
any gene in A. thaliana [14]. A. thaliana-based microarrays
therefore would fail to measure the expression of a signif-
icant number of Brassica genes. In addition, Brassica
genomes show extensive triplication, with the sub-
genomes estimated to have diverged ca. 14 Mya
[13,14,18]. A. thaliana-based microarrays would lack the
capability to resolve the contributions to the transcrip-
tome of such families of paralogous genes. Consequently,
a number of groups have developed Brassica cDNA-based
microarrays, but these have been based upon relatively
modest EST collections and none are available as commu-
nity resources. We aimed to address this deficiency by
developing a microarray based upon all public EST data,
validating its utility for transcriptome analysis across mul-
tiple Brassica species, and placing it in the public domain.
The validation experiment involved transcriptome analy-
sis in two "resynthesised" B. napus lines and their B. rapa
and B. oleracea progenitors. This experimental design ena-
bles the identification of both species-specific and
genome-specific expression, whilst the long oligonucle-
otides used essentially eliminate the possible complica-
tions due to allelic variation (SNPs and small indels).
Results
Assembly of Brassica unigenes
All available Brassica species ESTs were downloaded from
GenBank in September, 2007. These consisted of three
principal sets: B. napus (567,240), B. rapa (180,611) and
B. oleracea (59,696). A total of 810,254 ESTs after cleaning
and removal of low quality and short (<100 bp)
sequences was reduced to 803,326 reads. Since the initial
goal was to develop a widely useful Brassica microarray, all
available ESTs were assembled together using the TGICL
software package [20] with default settings (94% identity,
90% coverage). The statistics for this assembly are shown
in Table 1. Sequences were oriented either based on their
alignment with a known protein or by the presence of a
polyA (polyT) tail. A total of 3,694 sequences (330 assem-
blies and 3364 singletons) could not be oriented and were
thus represented in both orientations in the data set from
which the array was designed, making 94,558 sequences
in all. The assemblies and singletons were annotated by
searching against NCBI Uniprot100 using a cut-off of 1E-
5. A total of 72,148 sequences were annotated.
Incorporation of assemblies into the Brassica genome
sequence annotation
As partners in a multinational consortium to sequence the
gene space of the Brassica rapa genome, we make available
(from
a first-pass annotation
of completed BACs immediately on deposition in the
public sequence databases. The annotation is rendered
through the GBrowse genome browser system [21]. For
the present study, 673 BAC sequences were available for
analysis and were annotated. The sequence coverage was
approximately 80 Mbp, which is equivalent to ~14.5%
coverage of the entire ~550 Mbp B. rapa genome pro rata
[8], but this might represent a greater fraction of the gene
space because the original seed BACs and hence the scaf-
fold extensions were targeted to the gene-rich euchroma-
tin.
There were 19,148 separate instances of unigenes aligning
within this annotation set and 10,606 of the 17,862,
(59.4%) FGENESH gene models predicted had EST sup-
port arising from some overlap with these EST alignments.
Of the 90,864 unigenes comprising the assembly, 13,938
(15.4%) appeared at least once within the annotation set,
including 38 of the unigenes represented in both orienta-
tions. Gene predictions around the latter may aid in their
resolution.
Design of the microarray
One of the primary requirements for the design of the
microarray was that it should be applicable for transcrip-
tome analysis across a range of Brassica species. Therefore,
we required a platform based on "long oligonucleotide"
Table 1: Summary statistics of unigene assembly
Total number of reads 803,326
Total unique sequences 90,864
Total assemblies 42,642
ESTs in assemblies 751,410
Total singletons 48,222
Total base count 64,044,420 bp
Minimum length 101 bp
Average length 677 bp
Maximum length 3,786 bp
BMC Plant Biology 2009, 9:50 />Page 4 of 10
(page number not for citation purposes)
probes in order to minimise susceptibility to SNP varia-
tion across species, whilst retaining the capability of
resolving the transcripts of significantly diverged gene
families, such as those with paralogous relationships
within the Brassica genomes. To accommodate these
design requirements, the Agilent Technologies microarray
platform, which uses 60-mer oligonucleotide probes, was
selected
.
The assembled Brassica sequences (94,558 instances
including those represented in both orientations) were
submitted to Agilent Technologies' eArray web portal for
gene expression probe design. For each 60-mer oligonu-
cleotide probe that is designed using this tool, a base com-
position score is calculated to reflect the theoretical
performance of the probe in standard hybridization con-
ditions. Probes with a base composition score greater than
or equal to 3 were omitted from the final design. This
resulted in a total of 91,854 unique probes (including
6,989 derived from oppositely oriented pairs of
sequences) that were included in the microarray design, of
which 10,466 were predicted to have cross-hybridization
potential. To utilize the full capacity of the microarray,
11,893 probes were randomly selected to be represented
in duplicate in the final design, which also included Agi-
lent Technologies' standard panel of quality control and
spike-in probes. This design was then used to manufacture
microarrays using Agilent Technologies' SurePrint™ Tech-
nology in the 2× 10⁴ k format (two microarrays contain-
ing ~104,000 probes on a single 1" × 3" glass slide).
Qualitative analysis of gene expression across genotypes
The experimental design used to test the performance of
the microarray included four genotypes: two "resynthe-
sized" B. napus lines and their progenitor B. rapa and B.
oleracea lines. The nuclear genomes of the resynthesised B.
napus lines should be identical but, as one (B. napus 1)
involved a cross of B. oleracea onto B. rapa, and the other
(B. napus 2) involved a cross of B rapa onto B. oleracea,
they differ in cytoplasm, and hence contain different chlo-
roplast and mitochondrial genomes. For each genotype,
RNA was isolated from four biological replicates making
a total of sixteen independent samples. The gene expres-
sion profile for each sample was generated by labelling
and hybridizing each sample to one of 16 separate micro-
arrays. The data are available from the GEO repository,
accession number GSE15915.
The parameters used for the assembly of the unigenes had
been set such that transcribed sequences from ortholo-
gous genes, including homoeologues from the A and C
genomes in B. napus, should co-assemble. In order to
assess the number of probes that, nevertheless, report
genome-specific expression, we used the presence or
absence of significant signal (qualitative expression) for
each probe to classify the expression pattern of the corre-
sponding unigene. The probes were considered to give no
signal if no significant expression was detected in any of
the 16 microarrays. 31,705 of the 103,747 non-control
probes on the array fell into this class. Of the probes for
which significant expression was identified in at least one
microarray, those that give only matching reports of either
significant signal or no significant signal across every set
of replicates (i.e. there were no instances of only 1, 2 or 3
replicate microarrays yielding significant signals from a
particular genotype) were considered to have produced
consistent reports of qualitative expression. In total,
39,689 probes produced consistent reports of qualitative
expression and were used to classify qualitative expression
patterns into 15 classes across the genotypes (see addi-
tional file 1: Spreadsheet1). The results, with duplicate
probes removed in order to show the number of unigenes
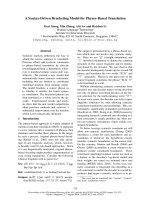
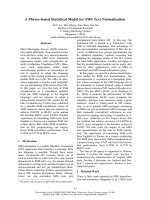
represented, are summarised in Figure 1. 1,109 of the
35,389 unigenes represented are from the dual-orientated
subset, of which 108 were reported in both orientations.
Significant qualitative expression can be detected across
all genotypes for 27,355 unigenes. Genome-specific
expression can be detected for 7,851 unigenes; 3,427 are
expressed in B. rapa and B. napus, but not in B. oleracea
and thus can be considered A genome-specific while by
analogous criteria 4,424 can be considered C genome-spe-
cific. Significant expression was detected for 135 unigenes
in B. rapa only and for 19 unigenes in B. oleracea only. No
unigenes were expressed only in a diploid while 12 uni-
genes (not shown in Figure 1) were expressed only in a
tetraploid. Very few unigenes (14 in total) were catego-
rised into the remaining 9 classes of qualitative expres-
sion.
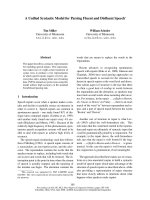
Resolution of genotypes by Principal Component Analysis
In order to visualize the significant sources of variation
within the entire data set, a principal component analysis
(PCA) was performed. The PCA was performed using z-
score transformed intensity measurements for all non-
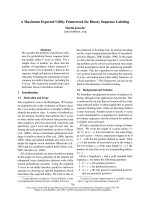
control probes on the microarray. The resulting scatterplot
is depicted in Figure 2, with each colour representing a dif-
ferent genotype. The plot demonstrates that the biological
replicates within each genotype cluster closely together.
Furthermore, the largest source of variation in the gene
expression data is the different species as evidenced by the
distinct groupings of each genotype along the x-axis
(which depicts principal component 1). There was limited
resolution of the resynthesised B. napus lines, which dif-
fered only by cytoplasm.
Identification of differential gene expression in
resynthesised B. napus
Apart from heritable epigenetic differences, the nuclear
genomes of the resynthesised B. napus lines should be
identical, but their chloroplast and mitochondrial
BMC Plant Biology 2009, 9:50 />Page 5 of 10
(page number not for citation purposes)
genomes differ. We investigated whether the microarray
was capable of detecting any cytoplasm-specific differ-
ences in gene expression or any deviation from the
expected additive contributions of the parental nuclear
genomes to the transcriptome of the amphidiploid, typi-
cally termed transcriptome remodelling or non-additive
gene expression. Quantitative expression was compared
between the resynthesised B. napus lines. 98 unigenes
were identified that showed significant (P < 0.001) expres-
sion differences between the two lines (see additional file
2: Spreadsheet2) For each of these unigenes, the genome
of origin (nuclear, chloroplast or mitochondrion) was
determined by using BLAST to identify similarity between
the unigene sequence and annotated genes or other
sequences in the public databases. The expression patterns
were further classified, where possible, based upon signif-
icant differences between expression in other pairs of gen-
otypes, i.e. involving the B. oleracea and B. rapa genotypes
(see additional file 3: Spreadsheet3).
Seventeen unigenes showed cytoplasm-specific expres-
sion profiles (i.e. there is a significant difference between
the reported expression in the B. oleracea and B. rapa lines
and the expression reported in the resynthesised B. napus
lines corresponds to that of the maternal parent in the
respective hybridization). Of these, 12 unigenes are of
chloroplast origin, two are of mitochondrial origin and
three are of nuclear origin. These patterns are consistent
with cytoplasmic inheritance (chloroplast and mitochon-
drial genes) or epigenetic imprinting (nuclear genes).
Non-additive expression could be identified for 60 uni-
genes, 58 of which are nuclear-encoded and two that are
mitochondrial. The expression patterns of 21 unigenes
(13 nuclear-encoded, five chloroplast encoded and three
mitochondrion-encoded) that showed significant differ-
ences in expression between the resynthesised B. napus
lines could not be classified, as a result of lack of signifi-
cance in expression levels between other combinations of
genotypes. These results show that the expression data
generated using the microarray are, with four biological
replicates, of a sufficiently high quality to enable the clas-
sification of expression patterns for 77 of the 98 unigenes
(79%) showing significant differences in expression
between the resynthesised B. napus lines, including the
identification of many cytoplasm-specific expression pat-
terns for genes encoded by chloroplasts or mitochondria.
Characterization of sequences showing genome-specific
expression
Expression of 7,851 unigenes was found in both B. napus
lines and only one or other of the two diploids. Of these,
3,427 are from the A genome. BLASTN was used to scan
the sequenced BACs for these probes and for the corre-
sponding complete unigene sequences. Of the aligned
(cognate) unigenes, ten were randomly selected for fur-
ther analysis. The entire unigene sequences were used to
identify, using BLAST, homologous TAIR8 CDS from A.
thaliana and the position of the probe within the aligned
sequences was used to assess whether the probe is likely to
lie in coding or untranslated regions of the transcript. The
results are summarised in Table 2. In most (eight) cases,
the unigene aligns to an A. thaliana CDS and the position
of the microarray probe can be inferred as being in a 3'
UTR. In two cases, the alignment to an A. thaliana CDS
suggests that the probe lies within the coding region.
Twelve unigenes were identified that had cognate genes in
sequenced B. rapa BAC clones, but did not show homol-
ogy to A. thaliana CDS. The sequences of these unigenes
were assessed, using BLASTN, for similarity with any A.
thaliana genomic sequences or other sequences in the
NCBI nucleotide collection (nr/nt) database. The results
are summarised in Table 3. In two cases, the unigene con-
tains some sequences with homology to short stretches of
A. thaliana genomic sequences. However, in most cases
(ten), the unigenes appear to represent Brassica-specific
sequence, as no similarities were identified with genomic
sequences from A. thaliana or any other organism. The
majority of these (eight) originate from positions in the B.
rapa genome that lie between genes showing collinearity
with the A. thaliana genome. The remaining two originate
from positions within gene clusters (one of protein
kinase-encoding genes and the other of oxidoreductase-
encoding genes).
Discussion
We assembled unigenes using 810,254 EST sequences,
mainly from three species: B. napus, B. rapa and B. oleracea.
The assembly was conducted with the aim of co-assem-
Classification of qualitative expression patterns of unigenesFigure 1
Classification of qualitative expression patterns of
unigenes. Unigene classification by consistent, significant sig-
nals detected from each of the four genotypes analysed.
B. rapa B. oleracea
B. napus 1
B. napus 2
273553427 4424
2
0
3
4
19
2
135
2
0
1
BMC Plant Biology 2009, 9:50 />Page 6 of 10
(page number not for citation purposes)
bling ESTs of orthologous genes (including homoeo-
logue-pairs in B. napus from each of the A and C
genomes), but resolving assemblies of paralogous genes
(i.e. the genes related by the ancestral genome triplication
observed in Brassica species). To do this, the assembly cut-
off was set at 94% identity, based on our estimates of
nucleotide conservation between paralogues of ~84%
[13] and between A and C genome orthologues of 94–
97% (unpublished). In total, 94,558 unigenes, represent-
ing 90,864 unique sequences were developed. An antici-
pated consequence of the close phylogenetic relationship
between Brassica and A. thaliana, for which a complete
genome sequence is available and has been annotated to
a high standard, the majority of the unigenes (72,148)
could be annotated and orientated on the basis of
sequence similarity to proteins in the Uniprot100 data-
base. The remaining 18,716 unigenes are candidates for
encoding Brassica-specific proteins or non-coding RNAs.
In the absence of genomic sequence data, the functional
significance of the large number of Brassica-specific uni-
genes is difficult to assess. As a first step, the assemblies
were incorporated into the BAC sequence annotation for
the Brassica rapa Genome Sequencing Project, enabling
the identification of cognate genomic sequences for a pro-
portion of the assemblies and contributing to the annota-
tion of the emerging B. rapa genome sequence.
A 60-mer oligo microarray was developed using the uni-
gene sequences and its utility validated by conducting an
experiment aimed at testing its ability to analyse the tran-
scriptomes of multiple Brassica species. Gene expression
was analysed in two resynthesised B. napus lines and the
B. oleracea and B. rapa lines used to produce them. The B.
napus lines represented progeny resulting from both B.
oleracea crossed onto B. rapa (thus possessing the B. rapa
cytoplasm) and B. rapa crossed onto B. oleracea (thus pos-
sessing the B. oleracea cytoplasm). The 60-mer probe
design enables an analysis of differential expression
regardless of allelic variation due to SNPs or short indels
which might interfere with transcript detection by the
probes. The analysis showed that significant expression
could consistently be detected in leaf tissue for 35,386
unigenes. This proportion of the total number of 94,558
unigenes (37.4%) is consistent with our expectations as
many of the ESTs in the original collection were derived
from other tissues (particularly developing seeds). Our
criteria for significant expression were stringent (resulting
in the elimination of 32,353 probes for which neverthe-
less at least one array detected significant expression).
Expression was detected across all four genotypes for
27,355 unigenes (77.3% of those for which consistent
expression was detected) and principal component analy-
sis clearly resolved the individual microarray datasets for
B. rapa, B. oleracea and resynthesised B. napus. Quantita-
tive differences in expression were observed between the
resynthesised B. napus lines for 98 unigenes, most of
which could be classified into non-additive expression
patterns, including 17 that showed cytoplasm-specific
patterns.
In the two diploids, genome-specific expression patterns
were observed for 7,851 unigenes (22.2% of those for
which consistent expression was detected). These may
represent instances in which the probes were designed to
sequences that differ between the A and C genome ortho-
logues. However, the anticipated sequence polymorphism
rate between coding regions of orthologous genes of
~3.4% would typically result in ~2 differences per probe,
which is unlikely to destabilize the hybridization suffi-
ciently to abolish signal. We have, however, observed that
sequences that are orthologous between the Brassica A and
C genomes also differ in insertion-deletions (InDel)
(unpublished), which could result in more extensive
destabilization if overlapping the region to which the
probe is designed. Alternatively, these may be sequences
that are present in only one of the Brassica genomes, or
their genome-specific expression may be tissue-depend-
ent (we have analysed only leaf tissue). To begin to under-
stand the basis for this difference, we exploited the
emerging B. rapa genome sequences in order to character-
ize the genome sequences cognate to some of the uni-
genes showing genome-specific patterns of expression, as
reported by the microarray. This revealed that, in the
majority of cases, the probes are positioned in 3' UTR
regions. However, ten of the aligned unigenes were found
to be Brassica-specific sequences, including two that origi-
Principal Component Analysis of gene expression in the four genotypesFigure 2
Principal Component Analysis of gene expression in
the four genotypes. Microarray datasets for each of the
individual samples subjected to analysis by three principal
components. The proportions of the total variation
explained by principal components 1, 2 and 3 are 22.1%,
13.6% and 10.1%, respectively.
B. oleracea
B. rapa
B. napus 1
B. napus 2
BMC Plant Biology 2009, 9:50 />Page 7 of 10
(page number not for citation purposes)
nate from complex loci comprising gene clusters. There-
fore, we can hypothesise that a proportion of the unigenes
showing genome-specific patterns of reported expression
are likely to represent either Brassica-specific genes or
Brassica-specific non-protein coding sequences. The
observation of two instances of novel transcripts from
clusters of genes that show evidence of recent duplication
and rearrangements, and are reminiscent of some classes
of disease resistance loci in plants, is particularly intrigu-
ing as it provides evidence for these loci producing novel
genetic and transcriptional variation.
Conclusion
We successfully developed and validated a microarray
resource for use by the Brassica research community. The
microarray enabled the detection of gene expression
across all Brassica species tested for >27,000 unigenes.
Genome-specific expression was observed for more than
7000 further unigenes. We anticipate that these will repre-
sent both species-specific transcripts and the conse-
quences of variation of sequences within the regions of
the unigenes represented by the array probes. Our studies
demonstrated that the datasets obtained from the arrays
can be used for typical analyses, including PCA and the
analysis of differential expression. Our analysis of uni-
genes showing genome-specific expression patterns con-
firmed the transcription of sequences not represented in
A. thaliana. Indeed, numerous transcripts were identified
that represent Brassica-specific sequences. These tran-
scripts would not be detectable using arrays designed with
A. thaliana sequences and may represent functional genes
not represented in other species.
Methods
Growth of plants
Seed was sown into Plantpak 9 cm pots containing Scotts
Levington F1 compost (Scotts, Ipswich, UK) and covered
with a plastic propagator lid. The seeds were germinated
and grown in long day glass house conditions (16 hours
photoperiod) at 15°C (400 W HQI metal halide lamps).
Plants were pricked out after 11 days into Plantpak P15
modules containing Scotts Levington M2 compost and
arranged into a four block randomised design with three
plants each for each of the four genotypes per block and
randomised within each block. Leaves were harvested 15
days after pricking out, 26 days after sowing. Leaf harvest
was carried out as close to the midpoint of the light period
as possible. The first true leaf of each plant was excised as
close to the petiole as possible and the weight was
recorded. Three leaf samples for each genotype from each
experimental block were pooled and frozen in liquid
nitrogen, giving a final harvest of four pooled leaf samples
per genotype.
Preparation of RNA
RNA was prepared by grinding tissue in liquid nitrogen
and extracting using TRI Reagent (Sigma-Aldrich, St.
Louis, MO, USA) according to the manufacturer's proto-
col. The RNA was resuspended in 50 μl DEPC treated
water (Severn Biotech Ltd., Kidderminster, UK). The RNA
samples were further purified using the Qiagen Mini Kit
(Qiagen Inc., Valencia, CA, USA) according to the RNA
Clean up protocol given in the RNeasy Mini Handbook
(4
th
edition, April 2006).
Table 2: Position of probe sequence within unigenes aligned to A. thaliana CDS
Unigene BAC Position of probe in BAC (bp) Length unigene/bp Arabidopsis CDS
homologue
E value Position of probe
CD814561 KBrB005J17 29945 – 30004 555 AT1G67170 1.00E-24 3' UTR
EL590227 KBrH006E24 22739 – 22798 760 AT1G27595 3.00E-97 3' UTR
EV025509 KBrB013O20 3047 – 3106 606 AT3G06340 3.00E-41 Coding region
EV192260 KBrH066L21 23787 – 23846 720 AT5G29000 <1E-100 3' UTR
EX121951 KBrB026E08 69852 – 69911 649 AT2G33020 4.00E-87 3' UTR
JCVI_14643 KBrB091M07 67082 – 67141 998 AT4G38950 <1E-100 3' UTR
JCVI_23824 KBrB004L02 112948 – 113007 1100 AT5G19370 <1E-100 3' UTR
JCVI_32841 KBrB089M05 95567 – 95626 787 AT3G15920 <1E-100 Coding region
JCVI_39932 KBrH127P20 35513 – 35572 977 AT2G46220 <1E-100 3' UTR
JCVI_7760 KBrB048F07 71056 – 71115 2101 AT4G36390 <1E-100 3' UTR
BMC Plant Biology 2009, 9:50 />Page 8 of 10
(page number not for citation purposes)
Gene Expression Profiling
The quantity and purity of the extracted RNA was evalu-
ated using a NanoDrop ND-1000 spectrophotometer
(Nanodrop Technologies, Wilmington, DE, USA) and its
integrity measured using an Agilent Bioanalyzer. For
microarray hybridizations performed, 500 ng of total
RNA from each sample was amplified and labeled with a
fluorescent dye (Cy3) using the Low RNA Input Linear
Amplification Labeling kit (Agilent Technologies, Palo
Alto, CA, USA) following the manufacturer's protocol.
The amount and quality of the fluorescently labeled cRNA
was assessed using a NanoDrop ND-1000 spectropho-
tometer and an Agilent Bioanalyzer. A consistent amount
of Cy3-labeled cRNA (1.6 μg) were hybridized to the cus-
tom Brassica microarray, which was manufactured by Agi-
lent Technologies, for 17 hours, prior to washing and
scanning. Data were extracted from scanned images using
Agilent's Feature Extraction Software (Agilent Technolo-
gies).
Data Analysis
Gene expression data was loaded into the Rosetta
Resolver
®
Gene Expression Analysis System version
7.0.0.1.9 and biological replicates were combined using
an error-weighted average. Ratios were then calculated
comparing each possible combination of samples. The
criteria for identification of differentially expressed tran-
scripts was an absolute fold change value > 2.0, a log ratio
p-value < 0.001, and a log(10) intensity measurement > -
1.8. Rosetta Resolver was used to perform a principal com-
ponent analysis (PCA) using z-score transformed intensity
data for all non-control features present on the microarray
for each of the 16 samples that were profiled.
The statistical significance of probes representing differen-
tially expressed transcripts was determined using the
Bayesian-moderated test statistic described in [22]. The
statistic was calculated in a linear model framework pro-
vided by the library limma, which is part of the BioCon-
ductor suite of libraries for the statistical programming
language R. The p-value cut-off, given above, for signifi-
cance was established by inspecting the distribution of p-
values associated with the control probes on the microar-
ray.
Annotation and databases
Finished Brassica rapa BAC sequences available in the pub-
lic domain were annotated using the Brassica 95 k uni-
gene set as described below and the results published to
complement the other annotation tracks available
through the GBrowse genome browser at http://
brassica.bbsrc.ac.uk. Briefly, the 95 k set was first queried
Table 3: Analysis of similarity of unigenes showing A genome-specific expression patterns and no similarity to A. thaliana CDS
Unigene Length unigene Cognate BAC BLAST similarity to other organisms* Genomic context**
EE447381 597 KBrB044C04 A. thaliana F6A14 Within protein-coding gene
EV084643 624 KBrB036M17 none Between collinear conserved genes
EX052353 634 KBrB052E10 none Between collinear conserved genes
EX117393 960 KBrB068E07 none Within oxidoreductase gene cluster region
EX120283 685 KBrB080C12 none Between collinear conserved genes
EX123623 634 KBrS011B08 none Within kinase gene cluster region
EX133623 682 KBrB043M07 none Between collinear conserved genes
EX140739 619 KBrB043B23 none Between collinear conserved genes
JCVI_31720 1258 KBrH004B20 none Between collinear conserved genes
JCVI_41745 490 KBrB043L02 A. thaliana F7O18 Within protein-coding gene
JCVI_6195 720 KBrH009D02 none Between collinear conserved genes
JCVI_8626 708 KBrH125N23 none Between collinear conserved genes
* E-value threshold < 1E-10
** "Collinear conserved genes" refers to genes of B. rapa and A. thaliana that show conserved synteny
BMC Plant Biology 2009, 9:50 />Page 9 of 10
(page number not for citation purposes)
against each BAC sequence using BLASTN 2.0MP-WashU
[20-Apr-2005] [23] implemented on a Linux cluster with
an initial E-value threshold parameter of 1 × 10
-50
. Posi-
tive hits were saved and the corresponding transcript
assemblies were then re-aligned against the genomic
sequence with BLAT [24] using a sequence identity thresh-
old of 95%. Coordinates of the BLAT alignment blocks
were parsed to GFF format with the annotation Perl script
and loaded into the MySQL database driving the Genome
browser, which is also directly accessible via a program-
matic interface to allow querying.
In addition, full details of the composition of the 95 k uni-
gene set were loaded into a separate MySQL database
which can be interrogated through a web front-end also at
. This database may be searched
with text terms or fragments (which will be wild-carded)
for matches on a number of fields, including assembly or
singleton identifier, the identifier, gene name, description
or source organism of the best UniProt BLASTX hit and,
where appropriate, the identifiers, tissue sources and
source Brassica species of the ESTs contributing to an
assembly. Search results are returned in HTML tabular
form and, where appropriate, are marked up with hyper-
links to GBrowse views, EBI sequence and InterPro
descriptions and NCBI dbEST records. The sequence of
the unigene is also returned and, if it appears on the array,
the 60-mer Agilent probe designed is rendered in lower
case.
Finally, the DNA sequences of all members of the 95 k
unigene set are available for similarity matching through
a BLAST server at />95k_blast.html and the fasta sequence file is downloada-
ble from the FTP site ftp://149.155.100.41/pub/brassica/
Brassica_95k_EST_assembly.fasta.
Competing interests
The authors declare that they have no competing interests.
Authors' contributions
IB conceived of the study, participated in its design and
coordination, and helped to draft the manuscript. MT and
ND conceived and implemented the BAC annotation and
assembly database and helped to draft the manuscript. FF
grew the plants and prepared the RNA. EKL participated in
the design of the microarray, helped formulate the exper-
imental design and the drafting of the manuscript. PH
participated in the design of the microarray. FC and CT
performed the EST assembly and analysis and supplied
the output files for microarray design. AM performed sta-
tistical computing on the output files, including explora-
tory analysis and statistical inference of the significant
differential transcriptional abundance. All authors read
and approved the final manuscript.
Additional material
Acknowledgements
We would like to thank Stefan Abel for supplying us with the resynthesised
B. napus lines and Jonathan Clarke of the JIC Genome Laboratory for advice
on microarray platforms and logistics. This work was funded by the UK Bio-
technology and Biological Sciences Research Council (BB/E017363 and
competitive strategic grant to JIC).
References
1. Warwick SI, Black LD: Molecular systematics of Brassica and
allied genera (Subtribe Brassicinae, Brassiceae) – Chloroplast
genome and cytodeme congruence. Theor Appl Genet 1991,
82:81-92.
2. U N: Genome analysis in Brassica with special reference to
the experimental formation of B. napus and peculiar mode of
fertilization. Jpn J Bot 1935, 7:389-452.
3. Arumuganthan K, Earle ED: Nuclear DNA content of some
important plant species. Plant Mol Biol Report 1991, 9:208-218.
4. Inaba R, Nishio T: Phylogenetic analysis of Brassiceae based on
the nucleotide sequences of the S-locus related gene, SLR1.
Theor Appl Genet 2002, 105:1159-1165.
5. Lagercrantz U, Lydiate D: Comparative genome mapping in
Brassica. Genetics 1996, 144:1903-1910.
6. Parkin IAP, Sharpe AG, Keith DJ, Lydiate DJ: Identification of the
A and C genomes of amphidiploid Brassica napus (oilseed
rape). Genome 1995, 38:1122-1131.
7. Lysak MA, Koch MA, Pecinka A, Schubert I: Chromosome triplica-
tion found across the tribe Brassiceae. Genome Res 2005,
15:516-525.
8. Parkin IAP, Gulden SM, Sharpe AG, Lukens L, Trick M, Osborn TC,
Lydiate DJ: Segmental Structure of the Brassica napus
Genome Based on Comparative Analysis With Arabidopsis
thaliana. Genetics 2005, 171:765-781.
Additional file 1
Spreadsheet 1. Unigenes for which probes report significant (P < 0.001)
differences between expression levels in B. napus 1 and B. napus 2
Click here for file
[ />2229-9-50-S1.xls]
Additional file 2
Spreadsheet 2. Classification of qualitative expression patterns reported
for unigenes
Click here for file
[ />2229-9-50-S2.xls]
Additional file 3
Spreadsheet 3. Classification of expression patterns of unigenes for which
probes report significant (P < 0.001) differences between expression levels
in B. napus 1 and B. napus 2. Definition of classification terms; non-
additive: expression in one or both B. napus lines departs from that
expected for additive expression of the values observed in the parent lines;
cytoplasm-specific: expression in B. napus matches the characteristics of
that in the maternal parent line; unclassified: insufficient data are avail-
able to permit classification. The small variation in intensity values
reported for a given genotype arises from normalizations being performed
independently for each pairwise comparison conducted.
Click here for file
[ />2229-9-50-S3.xls]
Publish with BioMed Central and every
scientist can read your work free of charge
"BioMed Central will be the most significant development for
disseminating the results of biomedical research in our lifetime."
Sir Paul Nurse, Cancer Research UK
Your research papers will be:
available free of charge to the entire biomedical community
peer reviewed and published immediately upon acceptance
cited in PubMed and archived on PubMed Central
yours — you keep the copyright
Submit your manuscript here:
/>BioMedcentral
BMC Plant Biology 2009, 9:50 />Page 10 of 10
(page number not for citation purposes)
9. Schranz ME, Lysak MA, Mitchell-Olds T: The ABC's of compara-
tive genomics in the Brassicaceae: building blocks of crucifer
genomes. Trends in Plant Sci 2006, 11:535-542.
10. O'Neill CM, Bancroft I: Comparative physical mapping of seg-
ments of the genome of Brassica oleracea var alboglabra that
are homoeologous to sequenced regions of the chromo-
somes 4 and 5 of Arabidopsis thaliana. Plant Journal 2000,
23:233-243.
11. Rana D, Boogaart T van den, O'Neill CM, Hynes L, Bent E, Macpher-
son L, Park JY, Lim YP, Bancroft I: Conservation of the micro-
structure of genome segments in Brassica napus and its
diploid relatives. Plant J 2004, 40:725-733.
12. Park JY, Koo DH, Hong CP, Lee SJ, Jeon JW, Lee SH, Yun PY, Park
BS, Kim HR, Bang JW, Plaha P, Bancroft I, Lim YP: Physical mapping
and microsynteny of Brassica rapa ssp. pekinensis genome
corresponding to a 222 kb gene-rich region of Arabidopsis
chromosome 4 and partially duplicated on chromosome 5.
Mol Gen Genomics 2005, 274:579-588.
13. Town CD, Cheung F, Maiti R, Crabtree J, Haas BJ, Wortman JR, Hine
EE, Althoff R, Arbogast TS, Tallon LJ, Vigouroux M, Trick M, Bancroft
I: Comparative genomics of Brassica oleracea and Arabidopsis
thaliana reveals gene loss, fragmentation and dispersal fol-
lowing polyploidy. Plant Cell 2006, 18:1348-1359.
14. Yang TJ, Kim JS, Kwon SJ, Lim KB, Choi BS, Kim JA, Jin M, Park JY, Lim
MH, Kim HI, Lee MC, Lim YP, Kang JJ, Hong JH, Kim CB, Bhak J, Ban-
croft I, Park BS: Sequence-level analysis of the diploidization
process in the triplicated FLC region of Brassica rapa. Plant Cell
2006, 18:1339-1347.
15. Song K, Lu P, Tang K, Osborn TC: Rapid genome change in syn-
thetic polyploids of Brassica and its implications for polyploid
evolution. Proc Natl Acad Sci USA 1995, 92:7719-7723.
16. Gaeta RT, Pires JC, Iniguez-Luy F, Leon E, Osborn TC: Genomic
Changes in Resynthesized Brassica napus and Their Effect on
Gene Expression and Phenotype. Plant Cell 2007, 19:3403-17.
17. Galbraith DW: DNA microarray analysis in higher plants.
OMICS: A Journal of Integrative Biology 2006, 10:455-47.
18. Cheung F, Trick M, Drou N, Wilkinson P, Lim YP, Scott R, Town C,
Bancroft I: Comparative analysis between homoeologous
genome segments of B. napus and its progenitor species
reveals extensive sequence-level divergence. in press.
19. Cavell AC, Lydiate DC, Parkin IAP, Dean C, Trick M: Collinearity
between a 30-centimorgan segment of Arabidopsis thaliana
chromosome 4 and duplicated regions within the Brassica
napus genome. Genome 1998, 41:62-69.
20. Pertea G, Huang X, Liang F, Antonescu V, Sultana R, Karamycheva S,
Lee Y, White J, Cheung F, Parvizi B, Tsai J, Quackenbush J: TIGR
Gene Indices clustering tools (TGICL): a software system for
fast clustering of large EST datasets. Bioinformatics 2003,
19:651-652.
21. Stein LD, et al.: The generic genome browser: a building block
for a model organism system database. Genome Res 2002,
12:1599-610.
22. Smyth GK: Linear models and empirical Bayes methods for
assessing differential expression in microarray experiments.
Statistical Applications in Genetics and Molecular Biology 2004, 3(1):
[ />]. Article 3
23. Gish W: BLAST. 1996 [
].
24. Kent WJ: BLAT – The BLAST-Like Alignment Tool. Genome
Res 2002, 4:656-664.