báo cáo khoa học: " Detection and validation of single feature polymorphisms using RNA expression data from a rice genome array" pot
Bạn đang xem bản rút gọn của tài liệu. Xem và tải ngay bản đầy đủ của tài liệu tại đây (1011.88 KB, 10 trang )
BioMed Central
Page 1 of 10
(page number not for citation purposes)
BMC Plant Biology
Open Access
Research article
Detection and validation of single feature polymorphisms using
RNA expression data from a rice genome array
Sung-Hyun Kim
1
, Prasanna R Bhat
1
, Xinping Cui
2
, Harkamal Walia
1
, Jin Xu
2
,
Steve Wanamaker
1
, Abdelbagi M Ismail
3
, Clyde Wilson
4
and
Timothy J Close*
1
Address:
1
Department of Botany and Plant Sciences, University of California, Riverside, CA 92521 USA,
2
Department of Statistics, University of
California, Riverside, CA 92521 USA,
3
International Rice Research Institute, Manila, Philippines and
4
United States Department of Agriculture
Agricultural Research Service, George E Brown Jr, Salinity Laboratory, Riverside, CA 92507 USA
Email: Sung-Hyun Kim - ; Prasanna R Bhat - ; Xinping Cui - ;
Harkamal Walia - ; Jin Xu - ; Steve Wanamaker - ;
Abdelbagi M Ismail - ; Clyde Wilson - ; Timothy J Close* -
* Corresponding author
Abstract
Background: A large number of genetic variations have been identified in rice. Such variations
must in many cases control phenotypic differences in abiotic stress tolerance and other traits. A
single feature polymorphism (SFP) is an oligonucleotide array-based polymorphism which can be
used for identification of SNPs or insertion/deletions (INDELs) for high throughput genotyping and
high density mapping. Here we applied SFP markers to a lingering question about the source of salt
tolerance in a particular rice recombinant inbred line (RIL) derived from a salt tolerant and salt
sensitive parent.
Results: Expression data obtained by hybridizing RNA to an oligonucleotide array were analyzed
using a statistical method called robustified projection pursuit (RPP). By applying the RPP method,
a total of 1208 SFP probes were detected between two presumed parental genotypes (Pokkali and
IR29) of a RIL population segregating for salt tolerance. We focused on the Saltol region, a major
salt tolerance QTL. Analysis of FL478, a salt tolerant RIL, revealed a small (< 1 Mb) region carrying
alleles from the presumed salt tolerant parent, flanked by alleles matching the salt sensitive parent
IR29. Sequencing of putative SFP-containing amplicons from this region and other positions in the
genome yielded a validation rate more than 95%.
Conclusion: Recombinant inbred line FL478 contains a small (< 1 Mb) segment from the salt
tolerant parent in the Saltol region. The Affymetrix rice genome array provides a satisfactory
platform for high resolution mapping in rice using RNA hybridization and the RPP method of SFP
analysis.
Published: 29 May 2009
BMC Plant Biology 2009, 9:65 doi:10.1186/1471-2229-9-65
Received: 23 October 2008
Accepted: 29 May 2009
This article is available from: />© 2009 Kim et al; licensee BioMed Central Ltd.
This is an Open Access article distributed under the terms of the Creative Commons Attribution License ( />),
which permits unrestricted use, distribution, and reproduction in any medium, provided the original work is properly cited.
BMC Plant Biology 2009, 9:65 />Page 2 of 10
(page number not for citation purposes)
Background
A SFP is a polymorphism detected by a single probe in an
oligonucleotide array [1]. SFPs represent SNPs, INDELs or
both. A polymorphism within a transcribed sequence
might reflect a biologically pertinent variation within the
encoded protein or a regulatory element located in an
untranslated region. Therefore, SFPs detected using oligo-
nucleotide microarrays designed for expression analysis
can provide function-associated genetic markers.
We initially developed the RPP method of SFP discovery
using the Affymetrix barley genome array [2] and then
applied this method to rice [3]. A distinguishing compo-
nent of our method is the use of complex RNA as a surro-
gate for rice genomic DNA, eliminating genome size and
interference from highly repetitive DNA as technical
impediments to SFP detection. Another distinguishing
element of our method is that RPP first utilizes a probe set
level analysis to identify SFP-containing probe sets and
then chooses only the one or two most discriminatory
probes from within each SFP-containing probe set.
SFPs have been identified using oligonucleotide microar-
rays in several species. In yeast [4] and Arabidopsis [1],
SFPs were detected by hybridization of genomic DNA to
oligonucleotide microarrays. SFP genotyping was accom-
plished also by hybridization of mRNA to an oligonucle-
otide-expression array in yeast [5]. More recently, SFPs
were identified in rice using hybridization of genomic
DNA to an oligonucleotide microarray [6,7].
Here we analyzed RNA expression data using the RPP
method to detect SFPs among a salt-tolerant rice recom-
binant inbred line (RIL), FL478, and its presumed paren-
tal rice genotypes, Pokkali and IR29, as described
previously [2,3]. FL478 was developed from an indica
cross between salt-tolerant Pokkali and salt-susceptible
IR29 [8-10]. Gregorio et al. (1997) identified salt-tolerant
and salt-sensitive RILs [9]. One of the RILs, FL478 (F2-
derived F8) was among the most salt tolerant.
Our purpose in the present study was to apply higher den-
sity SFP analysis to a lingering question about the nature
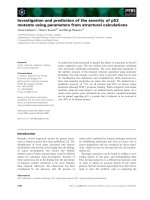
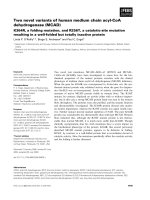
Rice pseudomolecule map showing positions of SFPs detected in this studyFigure 1
Rice pseudomolecule map showing positions of SFPs detected in this study. SFPs in FL478 detected as Pokkali or
IR29 haplotype by RPP method are shown in squares (pink) and triangles (yellow), respectively. Stars and vertical bars indicate
the positions of the centromeres and the ends of chromosomes, respectively. Horizontal bar (blue) means the Saltol region.
Chromosome
0 5 10 15 20 25 30 35 40 45 (Mb)
1
2
3
4
5
6
7
8
9
10
11
12
Pokkali-derived SFP
IR29-derived SFP
Centromere
BMC Plant Biology 2009, 9:65 />Page 3 of 10
(page number not for citation purposes)
of salt tolerance in RIL FL478, following our previous
report that the only SFP markers that we were aware of in
the vicinity of the Saltol locus in FL478 originated from
the salt sensitive parent.
Results and discussion
SFP detection and validation
By applying higher density SFP analysis than previously, a
total of 1208 SFP probes were detected in the present anal-
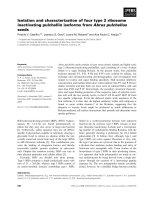
ysis (Figure 1, Additional file 1). Plots of the log intensi-
ties, affinity differences and individual outlying scores for
a representative probe set (Os.33510.1.S2_at) are shown
in Figure 2. The intensity differentiation between Pokkali
and FL478 is highest at probes 4 and 3, indicating poly-
morphism at these probe positions. A representative
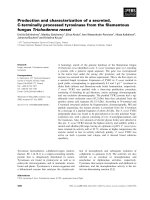
alignment of the amplicon sequences with the target
sequence of Os.33510.1.S2_at probe set is shown in Fig-
ure 3. Several SNPs were detected, but only probe posi-
tions 3 and 4 span a SNP. Probe 4 was selected as a SFP by
the RPP method based on a higher outlying score than
that of probe 3 (Figure 2).
SFPs detected in Saltol region by RPP method
We explored the source of the Saltol region in FL478
because several reports demonstrated the importance of
this region for salt tolerance, and because our prior report
SFP detection in a probe set by RPP methodFigure 2
SFP detection in a probe set by RPP method. (Left panel) Plots of the log intensities (PM, perfect match) for the repre-
sentative probe set (Os.33510.1.S2_at) from three genotypes. (Middle panel) Plots of the differentiations of average log intensi-
ties among three genotypes. (Right panel) Plots of individual outlying scores. P, Pokkali; I, IR29; F, FL478. After Cui et al. (2005)
[2].
Pokkali
…
IR29
Pokkali
…
FL478
IR29
…
FL478
BMC Plant Biology 2009, 9:65 />Page 4 of 10
(page number not for citation purposes)
[3] suggested that the Saltol region of FL478 may have
originated from the salt sensitive parent. Bonilla et al.
(2002) [8] initially delimited Saltol as a QTL controlling
three traits (low Na
+
absorption, high K
+
absorption and
low Na
+
/K
+
ratio) within a 15 cM segment of the rice
genetic map with peak LOD score > 6.7 (Figure 4). A
major QTL for high shoot K
+
concentration under salt
stress also was identified in the same region [11]. More
recently, Ren et al. (2005) identified the SKC1 gene
encoding a sodium transporter and demonstrated that it is
a determinant of salt tolerance in the Saltol region [12].
In prior work we reported that all of the SFPs detected in
the Saltol region of FL478 were consistent with an IR29
origination (salt sensitive parent) [3], indicating either
that FL478 received its salt tolerance from other QTL or
that we did not have sufficient SFP marker density in this
region to detect a small region of the genome from the salt
tolerant parent. Subsequent to the Walia et al. (2005)
work [3], we extended the list of SFPs to examine the Saltol
region in more detail. This was accomplished by: 1) con-
sidering all probe sets including those with "_s", "_x" or
"_a" in the probe set name in order to give higher SFP den-
sity and 2) updating the gene model annotations availa-
ble from />. An
explanation of these suffixes is in the Affymetrix Gene-
Chip design manual, which is available from the Affyme-
trix website. The suffix "_at" at the end of every probe set
means antisense transcript. A lack of another suffix means
that all probes in the probe set are unique to the particular
sequence used for the array design. The "x" indicates that
at least one probe is a perfect match to another sequence.
The "a" indicates that all probes are a perfect match to
another sequence in the same gene family and the "s"
indicates that all probes are a perfect match to a sequence
in another gene family.
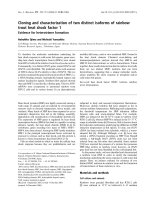
These actions revealed additional SFPs in the Saltol region,
increasing the total to 21 SFPs among which one corre-
sponding to gene model LOC_Os01g20120 was identical
to the Pokkali allele (Table 1, Figure 4), not IR29. This
gene model is adjacent to the SKC1 gene
(LOC_Os01g20160) which as stated above is known to be
a salt tolerance gene [12].
Nucleotide sequence alignment of amplicon sequences of a probe setFigure 3
Nucleotide sequence alignment of amplicon sequences of a probe set. Polymorphic residues are highlighted in gray.
Bars 0–10 indicate the positions of eleven probes in the probe set (Os.33510.1.S2_at). The position of SFP probe number 4
detected by the RPP method is double-underlined. Arrows indicate SNPs. P, Pokkali; I, IR29; F, FL478; S, target sequence from
SIF.
2
AAAT TCAACTCGGAAGAACTCTTCTAACACTTAATCGTTTGTCAATCCCTGAGCCACTGAGGTACTAGG AAGGAAACAAATGA
AAAT TCAACTCGGAAGAACTCTTCTAACACTTAATCGTTTGTCAATCCCTGAGCCACTGAGGTACTAGG AAGGAAACAAATGA
AAAT TCAACTCGGAAGAACTCTTCTAACACTTAATCGTTTGTCAATCCCTGAGCCACTGAGGTACTAGG AAGGAAACAAATGA
AAAT TCAACTCGGAAGAACTCTTCTAACACTTAATCGTTTGTCAATCCCTGAGCCACTGAGGTACTAGG AAGGAAACAAATGA
0
1
2
I
F
P
S
: 8
3
: 8
3
: 8
3
: 8
3
2
_at
CATACTGGTAAAGCTTTTATTGTTTTCTATCATTATAATAGCTCTTTTTCTTTTTTGCTTATT CTTTGGTCTGATTCTTTGGA
0
1
5
I
F
P
S
: 166
: 166
: 166
: 166
C ATACTGCTAAAGCTTTTATTATT TTCTATCATTATGATAGCTCTTTTTCTTTTTTGCTTATTCTTTG GTATGATTCTTTGG
A
C ATACTGGTAAAGCTTTTATTATT TTCTATCATTATAATAGCTCTTTTTCTTTTTTGCTTATTCTTTG GTCTGATTCTTTGG
A
C ATACTGGTAAAGCTTTTATTATT TTCTATCATTATAATAGCTCTTTTTCTTTTTTGCTTATTCTTTG GTCTGATTCTTTGG
A
s
.33510.1.S
2
T
TCATTCTCATGTAACCATAGTTTGCTTCCTGGAACTTGTGTGTTGTATGTATCTGCCAATTTTGGTACCCATGGCTGTGTA
A
T
TCATTCTCATGTAACCATAGTTTGCTTCCTGGAACTTGTGTGTTGTATGTATCTGCCAATTTTGGTACCCATGGCTGTGTA
A
T
T
C
A
T
T
C
T
C
A
T
G
T
A
A
C
C
A
T
A
G
T
T
T
G
C
T
T
C
C
T
G
G
A
A
C
T
T
G
T
G
T
G
T
T
G
T
A
T
G
T
A
T
C
T
G
C
C
A
A
T
T
T
T
G
G
T
A
C
C
C
A
T
G
G
C
T
G
T
G
T
A
A
4
3
5 7
I
F
P
: 249
: 249
:
2
4
9
O
s
G
T
A
G
A
T
T
T
G
T
A
G
A
G
A
A
A
C
A
A
C
C
C
T
G
T
A
A
A
T
C
C
G
G
T
G
A
T
T
T
C
A
T
T
C
T
C
A
T
G
T
A
A
C
C
A
T
A
G
T
T
T
G
C
T
T
C
C
T
G
G
A
A
C
T
T
G
T
G
T
G
T
T
G
T
A
T
G
T
A
T
C
T
G
C
C
A
A
T
T
T
T
G
G
T
A
C
C
C
A
T
G
G
C
T
G
T
G
T
A
A
T
TCATTCTCATGTAACCATAGTTTGCTTCCTGGAACTTGTGTGTTGTATGTATCTGCCAATTTTGGTACCCATGGCTGTGTA
A
4 6 8
9
F
S
P
:
2
4
9
: 249
:
2
8
7
9
10
GTAGATTTATAGAGAAACAACCCTGTAAATCCGGTGAT
G
T
A
G
A
T
T
T
G
T
A
G
A
G
A
A
A
C
A
A
C
C
C
T
G
T
A
A
A
T
C
C
G
G
T
G
A
T
G
TAGATTTATAGAGAAACAACCCTGTAAATCCGGTGAT
G
TAGATTTATAGAGAAACAACCCTGTAAATCCGGTGAT
I
F
P
S
:
2
8
7
: 28 7
: 28 7
: 28 7
BMC Plant Biology 2009, 9:65 />Page 5 of 10
(page number not for citation purposes)
Validation of SFPs in Saltol region by amplicon sequencing
In order to confirm the SFPs detected in the Saltol region,
we examined the SFP locations by amplicon sequencing.
Alignments of the amplicon sequences are shown in Fig-
ure 5. For probe set Os.55011.1.S1_x_at, which corre-
sponds to gene model LOC_Os01g20120, one SNP was
found in the amplicon sequence at the SFP probe position
and the FL478 allele was the same as in the Pokkali geno-
type. These results confirmed the SFP detection data,
which suggested that FL478 contains a Pokkali-derived
gene near SKC1 (LOC_Os01g20160). To further examine
this region we checked additional genes in the vicinity of
LOC_Os01g20120. We found that three additional genes
(LOC_Os01g19220, LOC_Os01g19400, and
LOC_Os01g20160 [SKC1]) within a < 1 Mb segment of
FL478 also are of a non-IR29 origination (Figure 6). Taken
together, it appears that FL478 contains a small non-IR29
haplotype block including SKC1 (Figure 4C), which we
did not detect previously. We could not detect a SFP in the
SKC1 gene in either the previous work or the present study
because the expression level from the probe set
(Os.30563.1.S1_at) for SKC1 was not "present" in all
expression datasets, which is a requirement of our statisti-
cal filtering method. The SKC1 sequences are shown in
Figure 6C. Surprisingly, in an apparently highly variable
region, FL478 contains a haplotype that is not identical to
either of the presumed parents. We confirmed this by
sequencing amplicons from independent reactions from
each genotype, making use of high fidelity Taq polymer-
ase (Platinum pfx DNA polymerase, Invitrogen, USA). The
existence in FL478 of an allele that matches neither IR29
nor the genotype which we know as Pokkali could be
explained by either parent being genetically not uniform
when the crosses to make RILs including FL478 were
made. This notion is consistent with records now showing
that there are actually at least eight distinct accessions
named Pokkali in the germplasm collection at Interna-
tional Rice Research Institute />.
Chromosome 1 segment associated with a major QTL for salt toleranceFigure 4
Chromosome 1 segment associated with a major QTL for salt tolerance. Genetic linkage maps showing the location
of Saltol described by Lin et al. (2004) [11] and Bonilla et al. (2002) [8] are shown in (A) and (B), respectively. (C) The segment
of pseudomolecule map showing the physical positions of the SKC1 gene [12] and loci with SFPs in the Saltol region. Numbers
in parentheses indicate physical positions (Mb) on chromosome 1.
Chr. 1
C1211 (9.81)
S2139 (11.28)
QTL for shoot
K
+
conc.
(Lin et al.,
2004)
Chr. 1
QTL for salt
tolerance, Na
+
,
K
+
and Na
+
/K
+
(Bonilla et al.
2002)
AP3206
CP03970
RM3412 (11.5)
RM8094 (11.23)
RM493 (12.20)
CP6224
RM140 (12.22)
C52903S
RM23
SKC1: LOC_Os01g20160
(11.46)
SFP1: LOC_Os01g16030 (9.02)
SFP2: LOC_Os01g16240 (9.19)
SFP3: LOC_Os01g16414 (9.32)
SFP4: LOC_Os01g16520 (9.37)
SFP5: LOC_Os01g16650 (9.44)
SFP6: LOC_Os01g17020 (9.74)
SFP7: LOC_Os01g17150 (9.85)
SFP8: LOC_Os01g18280 (10.25)
SFP9: LOC_Os01g18744 (10.56)
: LOC_Os01g19220 (10.86)
: LOC_Os01g19400 (10.97)
SFP10: LOC_Os01g20120 (11.42)
SFP11: LOC_Os01g20880 (11.63)
SFP12: LOC_Os01g20940 (11.67)
SFP13: LOC_Os01g22230 (12.48)
SFP14: LOC_Os01g23630 (13.27)
SFP15: LOC_Os01g24060 (13.54)
SFP16: LOC_Os01g25320 (14.28)
SFP17: LOC_Os01g25530 (14.45)
SFP18: LOC_Os01g26020 (14.73)
SFP19: LOC_Os01g26160 (14.79)
SFP20: LOC_Os01g26832 (15.17)
SFP21: LOC_Os01g27020 (15.38)
Non-IR29
alleles
Chr. 1
Positions of gene loci including rice
SFPs in Saltol region
ABC
BMC Plant Biology 2009, 9:65 />Page 6 of 10
(page number not for citation purposes)
Correct SFP call rate by RPP method
We examined a total of 64 putative SFPs by amplicon
sequencing (Additional file 2). Among them, 62 were
found to cover polymorphisms (~97% validation).
Among these 62 confirmed SFPs, 51 (82.2%) were posi-
tioned over a single SNP, seven (11.3%) were positioned
over an INDEL, two (3.2%) spanned one SNP and one
INDEL, one (1.6%) spanned > 1 SNP and no INDEL, and
one spanned > 1 SNP and > 1 INDEL. From this we assert
that at the threshold of top 20 percentile outlying scores,
our detection method is correct about 97% of the time (2
false positive in 64) in a priori identification of SFPs from
the Affymetrix rice genome array data using RNA-based
datasets. Winzeler et al. (1998) identified more than
3,000 polymorphisms between two yeast strains at a 5%
error rate using DNA hybridization [4]. Also, about 1,000
SFPs were identified at 3~7% error rates in yeast using
mRNA hybridization [5]. In Arabidopsis, among 3,806
predicted SFPs, 97% of known polymorphisms were
detected, which established a false negative rate of 3% [1].
Rostoks et al. (2005) used a probe level analysis of tran-
scriptome data in barley to identify 10,504 putative SFPs,
which included ~40% false positives [13]. More recently,
rice genomic DNA was hybridized to an oligonucleotide
microarray to detect SFPs [6] with an up to 20% false dis-
covery rate. The 97% validation rate (3% false positives)
from our method of RNA-based SFP detection by RPP
compares favourably to these other performance metrics.
In the single nucleotide polymorphism database (dbSNP)
of the National Center for Biotechnology Information
(NCBI), more than 5 million polymorphisms including
SNPs, small INDELs and microsatellite repeat variations
have been catalogued. Also, the International Rice
Research Institute has initiated a project to identify a large
fraction of the SNPs in germplasm pertinent to cultivated
rice through whole-genome comparisons [14]. This will
provide additional millions of rice SNPs. Our work has
shown that the existing Affymetrix rice genome array can
be used to provide some thousands of SFP markers from
a pairwise rice genotype comparison. Because a number of
researchers have been using Affymetrix microarrays for
transcriptome analyses in a range of rice RILs, NILs and
germplasm accessions, existing data files provide abun-
dant opportunities for the identification of additional SFP
markers and resolution of trait determinants without
additional expenditure on materials or data acquisition.
Therefore, application of the RPP method to existing data
could augment, or sometimes obviate the need for, other
markers to meet objectives such as map-based cloning
and sub-Mb resolution of the position of trait determi-
nants. Examples of such applications would be to define
Table 1: Rice SFP probe sets in the Saltol region
Probe set name Gene model
a
Position of 5' end Annotation
b
E-value IR29
c
Sequenced
Os.35495.1.S1_s_at LOC_Os01g16030 9020854 Putative ADP-ribosylation factor protein 1.00E-101 + NO
Os.455.1.S1_at LOC_Os01g16240 9192919 Putative calmodulin protein 7.00E-81 + YES
Os.37639.1.S1_at LOC_Os01g16414 9320117 Actin family protein 0 + YES
Os.37842.1.S1_at LOC_Os01g16520 9374978 Glutamyl-tRNA synthetase family protein 0 + YES
Os.247.1.S1_at LOC_Os01g16650 9442463 Putative ubiquitin-conjugating enzyme X
protein
1.00E-109 + YES
Os.14702.1.S1_a_at LOC_Os01g17020 9746901 Expressed protein 1.00E-136 + YES
Os.7948.1.S1_a_at LOC_Os01g17150 9856128 Expressed protein 2.00E-74 + YES
Os.29809.2.S1_x_at LOC_Os01g18280 10259724 SNF7 family protein 0 + NO
Os.3655.1.S1_at LOC_Os01g18744 10562090 Transferase family protein 0 + YES
Os.55011.1.S1_x_at LOC_Os01g20120 11427774 Expressed protein 0 - YES
Os.45751.1.A1_x_at LOC_Os01g20880 11637965 Protein kinase domain containing protein 1.00E-123 + YES
Os.13500.2.S1_x_at LOC_Os01g20940 11676292 Putative dual specificity protein phosphatase
family protein
0+YES
Os.35123.1.S1_at LOC_Os01g22230 12482404 Peroxidase family protein 0 + YES
OsAffx.23355.1.S1_s_at LOC_Os01g23630 13274139 Transcription initiation factor IID, 18kD
subunit family protein
1.00E-104 + NO
Os.24895.1.S1_at LOC_Os01g24060 13543313 Putative Importin alpha-1b subunit protein 0 + YES
Os.33510.1.S2_at LOC_Os01g25320 14285672 TolA protein 0 + YES
Os.25255.1.S1_at LOC_Os01g25530 14454283 Putative PPR986-12 protein 0 + YES
Os.18293.1.S1_at LOC_Os01g26020 14734782 Expressed protein 1.00E-44 + YES
Os.40545.1.S1_x_at LOC_Os01g26160 14792157 Putative HASTY protein 0 + YES
Os.12845.1.S1_at LOC_Os01g26832 15177467 Hypothetical protein 1.00E-178 + YES
Os.4023.1.S1_at LOC_Os01g27020 15386316 Putative transposon protein, unclassified 0 + YES
a
Rice gene models recorded from rice pseudomolecules, release 4 of the Institute of Genomic Research (TIGR).
b
Putative proteins were annotated by BLASTN search of TIGR rice pseudomolecules, release 4.
c
FL478 allele exactly matches the sequence of IR29 allele (+) or does not (-)
BMC Plant Biology 2009, 9:65 />Page 7 of 10
(page number not for citation purposes)
introgressed regions in NILs or to generate moderate den-
sity linkage maps from RIL populations. Also, SFPs can
provide a reliable discovery component in the develop-
ment of markers for other detection systems including
SNPs, CAPS, DArT, and SSRs.
Conclusion
We identified a small (< 1 Mb) segment from the salt tol-
erant parent, presumably a Pokkali accession, in the Saltol
region of RIL FL478 using SFP analysis with confirmation
by amplicon sequencing. This small segment is flanked by
alleles identical to those in the salt sensitive parent IR29.
This study shows that the Affymetrix rice genome array,
designed for expression analysis, provides a satisfactory
genetic marker system for mapping in rice using RNA
hybridization and the RPP method of SFP analysis.
Methods
Plant materials
Seeds of rice (Oryza sativa) genotypes Pokkali, IR29 and
FL478 were obtained from G. B. Gregorio at the Interna-
tional Rice Research Institute in the Philippines and then
propagated at the USDA/ARS George E. Brown, Jr., US
Salinity Laboratory in Riverside, CA. Seedlings of the three
genotypes were grown and stored at -80°C until DNA
extraction.
Genomic DNA isolation
Genomic DNA was extracted from seedlings of the three
genotypes using a DNeasy Plant Mini Kit (Qiagen, USA)
according to the manufacturer's protocol. For each geno-
type, more than seven seedlings were ground and about
0.1 g of pulverized tissue was processed. Purified genomic
Alignments of SFPs in the Saltol regionFigure 5
Alignments of SFPs in the Saltol region. Polymorphic residues are highlighted in gray. The locus corresponding to each
probe set is indicated in parentheses. Arrows indicate SNPs. Bar, INDEL. P, Pokkali; I, IR29; F, FL478; S, target sequence from
SIF.
G C CT TC T- - TG AA TC GA TGA T G
G C CT TC TC ACC T TG AA TC GA TGA T G
G C CT TC TC ACC T TG AA TC GA TGA T G
G C CT TC TC ACCT T GA ATC G A T G ATG
I
F
P
S
Os.247.1.S1_at
(LOC_Os01g16650)
A
T G GTT C ATG C ATC T CAT T GGA A TT
A
T G GTT C ATG C ATC T CAG T GGA A TT
A
T G GTT C ATG C ATC T CAG T GGA A TT
A T GGT T CAT G CAT C TCA G TGG A ATT
I
F
P
S
Os.4023.1.S1_at
(LOC_Os01g27020)
A T TT G TCT C TT T GTA AC CAC A T TT G
A T TT G CCT C TT T GTA AC CAC A T TT G
A T TT G CCT C TT T GTA AC CAC A T TT G
A T TT G TC T CTT T GT A AC C ACA TT TG
I
F
P
S
Os.12845.1.S1_at
(LOC_Os01g26920)
GTT T C A GC T T G T TA G C C A TC T A G G A
GTT T C A GC T T G T TA G C C G TC T A G G A
GTT T C A GC T T G T TA G C C G TC T A G G A
GT T T C A GC T T G T T AG C C G T CT A G G A
I
F
P
S
Os.18293.1.S1_at
(LOC_Os01g26020)
GATCGGCTATATCTATTGTTGCTCT
GATCAGCTATATCTATTGTTGCTCT
GATCAGCTATATCTATTGTTGCTCT
GATCAGCTATATCTATTGTTGCTCT
I
F
P
S
Os.25255.1.S1_at
(LOC_Os01g25530)
G A TG GTT T C TGG A A CAG C AA AT AC A
G A TG GTT T C TGG A A CAG C AG AT AC A
G A TG GTT T C TGG A A CAG C AG AT AC A
G A TG GTT T CT GGA A CA GCA A AT ACA
I
F
P
S
Os.37842.1.S1_at
(LOC_Os01g16520)
G G TC TG AT TC TTT G G ATTC A TT CT C
G G TA TG AT TC TTT G G ATTC A TT CT C
G G TC TG AT TC TTT G G ATTC A TT CT C
G G TC TG AT TC TTT G G ATTC A TT CT C
I
F
P
S
Os.33510.1.S2_at
(LOC_Os01g25320)
G
G C GG C TGAA C TC CG TC AT GT CA TG
G
G C AG C TGAA C TC CG TC AT GT CA TG
G
G C AG C TGAA C TC CG TC AT GT CA TG
G G CA GC TGA A C TCC G TC AT GTC A TG
I
F
P
S
Os.455.1.S1_at
(LOC_Os01g16240)
T C AGC C TTC C TAC C AGC T AAA T ATG
TCAGC C T T C C T A CCA G C T A A A T ATG
TCAGC C T T C G T A CCA G C T A A A T ATG
TCAGC C T T C G T A CCA G C T A A A T ATG
I
F
P
S
Os.37639.1.S1_at
(LOC_Os01g16414)
I
F
P
S
Os.24895.1.S1_at
(LOC_Os01g24060)
T A CT TTT A C CTT C CT TTC A G TAG C G
T A CT TT TA CCG T CC TT TC A G TAG C
G
T A CT TT TA CCT T CC TT TC A G TAG C
G
T A CT TT TA CCT T CC TT TC A G TAG C
G
I
F
P
S
Os.7948.1.S1_a_at
(LOC_Os01g17150)
AG T T TC T GT C C AT G CC T C GG C AG A G
A
GT T T CT G TC C AT G C CT CG G C AG A G
A
GT T T CT G TC C AT G A CT CG G C AG A G
A
GT T T CT G TC C AT G A CT CG G C AG A G
I
F
P
S
Os.14702.1.S1_a_at
(LOC_Os01g17020)
G G GT TTT G AC A T ACG T AT T C CAT C A
G G GT TTT G AC A T ACG T AT T C CAT C
A
G G GT TTT G AC A T ACA T AT T C CAT C
A
G G GT TTT G AC A T ACA T AT T C CAT C
A
GAGAC A A A T G T T T TCCATA A T A G C A
GAGAC A A A T G T T T TCCATG A T A G C A
GAGAC A A A T G T T T TCCATA A T A G C A
GAGACAAATGT T T T C C ATGATAGCA
I
F
P
S
Os.55011.1.S1_x_at
(LOC_Os01g20120)
A AACCGGATTTGTTAACAAG
A AACCGGATTTGTTAACAAG
A AACCGGATTTGTTAACAAG
AGTACTACACGGATTTGTTAACAAG
I
F
P
S
Os.3655.1.S1_at
(LOC_Os01g18744)
I
F
P
S
Os.45751.1.A1_x_at
(LOC_Os01g20880)
G C AC AG AT GA CA TA GC TC TG GGA T C
G C AC AG AT GA CA TA GC TC TC GGA T C
G C AC AG AT GA CA TA GC TC TC GGA T C
G C AC AG AT GA CA TA GC TC TC GG ATC
G T GC TA C T AAT A T AT T C GCT A C TCC
G T GC TA CT AA TAT A T TC AC TA CTC C
G T GC TA CT AA TAT A T TC GC TA CTC C
G T GC TA CT AA TAT A T TC GC TA CTC C
I
F
P
S
Os.35123.1.S1_at
(LOC_Os01g22230)
BMC Plant Biology 2009, 9:65 />Page 8 of 10
(page number not for citation purposes)
DNA was quantified at 260 nm using a spectrophotome-
ter.
SFP identification by RPP method
We produced RNA expression data using the Affymetrix
rice GeneChip hybridized with cRNA synthesized from
shoot tissue RNA of young seedling of three rice genotypes
with and without salt stress, essentially as described previ-
ously [3]. The dataset was from seven chips with Pokkali
RNA, five chips with IR29 and six chips with FL478. The
Affymetrix rice GeneChip consists of probe sets designed
for 48,564 japonica and 1,260 indica sequences http://
www.affymetrix.com/. For SFP detection, we applied the
RPP method to each probe set that had a "present" call in
all chip samples from each pair of genotypes under com-
parison: (1) Pokkali versus IR29, (2) Pokkali versus
FL478, (3) IR29 versus FL478. Using the top 20 percentile
of all overall outlying scores as a cutoff, SFP probes were
compiled. FL478 alleles presumed to be inherited from
IR29 were then obtained as the SFPs detected in compari-
sons (1) and (2) but not (3). Similarly FL478 alleles pre-
sumed to be from Pokkali were obtained as the SFPs
detected in (1) and (3) but not (2). As described in Cui et
al. (2005) [2], the RPP method first measures the overall
outlyingness of each probe set. Probe sets with signifi-
cantly high outlying scores are then analyzed at the probe
level and the probes that make a sufficiently large contri-
bution to overall outlyingness of the probe set are identi-
fied as SFP probes.
Primer design
We obtained the target sequence of each probe set from
the sequence information file (SIF) for the Affymetrix rice
genome array />. The target
sequence corresponds to the 5' end of the 5'-most probe
to the 3' end of the 3'-most probe. To obtain the corre-
Alignments of amplicon sequences of genes in a small segment of the Saltol region from the non-IR29 parentFigure 6
Alignments of amplicon sequences of genes in a small segment of the Saltol region from the non-IR29 parent.
Polymorphic residues of (A) LOC_Os01g19220, (B) LOC_Os01g19400 and (C) LOC_Os01g20160 (SKC1 gene) are high-
lighted in gray. Arrows indicate SNPs or INDEL. P, Pokkali; I, IR29; F, FL478.
GGTCG G C GCGTGGG A G TACTGC A A GCAGCT C A CCTAC A A G GCCGGGG T G TCCTCG C C GCCGGC G T GCCCG G C C GTGAACG T G GCCAGC C A CGCGTG C C AG : 100
GGTCG G C GCGTGGG A G TACTGC A A GCAGCT C A CCTAC A A G GCCGGGG T G TCCTCG C C GCCGGC G T GCCCG G C C GTGAACG T G GCCAGC C A CGCGTG C C AG : 100
GGTCG G C GCGTGGG A G TACTGC A A GCAGCT C A CCTAC A A G GCCGGGG T G TCCTCG C C GCCGGC G T GCCCG G C C GTGAACG T G GCCAGC C A CGCGTG C C AG : 100
I
F
P
A
GAGGA G G TCAGCTT C G CCGTCA C G GTGGCC A A CACGG G C G GCAGGGA C G GCACCC A C GTCGTG C C GGTGT A C A CGGCGCC G C CGGCCG A G GTGGAC G G CG : 200
GAGGA G G TCAGCTT C G CCGTCA C G GTGGCC A A CACGG G C G GCAGGGA C G GCACCC A C GTCGTG C C GGTGT A C A CGGCGCC G C CGGCCG A G GTGGAC G G CG : 200
GAGGA G G TCAGCTT C G CCGTCA C G GTGGCC A A CACGG G C G GCAGGGA C G GCACCC A C GTCGTG C C GGTGT A C A CGGCGCC G C CGGCCG A G GTGGAC G G CG : 200
I
F
P
CGCCG C G GAAGCAG C T GGTGGC G T TCCGGC G G GTGCG G G T GGCCGCG G G CGCCGC C G TCGAGG T G GCCTT C G C GCTCAAC G T GTGCAA G G CGTTCG C G AT
C
G
C
C
G
C
G
G
A
A
G
C
A
G
C
T
G
G
T
G
G
C
G
T
T
C
C
G
G
C
G
G
G
T
G
C
G
G
G
T
G
G
C
C
G
C
G
G
G
C
G
C
C
G
C
C
G
T
C
G
A
G
G
T
G
A
C
C
T
T
C
G
C
G
C
T
C
A
A
C
G
T
G
T
G
C
A
A
G
G
C
G
T
T
C
G
C
G
A
T
: 300
3
0
0
I
P
0
1g19220
CGTCGA G G A GACGGCG T A C ACCGTCG T G C CGTCGGG A G TCAGCAGG G T CCTCGTCG G A GACGACGC G C TGTCGCTG T C CTTCCCTG T T CAGATCGA C C T G : 4 0 0
CGTCGA G G A GACGGCG T A C ACCGTCG T G C CGTCGGG A G TCAGCAGG G T CCTCGTCG G A GACGACGC G C TGTCGCTG T C CTTCCCTG T T CAGATCGA C C T G : 4 0 0
CGTCGA G G A GACGGCG T A C ACCGTCG T G C CGTCGGG A G TCAGCAGG G T CCTCGTCG G A GACGACGC G C TGTCGCTG T C CTTCCCTG T T CAGATCGA C C T G : 4 0 0
I
F
P
C
G
C
C
G
C
G
G
A
A
G
C
A
G
C
T
G
G
T
G
G
C
G
T
T
C
C
G
G
C
G
G
G
T
G
C
G
G
G
T
G
G
C
C
G
C
G
G
G
C
G
C
C
G
C
C
G
T
C
G
A
G
G
T
G
A
C
C
T
T
C
G
C
G
C
T
C
A
A
C
G
T
G
T
G
C
A
A
G
G
C
G
T
T
C
G
C
G
A
T
CGCCG C G GAAGCAG C T GGTGGC G T TCCGGC G G GTGCG G G T GGCCGCG G G CGCCGC C G TCGAGG T G GCCTT C G C GCTCAAC G T GTGCAA G G CGTTCG C G AT
:
3
0
0
: 300
I
F
LOC_Os
0
CAGGC G G CAGCA T A G CAGCATA G GTTCTCT G C AATTCT T G GAGTTC G T T GGATTC T T TTGCTG G G GTGGTA A A AGGT
CAGGC G G CAGCA T A G CAGCATA G TTTCTCT G C AATTCT T G GAGTTC G T T GGATTC T T TTGCTG G G GTGGTA A A AGGT
CAGGC G G CAGCA T A G CAGCATA G GTTCTCT G C AATTCT T G GAGTTC G T T GGATTC T T TTGCTG G G GTGGTA A A AGGT
: 477
: 477
: 477
I
F
P
B
B
1
g19400
TGAAG T T GAGTT G T C TTGAAGT G GGTCACT A T GAAAAC T A TCAGCT G T CATTAT A C TTAACT G G GAAAA T G C AATGA A G T TATTTTC T G ATTTCT C C TGA
TGAAG T T GAGTT G T C TTGAAGT G GGTCACT A T GAAAAC T A TCAGCT G T CATTAT A C TTATCT G G GAAAA T G C AATGA A G T TATTTTC T G ATTTCT C C TGA
TGAAG T T GAGTT G T C TTGAAGT G GGTCACT A T GAAAAC T A TCAGCT G T CATTAT A C TTAACT G G GAAAA T G C AATGA A G T TATTTTC T G ATTTCT C C TGA
I
F
P
: 100
: 100
: 100
LOC_Os0
1
A
GTGCT C T ACTTGC A A AATGAT T T GCTATC G C TGGACT T A AGAACT T G TCAGAC A T TGAGCA G T TGCAGT G C AATTT C T A TG
A
GTGCT C T ACTTGC A A AATGAT T T GCTATC G C TGGACT T A AGAATT T G TCAGAC A T TGAGCA G T TGCAGT G C AATTT C T A TG
A
GTGCT C T ACTTGC A A AATGAT T T GCTATC G C TGGACT T A AGAACT T G TCAGAC A T TGAGCA G T TGCAGT G C AATTT C T A TG
I
F
P
: 182
: 182
: 182
C
I
F
P
C
TTTTTTTTTTCGGGGTTATGCATGTAAGCAAGTA
C
TTTTTTTTTTTTGGGTAATGCATGTAAGCAAGTA
C
T
T
T
T
T
T
T
T
T
C
T
G
G
G
T
A
A
T
G
C
A
T
G
T
A
A
G
C
A
A
G
T
A
K
C1
F
C
T
T
T
T
T
T
T
T
T
-
C
T
G
G
G
T
A
A
T
G
C
A
T
G
T
A
A
G
C
A
A
G
T
A
S
K
BMC Plant Biology 2009, 9:65 />Page 9 of 10
(page number not for citation purposes)
sponding indica rice genomic sequences, each target
sequence was searched using BLASTN against the indica
rice whole genome shotgun sequences in the NCBI data-
base />PlantBlast.shtml?10. The indica sequences (cv. 93-11)
were aligned with the target sequence using AlignX in Vec-
tor NTI Advance 10 (Invitrogen, USA). HarvEST:RiceChip
[15] was used to check the position of SFP probes in each
target sequence. Primers were designed using Primer3
/>primer3_www.cgi/[16]. The primers are listed in Addi-
tional file 3.
PCR
PCR was performed in 20 μl containing 25~50 ng of
genomic DNA, 0.1 μM of specific primers, 0.2 mM dNTPs,
and 1 unit of Taq (GenScript Corp., USA) DNA polymer-
ase. The reaction included a 5 min denaturation at 95°C
followed by 35 cycles of PCR (94°C, 30 sec; 55~65°C, 70
sec; 72°C, 60 sec), and a final 5 min at 72°C. Aliquots (4
μl) of the PCR products were separated on a 1.2% agarose
gel to check the band size and quantity. PCR products
were purified using QIAquick PCR purification Kit (Qia-
gen, USA) to prepare for sequencing.
DNA sequence analysis
DNA sequencing was performed by the dideoxynucle-
otide chain termination method [17]. The amplified PCR
products (amplicons) were sequenced with an ABI-PRISM
3730×l Autosequencer (ABI, USA). These sequences were
then compared with the target sequence of each probe set
using AlignX (Invitrogen, USA). Comparisons of nucle-
otide sequence similarity were displayed using GeneDoc
[18]. Rice genomic amplicon sequences have been depos-
ited in the GenBank Data Library under accession num-
bers [GenBank:EF589163
–EF589342 and EU099042–
EU099056
].
Authors' contributions
SHK, HW, AMI and TJC designed the experiment. SHK,
PRB, and HW performed the research. XC and JX accom-
plished the statistical analysis. SW produced Har-
vEST:RiceChip. CW provided the plant materials. SHK
and TJC wrote most of the paper. All authors read and
approved the final manuscript.
Authors' information
Current address of JX is Department of Statistics and Actu-
arial Science, East China Normal University, Shanghai
200241, China. Current address of HW is Department of
Plant Pathology, University of California, Davis, CA
95616, USA.
Additional material
Acknowledgements
The authors thank Dr. Jan T. Svensson and Dr. Livia Tommasini for helpful
discussions and technical assistance. This work was supported by a grant
from the International Rice Research Institute under the USAID Linkage
Program to AMI and in part by the Korea Research Foundation Grant
funded by the Korean Government (MOEHRD) (KRF-2005-214-C00229)
to SHK.
References
1. Borevitz JO, Liang D, Plouffe D, Chang HS, Zhu T, Weigel D, Berry
CC, Winzeler E, Chory J: Large-scale identification of single-fea-
ture polymorphisms in complex genomes. Genome Res 2003,
13:513-523.
2. Cui X, Xu J, Asghar R, Condamine P, Svensson JT, Wanamaker S,
Stein N, Roose M, Close TJ: Detecting single-feature polymor-
phisms using oligonucleotide arrays and robustified projec-
tion pursuit. Bioinformatics 2005, 21:3852-3858.
3. Walia H, Wilson C, Condamine P, Liu X, Ismail AM, Zeng LH, Wan-
amaker SI, Mandal J, Xu J, Cui XP, Close TJ: Comparative tran-
scriptional profiling of two contrasting rice genotypes under
salinity stress during the vegetative growth stage. Plant Physiol
2005, 139:822-835.
4. Winzeler EA, Richards DR, Conway AR, Goldstein AL, Kalman S,
McCullough MJ, McCusker JH, Stevens DA, Wodicka L, Lockhart DJ,
Davis RW: Direct allelic variation scanning of the yeast
genome. Science 1998, 281:1194-1197.
5. Ronald J, Akey JM, Whittle J, Smith EN, Yvert G, Kruglyak L: Simul-
taneous genotyping, gene-expression measurement, and
detection of allele-specific expression with oligonucleotide
arrays. Genome Res 2005, 15:284-291.
6. Kumar R, Qiu J, Joshi T, Valliyodan B, Xu D, Nguyen HT: Single fea-
ture polymorphism discovery in rice. PLoS ONE 2007, 3:e284.
Additional file 1
SFP probe sets detected in this study, their probe numbers, predicted
origin of each FL478 allele, and other information. The data provided
represent information about SFP probe sets including gene model, anno-
tation, the probe numbers and predicted origin of each FL478 allele.
Click here for file
[ />2229-9-65-S1.pdf]
Additional file 2
Sequenced SFP probe sets and the information of each SFP position.
The data show the information including gene models, chromosome num-
bers of sequenced SFP probe sets, and nucleotide sequences at SNP or
INDEL of each SFP position.
Click here for file
[ />2229-9-65-S2.pdf]
Additional file 3
Primer list and amplicon lengths of sequenced SFP-containing probe
sets. The data represent primer sequences for amplicon sequencing of the
SFP-containing probe sets and their amplicon lengths.
Click here for file
[ />2229-9-65-S3.pdf]
Publish with BioMed Central and every
scientist can read your work free of charge
"BioMed Central will be the most significant development for
disseminating the results of biomedical research in our lifetime."
Sir Paul Nurse, Cancer Research UK
Your research papers will be:
available free of charge to the entire biomedical community
peer reviewed and published immediately upon acceptance
cited in PubMed and archived on PubMed Central
yours — you keep the copyright
Submit your manuscript here:
/>BioMedcentral
BMC Plant Biology 2009, 9:65 />Page 10 of 10
(page number not for citation purposes)
7. Edwards JD, Janda J, Sweeney MT, Gaikwad AB, Liu B, Leung H, Gal-
braith DW: Development and evaluation of a high-through-
put, low-cost genotyping platform based on oligonucleotide
microarrays in rice. Plant Methods 2008, 4:13.
8. Bonilla P, Dvorak J, Mackill D, Deal K, Gregorio G: RFLP and SSLP
mapping of salinity tolerance genes in chromosome 1 of rice
(Oryza sativa L.) using recombinant inbred lines. Philipp Agric
Scientist 2002, 85:68-76.
9. Gregorio GB, Senadhira D, Mendoza RD: Screening rice for salin-
ity tolerance. In IRRI Discussion Paper Series Number 22 International
Rice Research Institute, Manila, Philippines; 1997.
10. Gregorio GB, Senadhira D, Mendoza RD, Manigbas NL, Roxas JP,
Guerta CQ: Progress in breeding for salinity tolerance and
associated abiotic stresses in rice. Field Crops Res 2002,
76:91-101.
11. Lin HX, Zhu MZ, Yano M, Gao JP, Liang ZW, Su WA, Hu XH, Ren
ZH, Chao DY: QTLs for Na
+
and K
+
uptake of the shoots and
roots controlling rice salt tolerance. Theor Appl Genet 2004,
108:253-260.
12. Ren ZH, Gao JP, Li LG, Cai XL, Huang W, Chao DY, Zhu MZ, Wang
ZY, Luan S, Lin HX: A rice quantitative trait locus for salt tol-
erance encodes a sodium transporter. Nat Genet 2005,
37:1141-1146.
13. Rostoks N, Borevitz JO, Hedley PE, Russell J, Mudie S, Morris J, Car-
dle L, Marshall DF, Waugh R: Single-feature polymorphism dis-
covery in the barley transcriptome. Genome Biol 2005, 6:R54.
14. Mcnally KL, Bruskiewich R, Mackill D, Buell CR, Leach JE, Leung H:
Sequencing multiple and diverse rice varieties. Connecting
whole-genome variation with phenotypes. Plant Physiol 2006,
141:26-31.
15. HarvEST: Affymetrix Rice version 1.01. . [web version: http://
www.harvest-web.org; download from: />16. Rozen S, Skaletsky HJ: Primer3 on the WWW for general users
and for biologist programmers. In Bioinformatics Methods and Pro-
tocols (Methods in Molecular Biology) Edited by: Krawetz S, Misener S.
Totowa, NJ: Humana Press; 2000:365-386.
17. Sanger F, Nicklen S, Coulson AR: DNA sequencing with chain
terminating inhibitors. Proc Natl Acad Sci USA 1977,
74:5463-5467.
18. Nicholas KB, Nicholas HBJ, Deerfield DW II: GeneDoc: analysis
and visualization of genetic variation. EMBNEW NEWS 1997,
4:14.