báo cáo khoa học: " Comparative gene expression profiles between heterotic and non-heterotic hybrids of tetraploid Medicago sativa" pps
Bạn đang xem bản rút gọn của tài liệu. Xem và tải ngay bản đầy đủ của tài liệu tại đây (421.01 KB, 12 trang )
BioMed Central
Page 1 of 12
(page number not for citation purposes)
BMC Plant Biology
Open Access
Research article
Comparative gene expression profiles between heterotic and
non-heterotic hybrids of tetraploid Medicago sativa
Xuehui Li
1
, Yanling Wei
1
, Dan Nettleton
2
and E Charles Brummer*
1
Address:
1
Center for Applied Genetic Technologies, University of Georgia, Athens, Georgia 30602, USA and
2
Department of Statistics, Iowa State
University, Ames, Iowa 50011, USA
Email: Xuehui Li - ; Yanling Wei - ; Dan Nettleton - ; E
Charles Brummer* -
* Corresponding author
Abstract
Background: Heterosis, the superior performance of hybrids relative to parents, has clear
agricultural value, but its genetic control is unknown. Our objective was to test the hypotheses that
hybrids expressing heterosis for biomass yield would show more gene expression levels that were
different from midparental values and outside the range of parental values than hybrids that do not
exhibit heterosis.
Results: We tested these hypotheses in three Medicago sativa (alfalfa) genotypes and their three
hybrids, two of which expressed heterosis for biomass yield and a third that did not, using
Affymetrix M. truncatula GeneChip arrays. Alfalfa hybridized to approximately 47% of the M.
truncatula probe sets. Probe set signal intensities were analyzed using MicroArray Suite v.5.0 (MAS)
and robust multi-array average (RMA) algorithms. Based on MAS analysis, the two heterotic
hybrids performed similarly, with about 27% of genes showing differential expression among the
parents and their hybrid compared to 12.5% for the non-heterotic hybrid. At a false discovery rate
of 0.15, 4.7% of differentially expressed genes in hybrids (~300 genes) showed nonadditive
expression compared to only 0.5% (16 genes) in the non-heterotic hybrid. Of the nonadditively
expressed genes, approximately 50% showed expression levels that fell outside the parental range
in heterotic hybrids, but only one of 16 showed a similar profile in the non-heterotic hybrid. Genes
whose expression differed in the parents were three times more likely to show nonadditive
expression than genes whose parental transcript levels were equal.
Conclusion: The higher proportions of probe sets with expression level that differed from the
parental midparent value and that were more extreme than either parental value in the heterotic
hybrids compared to a non-heterotic hybrid were also found using RMA. We conclude that
nonadditive expression of transcript levels may contribute to heterosis for biomass yield in alfalfa.
Background
Heterosis is a phenomenon in which offspring show
increased fitness relative to their parents [1]. In classic
quantitative genetics, three main hypotheses have been
proposed to explain heterosis [2]. One is the dominance
hypothesis, which suggests heterosis results from the com-
plementation of favorable alleles of different loci in F
1
hybrids. Under the dominance hypothesis, each hetero-
Published: 13 August 2009
BMC Plant Biology 2009, 9:107 doi:10.1186/1471-2229-9-107
Received: 25 February 2009
Accepted: 13 August 2009
This article is available from: />© 2009 Li et al; licensee BioMed Central Ltd.
This is an Open Access article distributed under the terms of the Creative Commons Attribution License ( />),
which permits unrestricted use, distribution, and reproduction in any medium, provided the original work is properly cited.
BMC Plant Biology 2009, 9:107 />Page 2 of 12
(page number not for citation purposes)
zygous locus in F
1
hybrids contributes to a trait value
within the range of the two homozygous parents, but
summing locus effects across the genome gives the hybrid
its advantage over its parents. The second is the over-dom-
inance hypothesis, which states that a heterozygous locus
in an F
1
hybrid will perform better than either
homozygous locus in parents; therefore, heterozygosity
per se causes heterosis. Finally, the third hypothesis sug-
gests that epistasis plays the predominant role in heterosis
expression, and recent evidence in Arabidopsis shows that
it plays a role in heterosis of biomass [3]. All three hypoth-
eses postulate that physical allelic variation between par-
ents results in allelic interactions at given loci in F
1
hybrids, which in turn causes heterosis. Although not
always explicitly stated, all three mechanisms concur-
rently may play a role in heterosis.
The underlying genetic causes of heterosis are not under-
stood. Alleles at a given locus may be expressed at differ-
ent levels [4,5], and heterosis may be explained at the
molecular level by the combined allelic expression in F
1
hybrids, and in particular, by nonadditive expression, at
each locus involved in a trait [6]. Nonadditive expression
in transcript levels could be classified in two ways. First,
the hybrid expression level could be different from the
midparental value but within the range of the parental
values. Second, the hybrid expression could be outside of
the parental expression level, such that the hybrid's
expression is significantly above the high parent or below
the low parent.
Nonadditive expression in F
1
hybrids has been docu-
mented in several cases. In maize, Auger et al [7] used
northern blot assays to analyze 30 transcripts in two
maize inbred lines and their two reciprocal hybrids and
found that 19 and 20 transcripts showed nonadditive
expression. Of the 24 genes showing nonadditive expres-
sion in at least one hybrid, 16 showed hybrid patterns that
fell outside the parental range of expression. More recent
microarray experiments conducted on the same maize
hybrid family (B73 × Mo17) have shown ~20% of genes
show nonadditive expression [8,9]. However, these two
experiments differed in the number of genes whose
expression was higher or lower than the parental values,
ranging from about 14% of genes [9] to nearly none [8].
Similar experiments have been conducted in Arabidopsis,
Drosophila, and rice [10-13], all of which show substan-
tial nonadditive gene expression, but the number of genes
whose expression was outside the parental range is varia-
ble. However, the different degrees and types of nonaddi-
tive expression observed in these studies could be due to
biological, technical, and/or statistical analysis differ-
ences, so generalizations about nonadditive gene expres-
sion in hybrids across studies and species are difficult.
Unfortunately, none of these experiments assessed gene
expression in hybrids that do not show a heterotic
response for the trait of interest, making conclusions that
nonadditive expression is related to heterosis difficult to
support. More recently, an analysis of six hybrids express-
ing varying levels of high parent heterosis for different
seedling traits found similar expression patterns among
the hybrids [14]. The authors suggest that differences in
transcriptional diversity among parents, rather than
expression patterns per se in hybrids, may be involved
with heterosis expression.
Cultivated Medicago sativa (alfalfa) is a tetrasomic tetra-
ploid consisting of two major subspecies, M. sativa subsp.
sativa and subsp. falcata. Hybrids between these groups
often express heterosis for biomass yield and other quan-
titative traits [15-19]. This finding may help breeders
improve the yield of this important forage crop, which has
recently seen productivity plateau [18,20]. While these
field-based observations demonstrate the potential for
heterosis expression in alfalfa, a fuller understanding of
the molecular genetic mechanisms causing heterosis
could assist breeders in reliably creating high-yielding
hybrids.
In this experiment, we grew three tetraploid alfalfa
hybrids, two of which expressed heterosis for biomass
yield in field experiments and a third that did not [18],
and assessed global gene expression using Affymetrix
Medicago GeneChip arrays. With these data, we tested the
hypotheses that (i) more genes with nonadditive expres-
sion levels would be identified in heterotic than in non-
heterotic hybrids when hybrids were compared to their
respective parents, (ii) more genes would show expression
levels that were higher than the high parent or lower than
the low parent in heterotic than in non-heterotic hybrids,
and (iii) the two heterotic hybrids would similar numbers
of genes would show non-additive expression levels or
levels of expression outside the parental range.
Results
The signal intensities of the 24 arrays (6 entries × 4 repli-
cations) were consistent across the four replications of
each individual entry as well as across all entries. No
arrays were obvious outliers in terms of median or distri-
bution of signal intensities (data not shown).
Heterosis expression
The hybrids H12 and H13 showed significant mid-parent
heterosis for biomass, while hybrid H23 did not (Table 1).
The entries we used in this experiment were grown in the
growth chamber, but the biomass production we meas-
ured in this experiment showed the same relative patterns
of heterosis as observed previously in field experiments
[18]. The low yield of WISFAL-6 is attributable to its
slower regrowth compared to the two sativa parents.
BMC Plant Biology 2009, 9:107 />Page 3 of 12
(page number not for citation purposes)
Probe set hybridization patterns based on MAS detection
calls
Of the total 61,278 probe sets on the Medicago chip,
25,604 (41.8%) were 'present' in at least one of the six
entries in this experiment. Of these probe sets, 71.0%
were present in all entries, 20.8% were present in two to
five entries, and 8.2% were unique to one entry. The
61,278 probe sets were designed from 3 species: M. sativa,
M. truncatula, and S. meliloti. About 90.6% (1,711 of
1,888) of the probe sets derived from M. sativa but only
46.6% (23,700 of 50,905) of those from M. truncatula and
1.2% (99 of 8,305) of those from S. meliloti were scored as
present in at least one of the six entries. Of these probe
sets, 90.4%, 69.7% and 1.0%, respectively, were present in
all entries and 2.0%, 8.4% and 71.7%, respectively, were
present only in one single entry. Because our experimental
material was M. sativa, the observed hybridization per-
centages are not surprising. The 10% of M. sativa genes
that were not present in any individual may represent
genes that were not expressed in leaves at this develop-
mental stage and under these environmental conditions,
or that were expressed at a level too low to be detected.
Comparisons between parents
MAS results
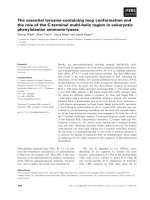
Of the 24,356 probe sets that were present in at least one
of the three parents, 18,796 were present in all parents
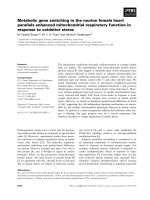
and 2,975 were only present in a single parent (Figure 1).
The number of probe sets present in only one parent did
not differ substantially among the three parents, and P1
(WISFAL-6), which derived from M. sativa subsp. falcata,
is not obviously different from the two subsp. sativa par-
ents in terms of hybridization efficiency.
Of the probe sets present in at least one parent, 10,130
showed different expression levels among the three par-
ents. For the non-heterotic parent pair P2–P3, 4,222 of
23,341 probe sets (18.1%) were found to be differentially
expressed between parents, while for the heterotic parent
pairs, 7,062 of 23,522 (30.0%) were differentially
expressed between P1 and P2, and 7,227 of 23,230
(31.1%) between P1 and P3 (Table 2). Despite the varia-
tion among parent pairs in the number of differentially
expressed genes, each parent in each pair had higher
expression for about half of the probe sets (Table 2).
The probe sets with significantly different expression
between each pair of parents had between 1.16 and 1141
fold change, with an overall median fold change of 1.93;
all three parent pairs showed similar median fold change
(Table 2). Considering only those probe sets having at
least a 2-fold difference in expression, 1,960 probe sets
displayed different expression for the non-heterotic par-
ent pair P2–P3, compared to 3,196 and 3,385 for the het-
erotic parent pairs P1–P2 and P1–P3, respectively (Table
2). Of the probe sets that had different expression
between parents, only about 6–8% were present in one
parent and absent in the other (Table 2). This indicated
that transcriptional diversity among genotypes was
mainly due to transcript abundance rather than the pres-
ence or absence of expression.
Table 1: Dry weight for three parental alfalfa genotypes and their hybrids and the mid-parental heterosis values of the hybrids.
Entry Dry weight Mid-Parent Heterosis Hybrid vs. Midparent
g/plant p-value
P1 (WISFAL-6) 0.56
P2 (ABI408) 2.11
P3 (C96-513) 2.57
H12 (WISFAL-6 × ABI408) 2.05 0.71 0.0029
H13 (WISFAL-6 × C96-513) 2.35 0.79 0.0011
H23 (ABI408 × C96-513) 2.70 0.36 0.1295
The numbers of probe sets present in one, two, or three parental genotypesFigure 1
The numbers of probe sets present in one, two, or
three parental genotypes.
BMC Plant Biology 2009, 9:107 />Page 4 of 12
(page number not for citation purposes)
RMA results
A total of 17,387 probe sets showed different expression
levels among the three parents when analyzed with RMA.
The RMA Results showed patterns similar to the MAS
results. Heterotic parent pairs had more differentially
expressed genes than the non-heterotic parent pair and
each parent of a particular cross contributed about 50% of
the genes with higher expression (Table 2). The RMA anal-
ysis identified more differentially expressed probe sets but
fewer probe sets that showed fold changes greater than
two when compared to MAS (Table 2). Interestingly, how-
ever, only a fraction of the probe sets identified as differ-
entially expressed by MAS for a given parental pair were
also identified by RMA as being differentially expressed
for that same parental pair (P1–P2 = 23%; P1–P3 = 24%;
P2–P3 = 17%).
Comparisons between parents and their hybrid
MAS results
We further analyzed each hybrid family separately to
determine the proportion of probe sets showing nonaddi-
tive expression and the prevalence of hybrid expression
values outside the parental range of expression. Using a
cutoff of FDR < 0.15, 12.5% of probe sets displayed differ-
ent expression levels among the three entries in the non-
heterotic hybrid family H23, but in the heterotic hybrid
families, 26.3% in H12 and 27.6% in H13 showed differ-
ences (Table 3). For each hybrid family, the probe sets
with different expression can be divided into those in
which the hybrid exhibits additivity of expression relative
to its parents and those exhibiting nonadditive expres-
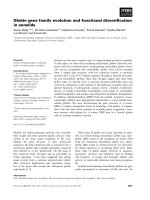
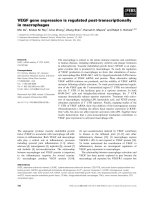
sion. We evaluated the number of probe sets with nonad-
ditive expression using four significance thresholds (p <
0.05, p < 0.01, FDR < 0.20, and FDR < 0.15). The numbers
varied dramatically among the four cutoff levels as
expected, but importantly, in all cases, the heterotic
hybrids (H12 and H13) showed substantially more non-
additively expressed probe sets than the non-heterotic
hybrid (Figure 2).
We calculated the numbers of probe sets showing nonad-
ditive expression that also had different expression levels
Table 2: The numbers and proportions of probe sets with significantly different expression levels between parental pairs, fold change in
expression levels between parents at a false discovery rate of 0.15, and numbers of genes expressed only in one genotype of each
parent pair.
Method Parental
comparison
Differentiall
y expressed
genes
Genes with higher
expression in first parent of
pair listed in second column
Fold change of all
differentially expressed
genes
Genes with
>2 fold
change
Genes present in one parent and
absent in the other
no. no. % minimum median maximum no. no. %
MAS P1 vs P2 7062 3814 54.0 1.17 1.92 711 3196 420 5.9
P1 vs P3 7227 3608 49.9 1.16 1.95 1141 3385 480 6.6
P2 vs P3 4222 2009 47.6 1.18 1.92 324 1960 329 7.8
RMA P1 vs P2 12627 6752 53.5 1.04 1.41 312.3 1890
P1 vs P3 12821 6538 51.0 1.05 1.41 180.8 2039
P2 vs P3 8147 4028 49.4 1.03 1.40 175.6 1179
Table 3: The numbers and proportions of probe sets exhibiting nonadditive expression and expression levels outside the parental
range in each hybrid family at a false discovery rate of 0.15.
MAS RMA
Probe set classification Heterotic hybrids Non-heterotic hybrid Heterotic hybrids Non-heterotic hybrid
H12 H13 H23 H12 H13 H23
no. % no. % no. % no. % no. % no. %
Present in at least one parent or
hybrid
24174 39.
4
24296 39.
6
23963 39.1
Present and differentially expressed
(MAS) or differentially expressed
(RMA)
6346 26.
3
6696 27.
6
2986 12.5 11942 12015 6209
Differentially expressed with
nonadditive expression
279 4.4 334 5.0 16 0.5 591 4.9 922 7.7 34 0.5
Non-additive expression as above or
below the parental range
128 45.
9
156 46.
7
1 6.2 329 55.
7
428 46.
4
14 41.2
The total number of probe sets on the GeneChip is 61,278.
BMC Plant Biology 2009, 9:107 />Page 5 of 12
(page number not for citation purposes)
between the parents. In all three hybrid families, a higher
proportion of nonadditively expressed genes were identi-
fied in the subset of probe sets that were differentially
expressed between parents than in those not differentially
expressed between parents. The lower limit of the 95%
confidence interval for the odds ratio under all four cut-
offs was approximately three or greater (Table 4), which
indicated that probe sets whose expression differed
between the parents had odds of nonadditive expression
that were at least three times greater than the odds of non-
additive expression for probe sets whose expression did
not differ between parents. Thus, heterotic hybrids
showed more nonadditive expression, and the proportion
of differentially expressed probe sets in heterotic parent
pairs was higher than for the non-heterotic pair.
The probe sets with nonadditive expression were divided
into two categories: (i) those in which the hybrid expres-
sion level fell within the parental range of expression and
(ii) those in which the hybrid expression value fell outside
the parental range of expression. Greater proportions of
probe sets were found to fall outside the parental range of
expression in heterotic hybrids than in the non-heterotic
hybrid based on FDR < 0.15 (Table 3) and also under the
other three statistical thresholds (data not shown).
Approximately 300 probe sets displayed nonadditive
expression in each of the heterotic hybrids, and about half
of these had expression levels that were higher than the
higher parent or lower than the lower parent (Table 3). Of
the 69 probe sets with non-additive expression that were
in common between the two heterotic hybrids, 65 did not
display nonadditive expression in the non-heterotic
hybrid H23 (see Additional file 1). In the non-heterotic
H23 hybrid family, no probe set was expressed only in the
hybrid or only in both parents. In contrast, one probe set
in H12 and 10 in H13 were expressed only in the hybrid
(see Additional file 2).
RMA results
The RMA Results were similar to the MAS Results in that
more probe sets with non-additive expression and with
expression outside of the parental range were found in
heterotic hybrid families than in non-heterotic hybrid
families (Table 3 and Figure 2). However, only two and
four probe sets showing non-additive expression over-
lapped between analysis Methods for the H12 and H13
hybrid families, respectively, and no probe sets over-
lapped for the H23 hybrid family, using a cutoff of FDR <
0.15. A total of 124 probe sets showed non-additive
expression in both heterotic hybrids, 119 of which did not
The proportion of genes showing nonadditive expression at four statistical threshold levels for the three hybridsFigure 2
The proportion of genes showing nonadditive expression at four statistical threshold levels for the three
hybrids. FDR is the false discovery rate.
0.0
5.0
10.0
15.0
20.0
25.0
30.0
35.0
40.0
%
H12 H13 H23
FDR<0.15
FDR<0.20
p<0.01
p<0.05
0.0
5.0
10.0
15.0
20.0
25.0
30.0
35.0
40.0
%
H12 H13 H2 3
FDR<0.15
FDR<0.20
p<0.01
p<0.05
MAS5.0 RMA
Table 4: Confidence limits (95%) for the ratio of the odds of
nonadditivity for probe sets that are differentially expressed
between parents to the odds of nonadditivity for probe sets that
are not differentially expressed between parents
Family p < 0.05 p < 0.01 FDR < 0.20 FDR < 0.15
H12 (5.3, 6.4) (2.9, 3.7) (3.7, 5.5) (4.2, 7.2)
H13 (6.5, 7.9) (3.7, 4.8) (4.1, 6.0) (4.8, 7.9)
H23 (18.2, 27.5) (7.7, 12.9) (9.7, 170.5) (22.6, ~)
BMC Plant Biology 2009, 9:107 />Page 6 of 12
(page number not for citation purposes)
show non-additive expression in the non-heterotic hybrid
H23 (see Additional file 3).
Validation of gene expression via quantitative Real Time
PCR (qRT-PCR)
Quantitative RT-PCR was applied to 9 probe sets to verify
the microarray data. Two of the probe sets, Mtr3074 and
Mtr43518, did not differ among the six entries and all oth-
ers showed differences in expression between at least two
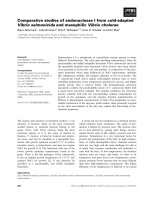
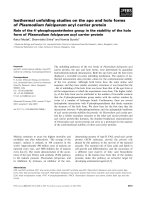
of the six entries based on the MAS data. In general, the
qRT-PCR results produced relative expression patterns
similar to those observed from the MAS analysis (Figure
3). However, some differences were evident. For
Mtr34420, several entries had different expression pat-
terns than those observed from the MAS analysis, and one
entry with a different pattern than the MAS analysis was
observed for Mtr241. A total of 135 pairwise comparisons
for expression patterns are possible among the six entries
across all nine probe sets (i.e., 15 pairwise comparisons
for each probe set). Of these 135, 90 (67%) were validated
by qRT-PCR. Out of 15 comparisons, only 4 and 5 were
validated for probe set Mtr34420 and Mtr241, respec-
tively, while 9 to 14 comparisons were validated for other
probe sets. When compared to the RMA data, 77 (57%) of
Validation of nine probe sets using quantitative Real-Time PCR (qRT-PCR)Figure 3
Validation of nine probe sets using quantitative Real-Time PCR (qRT-PCR). The log
2
-fold change of each entry rel-
ative to the entry with the minimum expression on the microarray for each probe set is plotted for both the microarray and
the qRT-PCR results. Correlations between them are shown as "r". *, ** and *** represent significance level of 0.1, 0.05 and
0.01, respectively. The standard errors are represented by the vertical bars. Note that the y-axis scale differs for each gene.
Mtr10682
-2.00
-1.00
0.00
1.00
2.00
3.00
4.00
5.00
h12 h13 h23 p1 p2 p3
r =0.82**
Log2(FC)
Microarray RT- PCR
Mtr34420
-2.00
-1.50
-1.00
-0.50
0.00
0.50
1.00
1.50
2.00
h12 h13 h23 p1 p2 p3
r=0.02
Log2(FC)
Micorarray RT- PCR
Mtr9194
-0.40
-0.20
0.00
0.20
0.40
0.60
0.80
1.00
1.20
h12 h13 h23 p1 p2 p3
r =0.79*
Log2(FC)
Mic r o a r r ay RT- PC R
Mtr3074
-0.60
-0.40
-0.20
0.00
0.20
0.40
0.60
h12 h13 h23 p1 p2 p3
r=-0.27
Log2(FC)
Mic r o a r r ay RT- PC R
Mtr241
-2.00
-1.50
-1.00
-0.50
0.00
0.50
1.00
1.50
2.00
2.50
h12 h13 h23 p1 p2 p3
r=0.5
Log2(FC)
Microarray RT-PCR
Mtr18125
-2.00
0.00
2.00
4.00
6.00
8.00
10.00
h12 h 13 h23 p 1 p2 p3
r =0.99***
Log2(FC)
Mic r o a r r ay RT- PCR
Mtr43518
-1.50
-1.00
-0.50
0.00
0.50
1.00
1.50
2.00
h12 h13 h23 p1 p2 p3
r=0.80*
Log2(FC)
Microarray RT- PCR
Mtr11026
-1.00
0.00
1.00
2.00
3.00
4.00
h12 h13 h23 p1 p2 p3
r =0.95***
Log2(FC)
Microarray RT- PCR
Mtr37570
-1.00
0.00
1.00
2.00
3.00
4.00
5.00
6.00
7.00
8.00
h12 h13 h23 p1 p2 p3
r =0.98***
Log2(FC)
Microarray RT- PCR
BMC Plant Biology 2009, 9:107 />Page 7 of 12
(page number not for citation purposes)
135 pairs of comparison were validated by qRT-PCR.
These results suggest that overall, the broad pattern of our
microarray results is an accurate depiction of the gene
expression levels among these entries.
Discussion
A number of algorithms are available for calculating the
expression intensities on Affymetrix microarrays. Among
them, MAS and RMA are two of the most widely used.
Comparative studies using spike-in or dilution controls
have suggested that RMA algorithms are more accurate
than MAS [21,22], but other experiments suggest that
detection calls effectively filtered MAS data, removing the
vast majority of false positive results, and that the filtered-
MAS data yielded better results than RMA [23-25]. The
contrasting results could be due to the different datasets,
assessments, and assessment statistics used in different
studies.
In this study, more differentially expressed genes between
parental pairs were identified by RMA than by MAS, but
smaller proportions of them showed fold changes greater
than two. This supports the hypothesis proposed by pre-
vious studies [22,25] that the RMA algorithm is more sen-
sitive, particularly at low expression levels, but this may
increase the proportion of false positive results, thereby
increasing noise in the data [25]. Given the conflicting
results of previous experiments, we analyzed our data
using both methods – MAS and RMA – to determine if the
results we obtained were consistent across analysis meth-
ods.
The entries used in this study were previously tested in a
field experiment [16,18], which showed that the heterotic
hybrids exhibited high parent heterosis for biomass yield
and that these heterotic hybrids showed greater heterosis
as the period of regrowth increased. Our growth chamber
results indicated that the heterotic hybrids exhibited mid-
parent heterosis, probably due to the shorter length of
regrowth at harvest, which we limited to three weeks to
avoid possible changes in gene expression due to flower-
ing time differences, and/or to the very different environ-
mental conditions in the chamber compared to the field.
Mid-parent heterosis for biomass may not be useful for
breeding applications, but it is meaningful for the genetic
study of heterosis because the difference between the
hybrid and the parental mean is the response variable to
be related to nonadditive expression, not their absolute
phenotypic performance.
We compared two hybrids expressing heterosis for bio-
mass yield with a third hybrid that did not express heter-
osis. The heterotic hybrid families had a higher number
and a higher proportion of genes exhibiting differential
expression and nonadditive expression than did the non-
heterotic family using either analysis method (RMA or
MAS). Higher proportions of probe sets with expression
outside of the parental range were also found in heterotic
hybrids compared to a non-heterotic hybrid. At an FDR <
0.15, we found about 300 nonadditively expressed genes
in heterotic hybrids based on MAS, about half of which
had expression outside the parental range, compared to
16 in the non-heterotic hybrid. Similar patterns were seen
with RMA. Our data suggest that genes that have non-
additive expression in the hybrid and, more importantly,
that have expression levels higher than the high parent or
lower than the low parent could play a role in heterosis for
biomass yield.
Although the two analysis methods produced broadly
similar results, different numbers of probe sets were iden-
tified as differentially expressed by the two methods and
only a small proportion of these probe sets overlapped.
The algorithms use different background correction, nor-
malization, and summarization methods [26], which
could explain the non-concordance between them. Fur-
ther investigation is needed to determine if one algorithm
more accurately identified important genes in this experi-
ment, although based on congruence with the RT-PCR
results, MAS appeared to hold a slight advantage.
Our results stand in contrast to Stupar and Springer [8]
who found very little evidence for hybrid gene expression
that were nonadditive or that exceeded parental levels,
and different from Uzarowska et al [27] who found a large
proportion of genes showing nonadditive expression
(90%) and expression outside the parental range (51%)
in maize. Our results are broadly similar to those of Swan-
son-Wagner et al [9]. However, comparisons among
experiments for the percentage of nonadditively expressed
genes need to be made cautiously for a number of reasons,
including the use of different statistical methods and
thresholds. Recently, a few studies compared the expres-
sion profiles of a set of hybrids simultaneously. Stupar et
al [14] investigated the gene expression profile of six
maize inbred-hybrid combinations with varying levels of
better parent heterosis on five traits, and found a strong
correlation between the number of differentially
expressed genes and the level of genetic distance between
inbred parents, while the proportions of nonadditive
expression among the differentially expressed genes were
similar among the hybrids. Interestingly, the hybrid with
the smallest genetic distance – and the least high-parent
heterosis for seedling traits – exhibited the greatest pro-
portion of nonadditive expression. The authors proposed
that nonadditive expression is not correlated with hetero-
sis levels. Guo et al [28] found that heterosis was corre-
lated with the proportion of additively expressed genes
but not with the proportion of genes with expression lev-
BMC Plant Biology 2009, 9:107 />Page 8 of 12
(page number not for citation purposes)
els outside of the parental range in a set of 16 maize
hybrids.
Our study only analyzed three hybrids, limiting our abil-
ity to generalize these results to other hybrids. Perhaps
more importantly, our results need to be interpreted cau-
tiously given that we used non-inbred parents. Unfortu-
nately, alfalfa suffers severe inbreeding depression, and
true inbred lines are not available. To account for the het-
erogeneity of F
1
hybrid indivduals, we pooled ten individ-
uals for each hybrid. This can potentially lead to
erroneous results, if alleles from the heterozygous parents
are not present in the progeny in equal frequencies. In this
case, the hybrid expression relative to the parental mean
may be skewed – for example, if the progeny only received
a highly expressing allele from one parent, then the over-
all hybrid expression level may be equal to or exceed the
higher parent, even though the hybrid expression level
should be additive. Without evaluating allele-specific
expression patterns, this concern is difficult to allay. We
examined the heterozygosity of the parents using 41 EST-
SSR markers. WISFAL-6 (P1) had 1.92 alleles/marker,
ABI408 (P2) had 1.95, and C96-513 had 2.15. Assuming
that the SSR allele diversity mirrors the diversity of alleles
producing different expression patterns, these results sug-
gest that the three parents would have a similar chance to
generate false expression results due to preferential allele
inheritance. Therefore, we suggest that our comparisons
among the three hybrids regarding the about the number
and proportion of genes showing nonadditive expression
are valid.
Although higher proportions of the nonadditive expres-
sion and expression higher or lower than either parent
were found in heterotic hybrids compared to a non-heter-
otic hybrid in our study, the majority of genes showed
additive expression in all hybrid families. We may have
underestimated the numbers of genes with nonadditive
expression due to limitations in our statistical power for
this experiment. However, in maize, although the F
1
hybrid between Mo17 and B73 showed significant high
parent heterosis for seedling growth, only 22% of differ-
entially expressed genes had nonadditive expression and
only a small proportion of them showed expression out-
side of the parental range, similar to our results [9].
Springer and Stupar [29] proposed that heterosis could
result from the additive expression of multiple genes,
whereby particularly low or high expression values that
are generally detrimental to the plant are modulated in
the hybrid, which expresses an average expression level in
a moderate, but more biologically functional range. While
this may be true in some cases, the clear differences in
expression patterns between hybrid types in our experi-
ment suggests that nonadditive expression may also be
important for heterosis expression.
What is heterosis? Heterosis simply represents the mani-
festation of a phenotype in a hybrid that is different from
the expectation of a parental average value for that pheno-
type, be it yield, plant height, or any other trait. The man-
ifestation of the phenotype – particularly of quantitatively
inherited traits like yield – results from the complex
actions of many components, including the timing of the
expression of various genes, the magnitude and location
of their expression, and the interaction of their gene prod-
ucts. The genetic hypothesis for the cause of heterosis that
has the most empirical support at the current time is that
each parent contains a set of dominant alleles at loci con-
trolling the trait and that at some loci, the other parent has
recessive alleles at those loci; thus, hybridization brings
these dominant alleles together, with the parents comple-
menting each other and giving the hybrid a larger set of
dominant (and desirable) alleles than either parent. Com-
plementary expression patterns – each parent contribut-
ing alleles that show higher expression than those at the
relevant loci in the other parent – could have the same
effect. Under this model, hybrids expressing heterosis
should have more nonadditive expression, as we have
shown in our alfalfa example. Given that control of com-
plex traits likely involves many genes and given that the
expression level of most genes is additive, this model does
not exclude the possibility that additivity also plays a role
in heterosis, under the model suggested by Springer and
Stupar [29].
Conceivably, only a subset of genes may need to deviate
from additivity of expression in order to produce a heter-
otic phenotype. The extent of nonadditive expression at
different development stages and different tissues may
vary and across the life cycle of the plant, the expression
patterns cumulatively produce the observed heterotic
response. Arabidopsis allotetraploids had little overlap
between the set of genes exhibiting nonadditive expres-
sion in leaves and that in flowers, suggesting a role of
developmental stages and tissue types on nonadditive
gene regulation [13]. If nonadditively expressed genes
truly do underlie heterosis, this result suggests that differ-
ent genes contribute to heterosis in different tissues and at
different developmental stages. Thus, for integrative phe-
notypes like yield, the cumulative effect of these different
genes acting at different places and times could result in
heterosis. If this is the case, then the nonadditive expres-
sion observed at a single timepoint and in a single tissue,
as we assayed here, would only give a small part of the
overall picture of how gene expression may affect the ulti-
mate expression of the yield phenotype. Finally, genetic
divergence between the parental lines appears to result in
more differential expression between parents. Both in our
study and in that in Arabidopsis by [13], a higher propor-
tion of nonadditive expression occurred in hybrids whose
parents showed divergent expression levels than in
BMC Plant Biology 2009, 9:107 />Page 9 of 12
(page number not for citation purposes)
hybrids whose parents had similar expression levels. This
suggests that there could be more nonadditive expression
in the crosses between more distantly related parents,
exactly the type of situation in which agronomically use-
ful heterosis levels are also commonly observed. How-
ever, recent results in maize suggest that this may not be
the case [14].
The expression levels of individual genes are themselves
controlled by other genes, acting in cis or trans [8,30].
Thus, heterosis for an ultimate phenotype, in this case,
biomass yield, must be controlled by multiple genes
exhibiting some level of dominance, with some residing
in each parental genome [2]. The genes themselves may
also be controlled by a number of other genes, and this
control can result in expression levels ranging from addi-
tivity to some level of non-additivity. Genes controlling
transcript levels have been inferred from experiments
mapping eQTL, that is, quantitative trait loci that control
the expression of a transcript [5,30,31]. Interestingly, no
eQTL could be mapped for some genes with highly herit-
able transcript levels in yeast, suggesting that many loci of
small effect and/or epistasis among loci controls their
expression [31].
We know that biomass yield, like many other agronomi-
cally important traits, is quantitatively inherited, suggest-
ing that it is controlled by many loci (and possibly by
multiple interactions among them), and infer that direc-
tional dominance plays a role in its control, at least in the
certain hybrids that express heterosis. As a means of
understanding the nature of the genetic mechanisms
underlying biomass yield and yield heterosis, we identi-
fied a suite of genes whose expression in hybrids is pheno-
typically nonadditive, in some cases falling outside of the
parental range, and a subset of which only show that
expression pattern in heterotic hybrids. But expression of
each individual gene is itself the result of a number of
gene interactions, and hence, the regulation of expression
of any single gene may also have a complex genetic basis.
This complexity shows that the genetic control of quanti-
tative traits is difficult to untangle because many levels of
interactions, from genes to gene expression profiles to
proteins and metabolites, occur to produce the ultimate
phenotype.
Conclusion
Gene expression profiles between two heterotic hybrids
and one non-heterotic hybrid have been compared. We
found that the heterotic hybrid families had a higher
number and a higher proportion of genes exhibiting non-
additive expression and expression levels outside the
parental range than did the non-heterotic family. We con-
cluded that nonadditive expression and expression higher
or lower than either parent might contribute to heterosis
for biomass yield. However, further research is needed in
order to clearly associate non-additive gene expression
with heterosis for biomass yield.
Methods
Plant Growth, Experiment Design and Sampling
We focused on three genotypes and their hybrids. The par-
ents consisted of one genotype from a semi-improved
germplasm of subsp. falcata, WISFAL-6 (P1), and two elite
genotypes from commercial alfalfa breeding germplasm
of subsp. sativa, ABI408 (P2) and C96-513 (P3). These
three genotypes and their hybrids (H12, H13 and H23)
have been extensively evaluated for biomass yield, nutri-
tive value, and agronomic traits in a series of previous
papers [16,18,19]. The two sativa × falcata hybrids had
previously exhibited heterosis for biomass yield and the
sativa × sativa hybrid did not when evaluated in a field
experiment [18]. For convenience in the following narra-
tive, we refer to the three parents and their three hybrid
populations as the six entries evaluated in the study. Also,
we will refer to the hybrids expressing heterosis for bio-
mass as "heterotic hybrids" and the hybrid which did not
as a "non-heterotic hybrid."
The experimental design was a randomized complete
block design (RCBD) with four replications. Each replica-
tion included 2 clones for each parent and a single clone
for each of 10 genotypes in each hybrid family, for a total
of 36 plants. Because the parents were not inbred lines, a
cross between them results in a segregating F
1
population.
Thus, the ten F
1
individuals per family represented the
hybrid population for the array experiment. Plants were
grown in growth chambers (two replications in each of
two chambers) under controlled conditions of 25°C and
a 16 hr photoperiod. After being placed into the cham-
bers, plants were maintained for 30 days at which point
all biomass was clipped to a 5 cm height above soil.
Twenty-three days following clipping, the upper fully
expanded leaf on a given stem was sampled for RNA iso-
lation and microarray analysis. We sampled five trifoliate
leaves from each of the two clones for each parent, and
one trifoliate leaf from each of 10 genotypes for each
hybrid. The leaves for each parent or hybrid were pooled
prior to RNA extraction. Leaves were harvested, quickly
frozen in liquid nitrogen, and stored at -80°C until RNA
isolation. After sampling leaves, the whole plants were cut
and dried at 60°C for four days to measure the dry weight.
Mid-parent heterosis for yield was calculated on a dry
weight basis as the difference between the mean value of
an F
1
population and the mean of the parents.
RNA isolation and hybridization
The total RNA for array hybridizations was extracted from
frozen leaf tissue with Trizol reagent using standard pro-
cedures [32]. Gene expression was assayed using Medicago
BMC Plant Biology 2009, 9:107 />Page 10 of 12
(page number not for citation purposes)
Affymetrix GeneChips, which include 61,278 genes iden-
tified from EST collections and genome sequencing data
in M. truncatula, Sinorhizobium meliloti and M. sativa,
together with hybridization controls, housekeeping con-
trols, and Poly-A controls. For the experiment, four bio-
logical replications of the six entries resulted in 24
GeneChip hybridizations.
First strand cDNA synthesis, GeneChip hybridization, and
array staining were conducted at the Iowa State University
GeneChip Facility />ties/genechip/Genechip.htm. Arrays were scanned with a
GeneChip Scanner 3000 7G. The gene expression of each
probe set on the array was determined from the scanned
signal intensities using the Affymetrix
®
MicroArray Suite
v.5.0 (MAS) software and the robust multi-array average
(RMA) software [22]. The data resulting from both meth-
ods have been uploaded to the MIAMExpress public data-
base (" />", accession
number: E-MEXP-1579).
Statistical analysis of microarray data
MAS determines the actual expression intensity of each
probe set and provides a detection call indicating whether
the estimated expression level is reliable by classifying
each probe set on each chip as present (P), marginal (M),
or absent (A). Thus, using MAS, we first compared geno-
types based on detection calls, and second based on the
actual expression intensities of each probe set, filtered by
detection call as suggested by previous studies [23,24].
With RMA, we compared genotypes based on expression
intensities of each probe set, the only result RMA pro-
vides.
Comparisons based on detection calls
Each chip contains 61,278 probe sets. Because our experi-
ment included four replications (corresponding to four
separate chips for each entry), each entry received four sig-
nal calls for each probe set. For a given entry, a probe set
that was PPPP, PPPM, PPPA, or PPMM across the four rep-
lications was designated as present, a probe set that was
MAAA or AAAA was designated as absent, and the remain-
ing probe sets were designated as marginal.
Comparisons based on expression level differences
Expression intensity data from MAS were log transformed
and normalized by median centering prior to analysis.
Using the transformed and normalized MAS data and the
RMA expression intensity data, we fit the following mixed
linear model to each probe set:
where
μ
is the overall probe set mean, G
i
(i = 1, ,6) is the
effect of the ith entry, r
j
(j = 1, ,4) is the effect of the jth
replication, and e
ij
is the random error associated with the
ith entry in the jth replication; r
j
and e
ij
were modeled as
independent normal random effects, and the others were
modeled as fixed effects.
Differential expression was evaluated (i) among the three
parental entries, (ii) between the two parents of a given
hybrid, and (iii) between the two parents and their hybrid
by testing the null hypothesis that the entries had equal
expression levels. To control for multiple testing errors,
the false discovery rate (FDR) of Benjamini and Hochberg
[33] was employed at a significance level of α = 0.15, as
has been used in other studies of this type [9]. For MAS
data, only probe sets that were identified as being present
in at least one of the entries being compared were evalu-
ated.
For each hybrid family (i.e., the two parents and their
hybrid), probe sets with nonadditive expression were
identified within the differentially expressed probe sets by
contrasting the expression levels of the hybrid with the
mean of the two parents. We were interested in whether
the numbers of genes with nonadditive expression dif-
fered between heterotic and non-heterotic hybrid fami-
lies. Therefore, we assessed four different significance level
thresholds to determine the stability of the relationship
between hybrid types, including p-values of 0.05 and 0.01
and FDR levels of 0.20 and 0.15. In order to test whether
nonadditive expression in the hybrid tended to occur for
probe sets that were differentially expressed between par-
ents, we calculated an odds ratio (OR) to compare the
number of nonadditively expressed probe sets that
showed differential expression between parents and those
that did not as follows:
where, m1 is the number of probe sets with nonadditive
expression that also showed different expression levels
between parents, n1 is the total number of probe sets
whose expression was significantly different between par-
ents, m2 is the number of probe sets with nonadditive
expression whose expression was not significantly differ-
ent between parents, and n2 is the total number of probe
sets whose expression was not significantly different
between parents. The 95% confidence limits of the odds
ratio were calculated using the EXACT statement and OR
option in the SAS procedure FREQ [34].
The probe sets that showed nonadditive expression were
classified as being (1) outside the parental range of expres-
sion (i.e., higher than the high parent or lower than the
low parent at a p-value of 0.05) or (2) within the parental
range of expression (i.e., equal to or less than the higher
YGre
ij i j ij
=+ ++
μ
OR =
−−
m
nm
m
nm
1
11
2
22
/
BMC Plant Biology 2009, 9:107 />Page 11 of 12
(page number not for citation purposes)
parent but greater than the midparental value or equal to
or greater than the lower parent but less than the midpar-
ental value at a p-value of 0.05).
For MAS data, we also identified probe sets that were only
expressed in the hybrid in each hybrid family (i.e., the
detection call was 'present' in the hybrid and 'absent' in
both parents and the actual expression level was different
between the hybrid and either parent at FDR < 0.15) and
those expressed only in both parents and not the hybrid,
using the same parameters.
Validation of gene expression via quantitative Real-Time
PCR (qRT-PCR)
In order to confirm gene expression levels detected on the
Affymetrix array, we conducted qRT-PCR for nine probe
sets. We selected these probe sets to represent a diversity
of expression profiles among the six entries. Two probe
sets (Mtr3074 and Mtr43518) did not differ among the six
entries; the other seven probe sets showed differences in
expression levels between at least two entries. The qRT-
PCR analysis was performed on first strand cDNA synthe-
sized from the same RNA samples used for the microarray
experiment. A poly dT primer and SuperScript II RNase H
Reverse Transcriptase (Cat. No. 18064-014, Invitrogen,
CA) were used to synthesize first strand cDNA. Amplifica-
tion primers (see Additional file 4) were designed using
Primer 3 [35] for nine probe sets having contrasting
expression patterns among the 6 entries based on MAS
data. The qRT-PCR was conducted using first strand cDNA
diluted 60 times on a LightCycler 480 SYBR Green I Mas-
ter (Roche Cat. No. 04-707-516-001) following the man-
ufacturer's protocol. The qRT-PCR data were initially
analyzed with the LightCycler 480 analysis software to
obtain crossing point (Cp) values for each probe set.
Authors' contributions
XL participated in experimental design, conducted the
bulk of the experimental work, analyzed the microarray
and qRT-PCR data, and drafted the manuscript. YL per-
formed qRT-PCR experiment and gene ontology analysis.
DN provided advice on statistical analysis and data expla-
nation. CB conceived, designed and supervised the study.
All authors have read and approved the final manuscript.
Additional material
Acknowledgements
This research was funded by a grant from the Plant Sciences Institute at
Iowa State University (to ECB). Support was also provided by the Raymond
F. Baker Center for Plant Breeding at Iowa State Univ. and by the University
of Georgia.
References
1. Shull GH: The composition of a field of maize. American Breeders
Assoc Rep 1908, 4:296-301.
2. Falconer DS, Mackay TFC: Introduction to Quantitative Genet-
ics. 4th edition. Longman, Essex, England; 1996.
3. Kusterer B, Muminovic J, Utz HF, Piepho HP, Barth S, Heckenberger
M, Meyer RC, Altmann T, Melchinger AE: Analysis of a triple test-
cross design with recombinant inbred lines reveals a signifi-
cant role of epistasis in heterosis for biomass-related traits in
Arabidopsis. Genetics 2007, 175(4):2009-2017.
4. Kliebenstein DJ, West MA, van Leeuwen H, Kim K, Doerge RW,
Michelmore RW, St Clair DA: Genomic survey of gene expres-
sion diversity in Arabidopsis thaliana. Genetics 2006,
172(2):1179-1189.
5. Brem RB, Yvert G, Clinton R, Kruglyak L: Genetic dissection of
transcriptional regulation in budding yeast. Science 2002,
296(5568):752-755.
Additional file 1
The putative identity of probe sets that displayed nonadditive expres-
sion in both heterotic hybrids and not in the non-heterotic hybrid
based on MAS data. The putative gene function was first cited from
Affymetrix annotation if available for the probe set of interest. If not, the
probe set target sequence provided by Affymetrix was used for BLASTn,
BLASTx and tBLASTx search against GenBank NR with expected value
lower than 1e-10.
Click here for file
[ />2229-9-107-S1.doc]
Additional file 2
Probe sets and their putative identity that were only expressed in
hybrids and not parents based on MAS data. The putative gene function
information was obtained as explained in Additional file 1.
Click here for file
[ />2229-9-107-S2.doc]
Additional file 3
The putative identity of probe sets that displayed nonadditive expres-
sion in both heterotic hybrids and not in the non-heterotic hybrid
based on RMA data. The putative gene function information was
obtained as explained in Additional file 1.
Click here for file
[ />2229-9-107-S3.doc]
Additional file 4
Primers used for qRT-PCR confirmation of microarray results
Click here for file
[ />2229-9-107-S4.doc]
Publish with BioMed Central and every
scientist can read your work free of charge
"BioMed Central will be the most significant development for
disseminating the results of biomedical research in our lifetime."
Sir Paul Nurse, Cancer Research UK
Your research papers will be:
available free of charge to the entire biomedical community
peer reviewed and published immediately upon acceptance
cited in PubMed and archived on PubMed Central
yours — you keep the copyright
Submit your manuscript here:
/>BioMedcentral
BMC Plant Biology 2009, 9:107 />Page 12 of 12
(page number not for citation purposes)
6. Birchler JA, Auger DL, Riddle NC: In search of the molecular
basis of heterosis. Plant Cell 2003, 15(10):2236-2239.
7. Auger DL, Gray AD, Ream TS, Kato A, Coe EH Jr, Birchler JA: Non-
additive gene expression in diploid and triploid hybrids of
maize. Genetics 2005, 169(1):389-397.
8. Stupar RM, Springer NM: Cis-transcriptional variation in maize
inbred lines B73 and Mo17 leads to additive expression pat-
terns in the F1 hybrid. Genetics 2006, 173(4):2199-2210.
9. Swanson-Wagner RA, Jia Y, DeCook R, Borsuk LA, Nettleton D,
Schnable PS: All possible modes of gene action are observed in
a global comparison of gene expression in a maize F1 hybrid
and its inbred parents. Proc Natl Acad Sci USA 2006,
103(18):6805-6810.
10. Gibson G, Riley-Berger R, Harshman L, Kopp A, Vacha S, Nuzhdin S,
Wayne M: Extensive sex-specific nonadditivity of gene expres-
sion in Drosophila melanogaster. Genetics 2004,
167(4):1791-1799.
11. Huang Y, Zhang L, Zhang J, Yuan D, Xu C, Li X, Zhou D, Wang S,
Zhang Q: Heterosis and polymorphisms of gene expression in
an elite rice hybrid as revealed by a microarray analysis of
9198 unique ESTs. Plant Mol Biol 2006, 62(4–5):579-591.
12. Vuylsteke M, van Eeuwijk F, Van Hummelen P, Kuiper M, Zabeau M:
Genetic analysis of variation in gene expression in Arabidop-
sis thaliana. Genetics 2005, 171(3):1267-1275.
13. Wang J, Tian L, Lee HS, Wei NE, Jiang H, Watson B, Madlung A,
Osborn TC, Doerge RW, Comai L, et al.: Genomewide nonaddi-
tive gene regulation in Arabidopsis allotetraploids. Genetics
2006, 172(1):507-517.
14. Stupar RM, Gardiner JM, Oldre AG, Haun WJ, Chandler VL, Springer
NM: Gene expression analyses in maize inbreds and hybrids
with varying levels of heterosis. BMC Plant Biology 2008, 8:33.
15. Bhandari HS, Pierce CA, Murray LW, Ray IM: Combining Abilities
and Heterosis for Forage Yield among High-Yielding Acces-
sions of the Alfalfa Core Collection. Crop Science 2007,
47:665-673.
16. Riday H, Brummer EC: Heterosis of Agronomic Traits in
Alfalfa.
Crop Science 2002, 42:1081-1087.
17. Riday H, Brummer EC: Heterosis in a Broad Range of Alfalfa
Germplasm. Crop Science 2005, 45:8-17.
18. Riday H, Brummer EC: Forage Yield Heterosis in Alfalfa. Crop
Science 2002, 42:716-723.
19. Riday H, Brummer EC, Moore KJ: Heterosis of Forage Quality in
Alfalfa. Crop Science 2002, 42:1088-1093.
20. Lamb JFS, Sheaffer CC, Rhodes LH, Sulc RM, Undersander DJ, Brum-
mer EC: Five decades of alfalfa cultivar improvement: Impact
on forage yield, persistence, and nutritive value. Crop Science
2006, 46:902-909.
21. Zhou L, Rocke DM: An expression index for Affymetrix Gene-
Chips based on the generalized logarithm. Bioinformatics 2005,
21(21):3983-3989.
22. Irizarry RA, Hobbs B, Collin F, Beazer-Barclay YD, Antonellis KJ,
Scherf U, Speed TP: Exploration, normalization, and summa-
ries of high density oligonucleotide array probe level data.
Biostatistics 2003, 4(2):249-264.
23. McClintick JN, Edenberg HJ: Effects of filtering by Present call on
analysis of microarray experiments. BMC Bioinformatics 2006,
7:49.
24. Pepper SD, Saunders EK, Edwards LE, Wilson CL, Miller CJ: The util-
ity of MAS5 expression summary and detection call algo-
rithms. BMC Bioinformatics 2007, 8:273.
25. Seo J, Bakay M, Chen YW, Hilmer S, Shneiderman B, Hoffman EP:
Interactively optimizing signal-to-noise ratios in expression
profiling: project-specific algorithm selection and detection
p-value weighting in Affymetrix microarrays. Bioinformatics
2004, 20(16):2534-2544.
26. Millenaar FF, Okyere J, May ST, van Zanten M, Voesenek LA, Peeters
AJ: How to decide? Different methods of calculating gene
expression from short oligonucleotide array data will give
different results. BMC Bioinformatics 2006, 7:137.
27. Uzarowska A, Keller B, Piepho HP, Schwarz G, Ingvardsen C, Wenzel
G, Lubberstedt T:
Comparative expression profiling in meris-
tems of inbred-hybrid triplets of maize based on morpholog-
ical investigations of heterosis for plant height. Plant Mol Biol
2007, 63(1):21-34.
28. Guo M, Rupe MA, Yang X, Crasta O, Zinselmeier C, Smith OS,
Bowen B: Genome-wide transcript analysis of maize hybrids:
allelic additive gene expression and yield heterosis. Theor Appl
Genet 2006, 113(5):831-845.
29. Springer NM, Stupar RM: Allelic variation and heterosis in
maize: how do two halves make more than a whole? Genome
Res 2007, 17(3):264-275.
30. West MA, Kim K, Kliebenstein DJ, van Leeuwen H, Michelmore RW,
Doerge RW, St Clair DA: Global eQTL Mapping Reveals the
Complex Genetic Architecture of Transcript-Level Varia-
tion in Arabidopsis. Genetics 2007, 175(3):1441-1450.
31. Brem RB, Kruglyak L: The landscape of genetic complexity
across 5,700 gene expression traits in yeast. Proc Natl Acad Sci
USA 2005, 102(5):1572-1577.
32. Puissant C, Houdebine LM: An improvement of the single-step
method of RNA isolation by acid guanidinium thiocyanate-
phenol-chloroform extraction. BioTechniques 1990,
8(2):148-149.
33. Benjamini Y, Hochberg Y: Controlling the false discovery rate: a
practical and powerful approach to multiple testing. J R Stat
Soc Ser B Methoodol 1995, 57:289-300.
34. SAS: SAS language and procedure: Usage. In Version 8 edn Cary,
NC.: SAS Institute; 2000.
35. Rozen S, Skaletsky H: Primer3 on the WWW for general users
and for biologist programmers. Methods in molecular biology
2000, 132:365-386.