báo cáo khoa học: " Mapping quantitative trait loci (QTLs) for fatty acid composition in an interspecific cross of oil palm" ppt
Bạn đang xem bản rút gọn của tài liệu. Xem và tải ngay bản đầy đủ của tài liệu tại đây (378.19 KB, 19 trang )
BioMed Central
Page 1 of 19
(page number not for citation purposes)
BMC Plant Biology
Open Access
Research article
Mapping quantitative trait loci (QTLs) for fatty acid composition in
an interspecific cross of oil palm
Rajinder Singh*
1
, Soon G Tan
2
, Jothi M Panandam
3
,
Rahimah Abdul Rahman
1
, Leslie CL Ooi
1
, Eng-Ti L Low
1
, Mukesh Sharma
4,6
,
Johannes Jansen
5
and Suan-Choo Cheah
1,7
Address:
1
Advanced Biotechnology and Breeding Centre, Biology Division, Malaysian Palm Oil Board (MPOB), No. 6, Persiaran Institusi, Bandar
Baru Bangi, 43000 Kajang, Selangor DE, Malaysia,
2
Department of Cell and Molecular Biology, Faculty of Biotechnology and Biomolecular
Sciences, Universiti Putra Malaysia, 43400 UPM Serdang, Selangor, Malaysia,
3
Department of Animal Science, Faculty of Agriculture, Universiti
Putra Malaysia, 43400 UPM Serdang, Selangor, Malaysia,
4
Research Department, United Plantations Berhad, Jenderata Estate, 36009, Teluk Intan,
Perak, Malaysia,
5
Biometris, Wageningen University and Research Centre, P.O. Box 100, 6700 AC Wageningen, the Netherlands,
6
Asian Agri
Group, Research & Development Centre, PO Box 35, Kebun Bahilang' Tebing Tinggi Deli 20600, North Sumatera, Indonesia and
7
Asiatic Centre
for Genome Technology Sdn Bhd (ACGT), Lot L3-I-1, Enterprise 4, Technology Park Malaysia, 57000 Kuala Lumpur, Malaysia
Email: Rajinder Singh* - ; Soon G Tan - ; Jothi M Panandam - ;
Rahimah Abdul Rahman - ; Leslie CL Ooi - ; Eng-Ti L Low - ;
Mukesh Sharma - ; Johannes Jansen - ; Suan-
Choo Cheah -
* Corresponding author
Abstract
Background: Marker Assisted Selection (MAS) is well suited to a perennial crop like oil palm, in which the economic
products are not produced until several years after planting. The use of DNA markers for selection in such crops can
greatly reduce the number of breeding cycles needed. With the use of DNA markers, informed decisions can be made
at the nursery stage, regarding which individuals should be retained as breeding stock, which are satisfactory for
agricultural production, and which should be culled. The trait associated with oil quality, measured in terms of its fatty
acid composition, is an important agronomic trait that can eventually be tracked using molecular markers. This will speed
up the production of new and improved oil palm planting materials.
Results: A map was constructed using AFLP, RFLP and SSR markers for an interspecific cross involving a Colombian
Elaeis oleifera (UP1026) and a Nigerian E. guinneensis (T128). A framework map was generated for the male parent, T128,
using Joinmap ver. 4.0. In the paternal (E. guineensis) map, 252 markers (199 AFLP, 38 RFLP and 15 SSR) could be ordered
in 21 linkage groups (1815 cM). Interval mapping and multiple-QTL model (MQM) mapping (also known as composite
interval mapping, CIM) were used to detect quantitative trait loci (QTLs) controlling oil quality (measured in terms of
iodine value and fatty acid composition). At a 5% genome-wide significance threshold level, QTLs associated with iodine
value (IV), myristic acid (C14:0), palmitic acid (C16:0), palmitoleic acid (C16:1), stearic acid (C18:0), oleic acid (C18:1)
and linoleic acid (C18:2) content were detected. One genomic region on Group 1 appears to be influencing IV, C14:0,
C16:0, C18:0 and C18:1 content. Significant QTL for C14:0, C16:1, C18:0 and C18:1 content was detected around the
same locus on Group 15, thus revealing another major locus influencing fatty acid composition in oil palm. Additional
QTL for C18:0 was detected on Group 3. A minor QTL for C18:2 was detected on Group 2.
Conclusion: This study describes the first successful detection of QTLs for fatty acid composition in oil palm. These
QTLs constitute useful tools for application in breeding programmes.
Published: 26 August 2009
BMC Plant Biology 2009, 9:114 doi:10.1186/1471-2229-9-114
Received: 16 December 2008
Accepted: 26 August 2009
This article is available from: />© 2009 Singh et al; licensee BioMed Central Ltd.
This is an Open Access article distributed under the terms of the Creative Commons Attribution License ( />),
which permits unrestricted use, distribution, and reproduction in any medium, provided the original work is properly cited.
BMC Plant Biology 2009, 9:114 />Page 2 of 19
(page number not for citation purposes)
Background
The oil palm is a perennial crop that belongs to the genus
Elaeis and to the botanical family Palmae. Within the
genus Elaeis, two species are distinguished, the economi-
cally important oil palm (Elaeis guineensis) originally
native to Africa and the economically less important
South American relative, Elaeis oleifera (which inherently
has lower oil yield potential). The oil palm produces two
distinct types of oil based on the fatty acid composition.
The mesocarp of the fruit produces an oil (crude palm oil
or CPO) which has a predominantly higher palmitic
(C16:0) and oleic acid (C18:1) profile. In contrast, the
endosperm (enclosed in a nut) produces oil (crude palm
kernel oil or CPKO) in which the lauric fatty acids (C12:0)
are predominant.
The main feature of the E. oleifera palm that distinguishes
it morphologically from the commercial species E.
guineensis is its procumbent trunk, distinctly smaller sized
fruits and smaller canopy. Moreover, the angle of inser-
tion of its leaflets is in a single plane as compared to a
double plane for E. guineensis [1,2]. In E. oleifera, up to
65% of the fruits tend to be parthenocarpic [1] and have
a much lower oil content [3]. As such, the oil yield of E.
oleifera is much lower, with oil to bunch ratio of 5%, as
compared to the E. guineensis (tenera) with oil to bunch
ratio of more than 25% [4]. Nevertheless, E. oleifera pos-
sess certain important characteristics that are of significant
interest to oil palm breeders. This includes the low annual
stem height increment (between 5 and 10 cm per year as
compared to between 45 to 65 cm per year for E. guineen-
sis) [1,2]. The fatty acid composition of its CPO is espe-
cially of interest since its iodine value (IV, which is a
measure of the degree of unsaturation of the oil) can be as
high as 90 as compared to the average of 53 of E. guineen-
sis [4]. The CPO derived from the E. oleifera oil has high
levels of oleic and linoleic acid and lower levels of the pal-
mitic acid and other saturated fatty acids, thus imparting
a property quite akin to olive oil in composition. In South
America, interest in the E. oleifera was driven by the fact
that it shows resistance to bud rot disease [5].
In view of the apparent lack of variability for traits associ-
ated with high oil yield within E. oleifera and because E.
guineensis has all the desired attributes for high oil yield,
the only viable proposition (using conventional plant
breeding approach) is to carry out interspecific hybridiza-
tion between the two species. Fortunately, the E. guineensis
and E. oleifera hybridize readily, producing fertile off-
spring in spite of their different areas of origin, which
implies that they share a common ancestry before the two
continents (Africa and South America) drifted apart some
110 million years ago. The fact that the two species can
still hybridize to produce viable offspring itself suggests
that the species isolation barrier is incomplete [1] despite
the millions of years of separation.
The interspecific hybridization approach is viewed as a
viable method to introgress the traits of interest i.e.
namely higher oil unsaturation (to obtain a more liquid
olein) [1,6]. This is a long term breeding strategy, with
results obtained thus far showing that oil quality, taken as
unsaturated fatty acid content, is better in the hybrids and
in their backcrosses than in the commercial E. guineensis
[1,7,8]. However, the conventional breeding approach is
severely hampered by the fact that being a perennial crop,
the oil palm has a long selection cycle of between 10 and
12 years [9]. Furthermore, it requires enormous resources
in terms of land (usually one can only plant between 136
and 148 palms per hectare), labour and field management
in breeding trials. The development of marker-assisted
selection (MAS) techniques would greatly facilitate
hybrid-breeding programmes as well as speed up the
development of planting materials with an oil composi-
tion high in unsaturated fatty acids (especially oleic fatty
acid). With MAS, selection can be carried out in segregat-
ing generations of interspecific hybrids and their back-
crosses more discriminately using molecular markers
linked to the specific fatty acids.
For the purpose of MAS, a number of DNA marker sys-
tems have been applied to genetic mapping in oil palm.
Restriction Fragment Length Polymorphism (RFLP) mark-
ers from genomic libraries have been applied to oil palm
linkage mapping [10]. This map harbouring 97 RFLP
markers in 24 groups of two or more was generated using
a selfed guineensis cross. Moretzsohn et al. [11] reported
genetic linkage mapping for a single controlled cross of oil
palm using random amplified polymorphic DNA (RAPD)
markers and the pseudo-testcross mapping strategy
described by Grattapaglia et al. [12]. More recently, Bil-
lotte et al. [13] reported a simple sequence repeat (SSR)-
based high density linkage map for oil palm, involving a
cross between a thin shelled E. guineensis (tenera)
palm
and a thick shelled E. guineensis (dura) palm. The map
consisting of 255 SSR markers and 688 amplified frag-
ment length polymorphism (AFLP) markers represents
the first linkage map for oil palm to have 16 independent
linkage groups corresponding to the haploid chromo-
some number of 16 in oil palm [14]. Mayes et al. [10],
Moretzsohn et al. [11] and Billotte et al. [13] reported the
identification of RFLP, RAPD and AFLP markers respec-
tively, linked to the shell thickness locus, an important
economic trait which exhibits monofactorial inheritance.
However, most of the traits of economic interest in oil
palm exhibit quantitative inheritance. In this area, Rance
et al. [15], expanding on the genetic map developed by
Mayes et al. [10], reported the detection of QTLs associ-
ated with vegetative and yield components of oil palm.
BMC Plant Biology 2009, 9:114 />Page 3 of 19
(page number not for citation purposes)
The work reported above represents important develop-
ments in the application of MAS in oil palm breeding pro-
grammes. Despite the advances being made and the
progress achieved in genetic mapping of oil palm, only a
limited number of economically important traits have
been tagged to date. Furthermore, none has been reported
for fatty acid composition. This is probably because of the
lower variability for most fatty acids within the E. guineen-
sis populations.
In this study, we hoped to exploit the use of complemen-
tary DNA (cDNA) probes as RFLP markers for linkage map
construction. The cDNA clones represent gene fragments
that occur in the expressed regions of the genome. Their
identity can be determined via sequencing and such
sequences are known as expressed sequence tags (ESTs).
The usefulness of ESTs as markers has been demonstrated
in several plant species [16,17]. ESTs help to map known
genes apart from providing anchor probes for compara-
tive mapping. Furthermore, mapping ESTs closely linked
to or co-segregating with a trait allows the gene for that
trait to be identified by the candidate gene approach. This
could eventually expedite the application of MAS in oil
palm breeding programmes.
The strategy adopted in this research was to capitalize on
the differences between the two species of oil palm and
use an interspecific hybrid for the analysis of QTLs associ-
ated with palm oil fatty acid composition. This study
employed both dominant (AFLP) and co-dominant
(RFLP and SSR) markers to generate a linkage map. The
map was subsequently used to locate QTLs associated
with the fatty acid composition.
Results
Marker Screening
A total of 413 polymorphic AFLP loci were scored in the
progeny by using the 67 AFLP primer pairs (Table 1). Gen-
erally, for the majority of the segregating markers scored,
405 (98%) were in the pseudo-testcross configuration
where either the male parent was heterozygous, and the
fragment was absent in the female parent (type b profile)
or vice versa (type a profile) (Table 2).
A total of 289 cDNA probes from various cDNA libraries
were tested for their ability to detect segregation in the
progeny using the RFLP approach. Of the 289 probes
screened, 71 (24.6%) showed polymorphisms with at
least one restriction enzyme, 167 (58%) were monomor-
phic and 51 (17.7%) gave no clear banding pattern. The
percentage of polymorphic probes identified (24.6%) was
similar to the rate of 25% polymorphic RFLP probes
(from genomic library) reported previously by Mayes et al.
[10] for oil palm. Out of the 71 RFLP probes showing pol-
ymorphism, 66 (93%) were inherited from the male E.
guineensis parent. Five of these 66 probes revealed two pol-
ymorphic loci each, giving a total of 71 polymorphic loci
(Tables 1 and 2). The RFLP probes used in this study
appeared to have mainly scanned the homozygous
regions of the E. oleifera parental palm that were not seg-
regating in the mapping progeny, thus reducing the
number of polymorphic probes revealed.
Among the 33 SSR primer pairs developed in the course of
this study, nine were informative and segregating in the
mapping population. Of the 20 single-locus SSR primer
pairs reported by Billotte et al. [18], seven segregated in
the mapping population. Six segregated in the male E.
guineensis parental gametes only, while one segregated in
the female E. oleifera gametes. Three of the five EST-SSRs
tested (CNH0887, CNH1537 and EAP3339) showed pol-
ymorphism in the mapping population. All three inform-
ative primer pairs segregated only in the male parent E.
guineensis gametes. Four of the informative SSR primers
segregating in the male gametes revealed two loci each
(Table 1). Information on the informative SSR primer
pairs is provided in Tables 3 and 4.
Table 1: Summary of RFLP, SSR and AFLP analysis of the interspecific hybrid mapping population
Type of
markers
No. of probes/
primer pairs
evaluated
No. of
informative
probes/primer
pairs
No. of
polymorphic
loci identified
No. of markers
showing 3:1
segregation
No. of markers showing 1:1
segregation in the gametes of
No. of markers
meeting
goodness-of-fit
to 1:1, 1:1:1:1
or 3:1 ratio
T128 UP1026
AFLP 67 67 413 8 360 45 323
RFLP 289 71 76* - 71 5 63
SSR 56 19 23** - 22
#
118
Total 512 8 453 51 404
* Five RFLP markers detected two loci each
** Four SSR primers detected two loci each
#
Three of the SSR markers showing 1:1:1:1 segregation ratio (type f and g, Table 2) were grouped here for simplicity of presentation
BMC Plant Biology 2009, 9:114 />Page 4 of 19
(page number not for citation purposes)
Of the 512 (413 AFLP, 76 RFLP and 23 SSR) markers iden-
tified segregating in the mapping population, 453 (360
AFLP, 71 RFLP and 22 SSR) were segregating in the gam-
etes of the male parent, Nigerian E. guineensis and 51
(9.9%) were segregating in the gametes of the female par-
ent, the Colombian E. oleifera (Table 1). This indicated
that the male E. guineensis parent is more heterozygous
than the female parent, E. oleifera. As such, sufficient
markers could only be generated to enable development
of a genetic linkage map for the male parent. It is therefore
concluded that it would be more appropriate to analyze
this cross as a "one-way pseudo-testcross" in which the
male, E. guineensis is considered to be the heterozygous
parent and the Colombian E. oleifera, the homozygous
parent.
Linkage analysis
Only markers showing "Type b, e, f and g" profiles (Table
2) were used for linkage analysis. Markers showing "Type
c" profile with a 3:1 segregation ratio (Table 2) were not
employed as the recombination frequencies obtained
with such markers are typically inaccurate [19]. In the ini-
tial attempt, 453 markers were shortlisted to generate a
linkage map for the male T128 parent. Fourteen markers
had to be removed from the analysis as they showed very
significant distortion (P < 0.0001). In addition, 34 mark-
ers with more than 12 missing data points were also
removed. Finally, 405 markers were used for map con-
struction. Both the independence LOD and recombina-
tion frequency methods agreed with respect to the
grouping of markers in the linkage groups. However, 15 of
the markers (11 AFLP, three RFLP and one SSR) remained
Table 2: Parent and progeny phenotypes for AFLP, RFLP and SSR markers in the mapping population
Loci defined by Parent Genotypes Progeny Genotypes Expected Segregation ratio No of Segregating Markers
a
Type Oleifera Guineensis 1 2 3 4 AFLP RFLP SSR
Single band a
___
1:1 45 4 -
b
__ _
1:1 360 47 10
c
_____
3:1 8 - -
Two alleles d
___
1:1 - 1 1
___
e
__ _
1:1 - 24 9
___
Three alleles f
___
1:1:1:1 - - 1
_____
___
Four alleles g
___
1:1:1:1 - - 2
___
__ _
___
a
Refers to the number of markers having each segregation pattern among the progeny of the UP1026 (E. oleifera) × T128 (E. guineensis) interspecific
cross
Table 3: Microsatellite loci developed in the course of this study
No. Locus name Accession Number*
1 P1A0 9722519
2 P1T6b 9722520
3 P1T12b 9722521
4 P4T8 9722522
5 P4T10 9722523
6 P4T12a 9722524
7 P4T20b 9722525
8 P1014a 9722526
9 P201b 9722527
10 CNH0887 (EST-SSR) 9722528
11 CNHI537 (EST-SSR) 9722529
12 EAP339 (EST-SSR) 9722530
* GenBank (NCBI Probe Database)
Table 4: Microsatellite locus reported by Billotte et al. [18]
No. SSR Locus EMBL Accession Number
1 mEgCIR0008 AJ271625
2 mEgCIR0009 AJ271633
3 mEgCIR0018 AJ271634
4 mEgCIR0046 AJ271635
5 mEgCIR0067 AJ271636
6 mEgCIR0377 AJ271936
7 mEgCIR1772 AJ271937
BMC Plant Biology 2009, 9:114 />Page 5 of 19
(page number not for citation purposes)
unlinked. These unlinked markers could be sampling
parts of the genome where there are few other markers, in
which case they would be very valuable in the future [20].
In the initial map constructed, markers of two linkage
groups (Groups 4 and 9) exhibited irregular patterns. In
order to improve the map order, the total number of
recombinations for each palm across linkage groups was
evaluated. Out of the 118 palms used in the analysis, eight
palms with relatively high recombination frequencies
were identified. These eight palms were then removed
from the analysis and map construction was repeated for
all groups as before using the remaining 110 palms and
the 453 markers that were shortlisted. In the second
attempt, similarly, 14 markers had to be removed from
the analysis as they showed very significant distortion (P
< 0.0001). In addition, 36 markers with more than 12
missing data points had to be removed and hence 403
markers were finally used for map construction. The same
15 markers (11 AFLP, three RFLP and one SSR) that were
unlinked in the previous attempt remained unlinked in
this effort. The new map order was generally similar to the
order produced previously and the "plausible position
analysis" showed that marker order of all groups showed
a regular pattern and all markers were indeed located at
their "best estimated position". A graphical representation
of the genetic linkage map obtained is shown in Figures 1,
2 and 3. In total, 252 markers (199 AFLP, 38 RFLP and 15
SSR) mapped in 21 linkage groups. The average number
of markers per linkage group was 12. The total genetic dis-
tance covered by the markers was 1815 cM, with an aver-
age interval of 7 cM between adjacent markers. The map
distance of the tenera T128 parental palm was close to the
tenera map distance of 1,597 cM reported by Billotte et al.
[13]. Excluding the two smallest groups (7 and 21) which
had three and four markers respectively, the length of
individual linkage groups varied from 26.1 cM to 168 cM,
with an average of 94 cM. The average length of the link-
age groups is close to the expected size of 100–150 cM
found in most agricultural crops [19].
The markers were well distributed over all the 21 linkage
groups. There was only one interval of 30 cM in Group 17.
There were no gaps larger than 25 cM in any of the other
groups. This indicates that the map is relatively homoge-
neous with regards to marker distribution and will be use-
ful for tagging traits of economic interest for the purpose
of marker-assisted selection.
Of the 71 RFLP loci used for linkage analysis, 38 were suc-
cessfully mapped. The 38 RFLP loci were generated from
37 independent cDNA probes (Table 5). The RFLP mark-
ers were generally well distributed throughout the linkage
groups. There were certain instances (e.g. Groups 17 and
19) where two RFLP markers were not interrupted by
AFLP loci, which in fact tended to flank the RFLP markers.
However, there were many regions where both marker
systems intermingled and as such, probably do not at this
stage represent distinct regions. Twenty-four of the RFLP
sequences had significant similarity with GenBank acces-
sions, particularly to genes from rice and Arabidopsis
(Table 5). However, five of these matched with unknown
or hypothetical proteins. The location of some putative
genes (namely, class III peroxidase, embryo specific pro-
tein, profilin, pectinesterase, chitinase, class 3 alcohol
dehyrogenase, histone H2B, metallothionein, ribosomal
protein S26, actin depolymerizing factor and chrosimate
synthase) were determined on the present linkage map.
Fifteen of the 22 SSR loci segregating in the male parent
gametes were successfully mapped. Due to the low
number of SSR markers employed, only ten of the groups
had at least one SSR marker each. Nevertheless, the pres-
ence of SSR markers in these groups together with the
RFLP markers makes it more convenient for genetic map
integration or comparison. Development of additional
SSRs from the existing ESTs collection is in progress, and
it is anticipated that the EST-SSRs will assist with map sat-
uration in the future.
The proportion of markers exhibiting distorted segrega-
tion ratio in this study was about 21% (Table 1). This was
slightly higher than that reported for oil palm previously
(less than 10%) [13] and other species, such as Eucalyptus
(15%) [20] and apricot (17% for AFLP markers) [21].
However, the segregation distortion was much lower than
those observed for roses (27%) [22] and coffee (30%)
[23]. Nevertheless, 79% of the markers (Table 1) segre-
gated in the expected ratios, indicating that a majority of
the markers were inherited in a stable Mendelian manner.
Groups 7, 8 and 13 in particular had a large percentage of
distorted markers.
Quantitative traits
A major objective of this study is to map QTLs associated
with iodine value (IV) and fatty acid composition (FAC)
in oil palm. Generally, all of the traits showed a pattern of
continuous distribution around the mean, although some
traits did not follow a perfect normal distribution (data
not shown). The frequency distribution of IV, C16:0,
C18:0, C18:1, C18:2 and C18:3 did not differ significantly
from normality. This agrees with the co-dominant theory
of inheritance for the fatty acids as proposed by Ong et al.
[24]. However, the frequency distribution of C14:0 and
C16:1 showed deviation from normality. Deviation of a
trait from a perfect normal distribution has been observed
in QTL analysis experiments [25].
The correlation coefficients between the various traits and
their values were computed and provided in Table 6. As
BMC Plant Biology 2009, 9:114 />Page 6 of 19
(page number not for citation purposes)
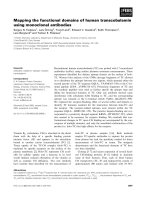
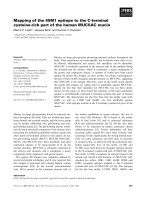
Combined AFLP, SSR and RFLP Map of interspecific hybrid (Palm T128) (Linkage Groups 1–6)Figure 1
Combined AFLP, SSR and RFLP Map of interspecific hybrid (Palm T128) (Linkage Groups 1–6). Single asterisk:
skewed marker at P < 0.1; double asterisk: skewed marker at P < 0.05; three asterisks: skewed marker at P < 0.01; four aster-
isks: skewed marker at P < 0.005; five asterisks: skewed marker at P < 0.001; six asterisks: skewed marker at P < 0.0005.
EAAG/MCTG>330a
0.0
EAAC/MCAT-285
16.3
EACA/MCAT-156
25.8
SFB41
37.7
TACG/HCTA-185
44.4
EACA/MCTC-285
49.6
EACT/MCAA>330b
57.6
EACA/MCAA>330a
64.6
EACC/MCAT-249
68.4
EACA/MCAT-112**
77.7
EAAG/MCAG-150**
78.6
EACA/MCAG-168**
85.6
EAGC/MCAG-165**
90.0
TACG/HCAA-250**
92.3
CIR18II***
95.1
P1AO-310****
96.2
CNH1537-140****
104.5
EACC/MCAG>330a**
113.9
CIR8-212**
114.8
CB75A*
125.4
EAGG/MCAT-198*
137.4
1
KT35
0.0
EACT/MCAC-205
17.8
EACT/MCTT-177
21.2
EAGG/MCAC-175
28.8
EAAG/MCAC-173
34.4
EACT/MCTT-134
42.5
TACG/HCAA-130
45.4
EAGC/MCTC-222
47.8
EAAG/MCAC>330b EACT/MCAT-195
49.1
EACT/MCAT-163 EACT/MCAG-165
55.9
EAAC/MCTT-330
63.8
SFB23
67.6
TAGG/HCAG-134
71.4
EACA/MCTA-325
79.1
EAAG/MCTG>330c
82.2
EAAC/MCAG-290
86.3
EAGG/MCAC-162
100.0
TAGG/HCAG-125
110.5
P4T10
116.4
EACA/MCAG-113
124.5
2
EACG/MCTT-190
0.0
MT170
15.4
EAAC/MCAC-143 SFB95
27.8
TAGC/HCAG-239
29.9
EAP3339
35.5
MET41
41.3
EACT/MCAC-120
47.6
EACG/MCAG-102*
51.5
EACG/MCTA-170** EACT/MCAC-235**
EACG/MCTA-183** EACG/MCAC-235**
59.8
TAGC/HCAG>330***
75.9
3
EAAG/MCTT>330a
0.0
EAAC/MCTT-129
16.8
EACT/MCAA-195
21.6
EACG/MCAG-122
24.8
EACA/MCAT>330b
28.5
EACT/MCAA-208
29.5
KT6
39.8
P4T12a-200
50.4
P1T12b-200
51.3
EAGC/MCAG-330
62.3
4
TACC/HCAG-113
0.0
G37
16.7
SFB31
34.8
EAAC/MCAG-110
39.3
EACA/MCAG-125
49.9
TACG/HCTA-330
54.9
CNH0887
61.7
EACG/MCAT>330
63.8
EAAG/MCAG-253
68.7
EACC/MCAT-165
78.7
EACC/MCAT-160*
80.7
EAAG/MCTG-180
87.2
KT3 MET16
91.1
TACA/HCAC-272
95.9
EAAG/MCTG>330d
120.7
EACT/MCAA-238*
125.6
EAAC/MCAG-125*
136.0
EACT/MCAA-119** EACA/MCTC>330b*
144.1
EAAG/MCAC-330**
145.1
CB116A*
150.7
EACT/MCTT-210**
155.6
EACC/MCAG-250**
156.5
EAAC/MCTG-142
168.0
5
EACC/MCAT-190
0.0
GT8
9.6
G142
10.6
EACA/MCAT-221
30.8
EAAG/MCTC-146
50.9
EACT/MCAA>330a
70.5
EACA/MCAG-260
76.7
EAGG/MCAG-145 EACA/MCAT-150
78.6
EAAG/MCTA-269
85.4
EACC/MCAG-203
92.2
EAAG/MCTC-168
100.8
P2O1b-190
103.1
EACT/MCAG-295
111.7
G188
123.7
6
BMC Plant Biology 2009, 9:114 />Page 7 of 19
(page number not for citation purposes)
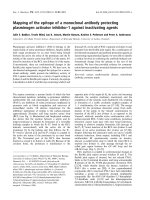
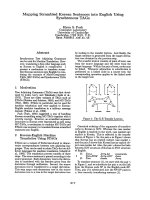
Combined AFLP, SSR and RFLP Map of interspecific hybrid (Palm T128) (Linkage Groups 7–13)Figure 2
Combined AFLP, SSR and RFLP Map of interspecific hybrid (Palm T128) (Linkage Groups 7–13). Single asterisk:
skewed marker at P < 0.1; double asterisk: skewed marker at P < 0.05; three asterisks: skewed marker at P < 0.01; four aster-
isks: skewed marker at P < 0.005; five asterisks: skewed marker at P < 0.001; six asterisks: skewed marker at P < 0.0005.
78 9
SFB130II****
0.0
CIR67****
3.9
SFB54**
5.9
EACA/MCTA>330
12.8
EAGG/MCAA-265
0.0
EACC/MCAG>330b
0.0
EACC/MCAG-320
4.8
EAGC/MCAA-305*
16.5
EACA/MCAA-270****
21.5
EACT/MCTC-188
24.3
10
EAAC/MCAC-133**** KT30****
27.3
EAAG/MCTG-309
28.1
EACT/MCAA-142
42.8
EAAG/MCTG-310
44.8
TACG/HCTA-285**
51.3
EACT/MCTC-230
51.7
EACT/MCAT-150****
59.6
EACT/MCTA-232
53.6
EAAC/MCTT-205****
61.4
EACA/MCAA-200**
0.0
CA184II CA184I
59.4
EACT/MCTC-215****
68.1
EAAG/MCAG-265**
16.2
EAGG/MCTT-231***
70.1
EAAG/MCTG-235
73.9
EACT/MCAT-170****
71.1
EAGG/MCAT>330d******
74.8
TACG/HCAA-125**
20.2
EACT/MCAA-160
79.0
SFB83****
80.7
EAAG/MCAC-198*
30.9
EAAC/MCTT>330
83.9
EAAG/MCAC-204**
32.8
EAAC/MCAT-159****
89.7
EAAG/MCAG-245****
95.1
EACA/MCTC-159**
100.1
G39**
45.9
EACT/MCAT-243******
99.3
EACT/MCAT-115******
100.3
EACC/MCAA>330a**
106.1
EACT/MCTG-300**
47.0
EAAC/MCAT-213**
57.2
EACC/MCAA-325*
61.1
EAAG/MCTA-113**
120.5
TAGG/HCAG-149*
63.1
TAGG/HCAG-152*
64.1
EAAC/MCTG-100
137.0
TAGC/HCAA-320
73.6
EACT/MCAG-168
83.7
EACG/MCTA-155
93.9
SFB37
103.1
TACC/HCAG>330
110.3
TAAC/HCAA-138
134.8
11 12
13
EACA/MCAA-218
0.0
EAAC/MCAT-113
6.5
TACG/HCTA-165
9.8
EACC/MCTG>330b
12.6
CIR377 SFB62I
14.5
SFB147
16.7
TACA/HCAC-262
20.1
EAAG/MCAT-310
21.0
P1AO-240
23.8
TAAG/HCTA-248
26.7
EAAC/MCTT-143
32.5
EACA/MCAT-240
39.5
EAGG/MCAT-164
55.6
EAGG/MCAT-165
59.4
EACT/MCTA-275**
68.5
SFB34**
0.0
EACC/MCAC>330******
0.0
FDA39*
4.2
EAAC/MCAA-235** EAAG/MCAG-127**
EACT/MCAA-189**
19.6
EAAG/MCTA-189**
22.6
EACT/MCTA>330c
27.0
EACT/MCTC-142****
29.3
FDA58
47.4
EACT/MCTC-150****
44.5
P4T20b-175
54.5
EAAG/MCTG-119*****
53.1
EACT/MCAT>330b
59.2
EAAC/MCTT-83***
59.5
TAAG/HCTA-170
62.2
EACT/MCTA>330b
69.9
TACG/HCAA>330b**
74.8
TACT/HCAT-125
71.9
SFB18
79.7
EACA/MCTT-213
95.7
EAAC/MCAA-212**
99.0
BMC Plant Biology 2009, 9:114 />Page 8 of 19
(page number not for citation purposes)
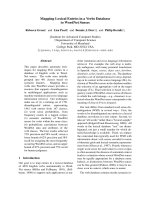
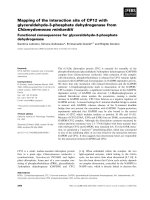
Combined AFLP, SSR and RFLP Map of interspecific hybrid (Palm T128) (Linkage Groups 14–21)Figure 3
Combined AFLP, SSR and RFLP Map of interspecific hybrid (Palm T128) (Linkage Groups 14–21). Single asterisk:
skewed marker at P < 0.1; double asterisk: skewed marker at P < 0.05; three asterisks: skewed marker at P < 0.01; four aster-
isks: skewed marker at P < 0.005; five asterisks: skewed marker at P < 0.001; six asterisks: skewed marker at P < 0.0005.
EACT/MCAT-112
0.0
EAAC/MCTC-85
16.8
EAGC/MCTC>330b
37.7
EAAG/MCAC-310
40.2
EACT/MCTC-130
41.5
TAAC/HCAA-265
46.8
14
RD56
0.0
P4T8I P4T8II
1.9
EAAG/MCAT-221
7.7
EACA/MCAA-330**
19.0
EACA/MCAG-103**
20.8
TACC/HCAG-148
26.1
15
EACC/MCAA>330b***
0.0
EAAG/MCTA-318
5.2
EAAC/MCTT-135****
18.6
EAGG/MCAC-250*****
21.4
TACG/HCAA>330a****
25.3
EAAC/MCAG-195****
39.8
EAAG/MCTG-188
62.5
SFB59
69.7
MET18
73.5
16
SFB130I
0.0
SFB70
5.8
TACA/HCAC-155
9.6
TAAC/HCTC>330
39.0
CIR1772
59.5
EACA/MCAT-160
75.6
EACA/MCAA-195
77.5
EACC/MCAA>330c
79.7
EACC/MCTG-158
83.2
TACA/HCTT-172
104.6
17
EACA/MCTC-235
0.0
P1O14a
17.7
G40
22.5
EAGC/MCAG-240
35.4
EAAC/MCTC-122**
52.3
EACG/MCAG-140
68.4
EACT/MCAA-191*
70.3
EACT/MCTC>330*
72.2
18
EACG/MCAG-106
0.0
SFB39
3.2
SFB21
4.3
EAGG/MCAT>330e
25.4
EAGG/MCTC-160
40.8
EAAG/MCTA-290
60.0
EAAC/MCTT-250
81.2
19
EAGG/MCTC-103
0.0
EAGC/MCAT-229**
24.0
EACT/MCTA-240***
27.0
TACA/HCAC-127**
29.9
TAAC/HCTC-292**
32.7
EACA/MCTC>330a*
39.5
20
SFB78
0.0
EACA/MCAT>330a
6.2
EAAC/MCAA>330a
25.6
21
BMC Plant Biology 2009, 9:114 />Page 9 of 19
(page number not for citation purposes)
expected, the IV content is positively correlated with the
unsaturated fatty acids C18:1 and C18:2. The results also
indicate that the saturated fatty acids C14:0 and C16:0 are
negatively correlated with IV, C18:1 and C18:2. The
results obtained here are as anticipated and similar to
those reported previously [26,27]. However, C18:0
showed no significant correlation to C16:0 and C18:1.
Weak correlation between C16:0 and C18:0 has also been
reported previously for rapeseed [28]. Nevertheless, Perez-
Vich et al. [29] had reported that the C18:0 and C18:1
contents were negatively correlated in sunflower. The lack
of correlation of C18:0 to C18:1 could be due to the low
levels of inherent C18:0 in oil palm including the inter-
specific hybrids.
QTL analysis
At a genomic wide significant threshold of P < 0.01 and P
< 0.05, significant QTLs were detected for IV (Group 1),
C14:0 (Groups 8 and 15), C16:0 (Group 1), C16:1
(Group 15), C18:0 (Group 15), C18:1 (Group 1) and
C18:2 (Group 2) using the interval mapping approach
(Table 7). Significant QTLs were not detected for C18:3.
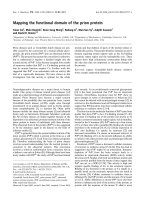
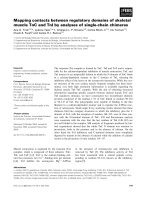
The LOD score profiles obtained are shown in Figure 4.
In the subsequent multiple-QTL model (MQM) analysis,
the significant QTLs for IV, C16:0 and C18:1 were main-
tained on Group 1. However, additional QTLs for C14:0,
and C18:0 were also revealed on Group 1 (Table 8). All
five QTLs showed similar shaped LOD profiles suggesting
that the same QTL is influencing the five traits. The QTLs
mapped on Group 1 for IV, C16:0 and C18:1 explain a sig-
Table 5: List of RFLP loci mapped, GenBank (dbEST database) accession number and gene identity
No. Probe Linkage Group Accession No Putative Gene ID#
1 SFB41 1 GH159190 No Hit
2 CB75A 1 GH159164 class III peroxidase (Oryza sativa)
3 KT35 2 GH159177 hypothetical protein (Oryza sativa)
4 SFB23 2 GH159185 No Hit
5 MT170 3 GH159181 No Hit
6 SFB95 3 GH159197 type 1 KH domain containing protein (Populus tremula)
7 MET41 3 GH159180 putative embryo specific protein (Oryza sativa)
8 KT6 4 GH159175 No Hit
9 G37 5 GH159168 No Hit
10 SFB31 5 GH159186 profilin (Cocos nucifera)
11 KT3 5 GH159174 No Hit
12 MET16 5 GH159178 No Hit
13 CB116A 5 GH159165 No Hit
14 GT8 6 GH159173 No Hit
15 G142 6 GH159171 No Hit (same as GT8)
16 G188 6 GH159172 stress responsive protein (Triticium aestivium)
17* SFB130 7 & 17 GH159198 No Hit
18 SFB54 7 GH159191 pectinesterase family protein (Arabidopsis thaliana)
19 KT30 8 GH159176 chitinase (Brassica rapa)
20 SFB83 8 GH159196 unknown (Populus trichocarpa)
21* CA184 9 GH159163 D6-type cyclin (Populustrichocarpa)
22 G39 10 GH159169 rab-type small GTP-binding protein (Cicer arietinum)
23 SFB37 10 GH159188 class 3 alcohol dehyrogenase (Oryza sativa)
24 SFB62 11 GH159193 eukaryotic translation initiation factor (Arabidopsis thaliana)
25 SFB147 11 GH159199 histone H2B, putative (Arabidopsis thaliana)
26 SFB34 12 GH159187 PVR3-like protein (Ananas comosus)
27 FDA39 12 GH159166 early-responsive to dehydration protein-related (Arabidopsis thaliana)
28 FDA58 12 GH159167 hyphothetical protein Os1_002257 (Oryza sativa)
29 SFB18 12 GH159183 hypothetical protein (Vitis vinifera)
30 RD56 15 GH159182 hypothetical protein (Oryza sativa)
31 SFB59 16 GH159192 pectinesterase inhibitor (Medicago truncatula)
32 MET18 16 GH159179 metallothionein-like protein (Elaeis guineensis)
33 SFB70 17 GH159194 ribosomal protein S26 (Pisum sativum)
34 G40 18 GH159170 actin depolymerizing factor (Elaeis guineensis)
35 SFB39 19 GH159189 No Hit
36 SFB21 19 GH159184 No Hit
37 SFB78 21 GH159195 chrosimate synthase (Oryza sativa)
# Putative Gene Identity was inferred from homology search using BLASTX.
* The RFLP markers concerned detected more than one segregating loci
BMC Plant Biology 2009, 9:114 />Page 10 of 19
(page number not for citation purposes)
nificant proportion of the variation observed for the traits,
that is 46.3% for IV, 44.4% for C16:0 and 33.1% for
C18:1. The variation explained for C14:0 and C18:0 on
Group 1 was 13.1% and 17.2% respectively, indicating
that it was a minor QTL influencing these two traits. The
QTL for unsaturation (C18:1 and IV) had an opposite
effect to the QTL for saturated fatty acids (C16:0 and
C18:0), suggesting that the alleles at this QTL locus affect
the saturated and unsaturated fatty acids differently.
Significant QTLs for C14:0 and C18:0 were located on
Group 15, which explained 20.5% and 23.2% of the vari-
ation respectively. Another major QTL located on Group
15 was that for C16:1, which explained 55.8% of the var-
iation. A minor QTL for C18:1 was also located around
the same region on Group 15 (revealed by MQM analy-
sis), explaining about 12.8% of the variation respectively.
The LOD profiles of the QTLs were also very similar (Fig-
ure 4, Table 8), indicating that the same QTL is influenc-
ing the traits concerned on Group 15. In contrast to what
was observed in Group 1, the minor QTL for C18:1 on
Group 15 was in the same direction with C18:0. Similar
results were also observed by Zhao et al. [28] for rapeseed
and could be an indication of a pleiotropic effect of a sin-
gle QTL.
MQM analysis revealed a third minor QTL on Group 3 for
C18:0. The minor QTL detected for C14:0 on Group 8
through Interval Mapping was found to be not significant
in the MQM analysis, and as such, was not considered as
Table 6: Correlation between fatty acids (n = 81) in F
1
progeny
IV C14:0 C16:0 C16:1 C18:0 C18:1 C18:2
IV
C14:0 -0.679**
C16:0 -0.879** 0.716**
C16:1 -0.169 0.278* 0.186
C18:0 -0.143 -0.107 0.062 -0.734**
C18:1 0.733** -0.646** -0.941** -0.219 -0.33
C18:2 0.517** -0.301** -0.199 -0.044 -0.123 -0.111
C18:3 0.202 0.059 -0.175 0.316** -0.266 0.035 0.281*
Note: Correlation carried out using Pearson Correlation test implemented via the SPSS software package.
** Correlation is significant at the 0.01 level (2-tailed)
* Correlation is significant at the 0.05 level (2-tailed)
Table 7: QTLs for IV and fatty acid composition found to be significant at the empirical genome wide mapping threshold (Interval
Mapping)
Trait Genome wide significant threshold level Group LOD Peak Position
of LOD peak
(cM)
Left – Right Locus
a
% variance explained
P < 0.05 P < 0.01
IV 3.0 3.9 1 8.90 132.4 CB75A -
EAGG/MCAT-198
46.3
C14:0 3.0 3.4 8 3.96 24.5 EACA/MCAA-270 -
EAAC/MCAC-133
23.6
15 3.92 4.8 P4T8 -
EAAG/MCAT- 221
22.3
C16:0 3.1 4.0 1 8.06 132.4 CB75A -
EAGG/MCAT-198
42.9
C16:1 3.1 3.7 15 12.8 7.7 P4T8 -
EAAG/MCAT-221
56.6
C18:0 3.0 3.6 15 4.18 6.9 P4T8 -
EAAG/MCAT-221
22.5
C18:1 3.0 3.8 1 5.69 133.4 CB75A -
EAGG/MCAT-198
32.5
C18:2 2.9 3.5 2 3.54 34.4 EAGG/MCAC-175 -
EAAG/MCAC-173
19.7
a
Loci flanking the likelihood peak of a QTL
BMC Plant Biology 2009, 9:114 />Page 11 of 19
(page number not for citation purposes)
QTL graphs for IV and the various fatty acid compositions on Groups 1, 2 and 15Figure 4
QTL graphs for IV and the various fatty acid compositions on Groups 1, 2 and 15. Results from the Interval Mapping
approach. Horizontal line indicates the 95% significant threshold value for declaring a QTL.
0
0.5
1
1.5
2
2.5
3
3.5
4
010 20 29 38 47 55 64 73 82 91 101 110 120
Map position (cM)
C18:2
LOD score
Group 2
0
1
2
3
4
5
6
7
8
9
10
0 10 19 29 39 48 58 68 77 87 95 104 113 123 132
Group 1
C16:0
IV C18:1
LOD score
Ma
p
p
osition
(
cM
)
0
4
6
8
10
12
14
0 2 3 5 7 9 11 13 15 17 19 20 22 24 26
LOD score
Group 15
Map position (cM)
2
C14:0 C16:1
C18:0
BMC Plant Biology 2009, 9:114 />Page 12 of 19
(page number not for citation purposes)
a locus influencing C14:0 in this study. With respect to
C18:2, only a single QTL was detected on Group 2 (both
in Interval Mapping and MQM analysis), which explained
about 19.7% of the variation observed.
The rank sum test of Kruskal-Wallis was subsequently
used to confirm whether the individual markers linked to
the QTLs were actually significant. The Kruskal-Wallis test
is regarded as the non-parametric equivalent to the one-
way analysis of variance [30], and the results are summa-
rized in Table 8. For all traits, the markers flanking the
QTL were also significant (P < 0.05) for the presence of a
segregating QTL in the Kruskal-Wallis test. The Kruskal-
Wallis test provides further confirmation of the marker-
trait association, and indicates that the results of the QTL
analysis were not influenced by segregation distortion or
non-normal distribution of certain traits (14:0 and
C16:1).
Segregation of markers associated with QTLs
This study also correlated the actual segregation of RFLP
and SSR markers (closest to the QTL peak) and the traits
of interest in the mapping population. The RFLP and SSR
markers were chosen, as they are practical for application
in plant breeding and had significant LOD scores for the
traits concerned. Since the pseudo-testcross strategy was
used in map construction, palms in the mapping popula-
tion were separated as either having the band present
("ab") or absent ("aa") for a particular marker associated
with the QTL. The trait values were averaged and com-
pared between palms with the "aa" and "ab" genotypes.
The results obtained are summarized in Table 9. As is
shown for the RFLP marker CB75A, there was a significant
difference for IV between palms having the "aa" and "ab"
genotypes. The absence of the CB75A band (aa) resulted
in high levels of IV, in other words, high levels of unsatu-
ration of the oil. Similar results were observed for C18:1.
The RFLP probe CB75A was also associated with the QTL
for C16:0 (palmitic acid). In a similar analysis, there were
Table 8: QTLs for IV and fatty acid composition found to be significant using MQM mapping and Kruskal-Wallis analysis
Trait Co-Factor Group LOD
Peak
Position
of LOD peak
(cM)
Left – Right Locus
a
% variance
explained
Kruskal-Wallis
test (P)
IV EAGG/MCAT-198 1 9.55 132.4 CB75A
(-)
-
EAGG/MCAT-198
(-)
46.3 0.0001
0.0001
C14:0 EAAC/MCAC-133 15 5.30 4.8 P4T8
(-)
-
EAAG/MCAT-221
(-)
20.5 0.0001
0.0001
& EAAG/MCAT-221 1 4.63 137.4 CB75A
(+)
-
EAGG/MCAT-198
(+)
13.1 0.010
0.005
C16:0 EAGG/MCAT-198 1 8.92 132.4 CB75A
(+)
-
EAGG/MCAT-198
(+)
44.4 0.0001
0.0001
C16:1 EAAG/MCAT-221 15 13.26 7.7 P4T8
(-)
-
EAAG/MCAT-221
(-)
55.8 0.0001
0.0001
C18:0 EAAG/MCAT-221 15 5.10 6.9 P4T8
(+)
-
EAAG/MCAT-221
(+)
23.2 0.0001
0.0005
1 3.79 132.4 CB75A
(+)
-
EAGG/MCAT-198
(+)
17.2 0.0050
0.0005
3 3.24 75.9 TAGC/HCAG > 330
(+)
- 16.3 0.005
-
C18:1 EAGG/MCAT-198 1 6.59 133.4 CB75A
(-)
-
EAGG/MCAT-198
(-)
33.1 0.0001
0.0001
15 3.04 7.7 P4T8
(+)
-
EAAG/MCAT-221
(+)
12.8 0.010
0.010
C18:2 EAAG/MCAC-173 2 3.54 34.4 EAGG/MCAC175
(+)
-
EAAG/MCAC-173
(+)
19.7 0.0010
0.0005
(+)
The mean value of the quantitative trait for palms having the locus was higher compared to palms not having the locus
(-)
The mean value of the quantitative trait for palms having the locus was lower compared to palms not having the locus
The above analysis was possible as markers linked to the QTLs were in the pseudo-testcross configuration (type b profile, Table 2)
a
Loci flanking the likelihood peak of a QTL
P: Significance level
BMC Plant Biology 2009, 9:114 />Page 13 of 19
(page number not for citation purposes)
significant differences in the C16:0 content between
palms having the "ab" and "aa" genotypes. In this case,
the presence of the CB75A band is correlated with a higher
level of the saturated fatty acid C16:0. The results are inter-
esting as the presence of the CB75A band points to a
higher level of saturated fatty acid (C16:0), lower levels of
unsaturation (lower IV reading) and vice versa, in this par-
ticular mapping population. The sequence of the RFLP
probe CB75A was however not associated with any of the
genes in the fatty acid pathway.
In a similar way, the traits C16:1 and C18:0 were nega-
tively correlated and the QTLs overlapped in the same
position on Group 15. The presence of the SSR allele,
P4T8 (band size 245 bp), which is located about 6 cM
from the estimated position of the QTL, resulted in high
levels of C18:0 but reduced levels of C16:1.
Discussion
The FACs of palm oil and palm kernel oil render these oils
applicable to both edible and non-edible uses. However,
to venture into new markets, at least in the Malaysian
palm oil industry, the focus is to change the oil towards a
higher unsaturated FAC content particularly oleic acid
(C18:1), at the expense of saturated fatty acids such as pal-
mitic acid (C16:0) [31]. An oil with such properties has
the potential to open up wider markets for palm oil in the
salad oil sector, especially in the cooler climatic regions of
the world where currently rapeseed, sunflower and soya-
bean are preferred [1]. In addition, it is envisaged that
such an oil could be industrially useful for producing
chemical derivatives, which could serve as alternatives to
petrochemical feedstock [31] as well as be a potentially
cheaper feedstock for production of biofuels by virtue of
having a lower cloud point. The ultimate objective is to try
to produce breeding lines that can produce oil with IV
content of above 72, palmitic acid content of below 25%
and oleic acid content of 60%, without sacrificing the
palm oil yield per unit area. This will ensure that maxi-
mum benefit could be achieved from diversifying away
from the present commercial planting material that has a
higher saturated fatty acid profile and into a more liquid
oil without sacrificing the inherent high oil yield potential
of the crop [1,26].
Two approaches are being taken to achieve this objective:
i) genetic engineering of oil palm [31,32] and ii) using the
more conventional breeding approach of interspecific
hybrid breeding. The work carried out in this study was
also intended to develop probes to help expedite the latter
approach, which is not complicated by issues of bio-safety
and bioethics. The mapping population chosen for this
purpose met two important criteria; segregating for the
trait of interest and is relevant in the long term breeding
scheme or strategy to improve the oil quality trait.
Although the female parent (E. oleifera) was mostly
homozygous for the loci analyzed, the male parent, E.
guineensis fortunately was highly heterozygous, hence
contributing to a significant level of genetic variability
that was exploited for QTL analysis. In fact, it has been
reported that the range of fatty acid composition observed
in Nigerian based materials such as the male parent palm
T128 used in this study, extends beyond that of the breed-
ing materials currently in use [33]. This suggests that the
Nigerian based E. guineensis materials are more suited for
breeding oil palms with improved fatty acid composition
[33]. The variation captured in the male parent palm T128
can also prove useful for selection within E. guineensis,
which can directly affect desirable changes in fatty acid
composition in hybrids created subsequently. Neverthe-
less, it is also acknowledged that to fully exploit the value
of oil palm interspecific hybrids and to capture the varia-
tion between the two parents, backcross populations have
to be analyzed in the future.
The genetic map constructed had an excess of linkage
groups in relation to the haploid chromosome number
despite the relatively high number of markers used. Fail-
ure to obtain the basic chromosome number despite
applying high numbers of markers has also been reported
for other species [34,35]. The reason for this could per-
haps be due to the relatively small sample size of the F
1
progeny used in this study. Another possible explanation
is the lack of polymorphic markers in particular chromo-
somal regions, which could be due to the marker systems
being employed and/or presence of large homozygous
regions in the genome of the female E. oleifera parental
Table 9: QTL effects expressed as differences between marker
genotype classes for specific traits
Trait Marker Genotype Mean ± SE
IV CB75A aa 73.26 ± 0.45
a
ab 69.59 ± 0.36
b
C16:0 CB75A aa 27.01 ± 0.40
a
ab 30.79 ± 0.39
b
C16:1 P4T8 aa 0.52 ± 0.02
a
ab 0.34 ± 0.01
b
C18:0 P4T8 aa 1.91 ± 0.04
a
ab 2.19 ± 0.05
b
C18:1 CB75A aa 55.15 ± 0.92
a
ab 52.50 ± 0.41
b
Means of the genotypes "aa" and "ab" were compared using the
independent t test via the SPSS statistical package. The means of the
different genotypes for the markers associated with each trait were
found to be significantly different
aa: band absent
ab: band present
BMC Plant Biology 2009, 9:114 />Page 14 of 19
(page number not for citation purposes)
palm used to create the interspecific hybrid population
used in this study. Furthermore, it has to be stressed that
very strict criteria were used to carry out map construction
in this study. Only markers that fit extremely well in a
linkage group were retained. Markers that caused even a
slight friction were discarded in order not to compromise
the subsequent QTL analysis. This also explains why only
252 markers (56%) were successfully ordered in the
genetic map. The genetic map reported in this study
depicts the mapping of expressed genes. The sequences of
the RFLP markers mapped in this study have been submit-
ted to GenBank. Since the RFLP markers were well distrib-
uted across the linkage groups, they can be used as
potential anchor markers for integration or comparison of
maps of different populations. As the oil palm EST data-
base is growing rapidly [36,37], additional probes either
as RFLP markers or EST-SSR markers will be placed on the
genetic map concerned. More importantly, the growing
oil palm EST database will allow the selective mapping of
genes associated with the fatty acid composition pathway.
The use of allele specific markers linked to genes underly-
ing the synthesis of seed oils has been demonstrated in
Brassica [38].
In this study, 11 QTLs were detected for IV and the six
components of the fatty acid composition (C14:0. C16:0,
C16:1, C18:0, C18:1 and C18:2) in four different linkage
groups. For C18:1, two QTLs were detected, one major
QTL in Group 1 and a minor QTL in Group 15, which col-
lectively explained 45.9% of the total phenotypic varia-
tion. Two QTLs were detected for C14:0 and three for
C18:0, explaining 33.6% and 56.7% of the total pheno-
typic variation observed respectively. One QTL each was
detected for IV, C16:0 and C18:2. For the first time, this
study has revealed QTLs associated with FAC in oil palm.
The traits were largely controlled by a limited number of
genomic regions with large effects. QTLs for five traits (IV,
C14:0, C16:0, C18:0 and C18:1) were located in Group 1.
All traits showed similar shaped LOD profiles suggesting
that the same QTL is influencing all five traits. The fact
that four of the traits are significantly correlated further
supports this assumption. Furthermore, looking at the
pathway for fatty acid biosynthesis where C16:0 is in fact
elongated to C18:0 by the enzyme β-ketoacyl ACP syn-
thase II (KASII), and C18:0 is subsequently desaturated by
Δ9-stearoyl ACP desaturase to form C18:1, supports the
fact that the same locus could be influencing these traits.
Also considering that IV is a measure of unsaturation of
oils and fats, C18:1 is the most abundant unsaturated fatty
acid while C16:0 is the most abundant saturated fatty acid
in palm oil, it is only logical to assume that the same
genomic region is influencing these traits in oil palm.
QTLs for C14:0, C16:1, C18:0 and C18:1 were located on
Group 15. The stearoyl ACP desaturase enzyme, although
highly specific to the conversion of C18:0 to C18:1, is also
known to sometimes act on C16:0 as a poor substrate and
convert it to C16:1 [27]. This probably explains the strong
negative correlation (r = -0.734) between C18:0 (stearic
acid) and C16:1 (palmitoleic acid) and why the same QTL
may be influencing the traits. As expected, the effect of the
QTL for C16:1 and C18:0 is also in the opposite direction.
The likelihood profile for the QTLs affecting the two traits
in Group 15 (Figure 4) is also very similar, adding further
strength to the argument that the same locus is influenc-
ing both traits.
Previously, a single preliminary QTL was reported for IV
in oil palm in a similar population consisting of only 77
palms [39]. The LOD peak of 3.1 reported is not signifi-
cant at the threshold level employed in the present study.
Since no other similar work especially for FAC has been
reported for oil palm, it was not possible to carry out a
direct comparison with findings from other research
groups. However, a comparison with other crops (mainly
annual crops) is possible. For example, in maize, Alrefai et
al. [40] detected 15 QTLs (in eight groups) associated with
C16:0 only. Similarly, Mangolin et al. [41] detected 13
QTLs distributed in eight chromosomes for kernel oil con-
tent in maize. The low number of QTLs detected in this
study, were however in agreement with the work by Som-
ers et al. [42] and Jourdren et al. [43], who found that a few
QTL loci could explain a large proportion of the pheno-
typic variation associated with one of the fatty acid com-
ponents, C18:3 (linoleic acid) in Brassica napus.
Furthermore, the same genomic region influencing two or
more fatty acid components have also been reported for
sunflower [44] and Brassica napus [45]. However, the
experience in soybean was different where Panthee et al.
[46] reported lack of common markers associated with
C16:0, C18:0 and C18:1, although the same genomic
region appears to be influencing the three 18-carbon
unsaturated fatty acids (C18:1, C18:2 and C18:3). Never-
theless, it is important to note that the differences in QTLs
mapped in this research cannot be directly compared to
those reported above because of the different crop, type of
markers, mapping population structure and the density of
the genetic maps used in the analysis. The population size
employed is another major factor that may explain differ-
ences in studies on QTL analysis, as the population size
can affect the power to detect QTLs. The population size
for QTL analysis in this study was 81 palms, smaller than
that reported for some annual crops [40,46], which also
makes direct comparison with other studies more diffi-
cult.
It is also noted that QTLs could not be detected for C18:3.
The small population size employed limited power to
detect QTLs of smaller effect. Analysis of further popula-
BMC Plant Biology 2009, 9:114 />Page 15 of 19
(page number not for citation purposes)
tions, particularly backcrosses derived from the same
cross, may yield QTLs for this trait.
The QTLs identified in this study will provide breeders
with a valuable tool to manipulate the FAC content in oil
palm. For example, absence of the RFLP probe CB75A
could be indicative of palms having oil with higher
unsaturation level. The absence of the RFLP marker
resulted in an increase of about 2.6% above the family
mean for IV (level of unsaturation), and a decrease of
about 6.5% below the family mean for C16:0 content
(saturated fatty acid). If the marker/QTL linkage holds
across different pedigrees, this RFLP marker could be used
to enrich for genotypes with higher levels of unsaturation.
The association reported here was found only in a partic-
ular mapping population and as such may not yet be
applicable for molecular breeding. Many researchers have
pointed out that associations established in one cross may
not hold true in other crosses [47,48]. However, Gratta-
paglia et al. [12] were of the opinion that substantial link-
age disequilibrium can be maintained for marker/traits
associations established in a single cross. The linkages
established however can only be defined as "confirmed
linkages" once they have been confirmed in a further sam-
ple, preferably by an independent group of investigators
[49]. Nevertheless, it is heartening to note that QTLs for
fatty acid composition have generally been validated
across populations, even those associated with minor
QTLs [29].
Although the efforts in Malaysia are largely directed
towards decreasing levels of saturation, increasing levels
of certain saturated fatty acids can also have some eco-
nomic benefits. In this respect, there is interest in increas-
ing the stearic acid content (C18:0), which can give rise to
new applications such as cocoa butter substitution and
personal care products (lotions, shaving creams and rub-
bing oils) [32]. This is also partly motivated by the sub-
stantial price differential between cocoa butter and
commodity oils [50]. Like most plant oils, the oil palm
has low stearate content of less than 5% [27]. The SSR
marker P4T8 could play an important role in MAS for
high stearate palms. The presence of the SSR alleles
resulted in an increase of 6.8% above the family mean for
C18:0 content.
An important point to note is that the saturated fatty
acids, e.g. C16:0 and C18:0 are negatively correlated with
total unsaturation (C18:1, C18:2 and C18:3) (data not
shown). Furthermore, the QTLs for saturated and unsatu-
rated fatty acids are largely in the opposite direction. As
such, it is unlikely that a particular palm for high unsatu-
ration and C18:0 can be bred. It may be more practical to
select separately palms for high saturated and unsaturated
oils.
Rajanaidu et al. [26] reported that repeatability of meas-
urements for FAC is high indicating that a single measure-
ment is sufficient to describe the fatty acid content of a
bunch. Rajanaidu et al. [26] also predicted high heritabil-
ity for most of the fatty acid traits in oil palm. Arasu et al.
[33] reported that genotype × environment (G × E) inter-
action was not detected for any of the fatty acid traits in
the 40 E. guineensis Nigerian germplasm populations ana-
lyzed. As such, good repeatability, high heritability and
minimum G × E interaction suggest that FAC content is
actually amenable to improvement with simple selection
procedures. FAC can be improved rapidly using the strat-
egy pointed out by Hospital et al. [51]. After having estab-
lished the linkages, the genetic gain can be accelerated by
scoring for markers associated with the QTLs for two gen-
erations without phenotypic observation. If the marker/
QTL linkage holds true, Rance et al. [15] predicted that
such a strategy could reduce the generation time by almost
half for oil palm as the crosses can be made right after
flowering (about 3 years), without having to wait for the
fruits to be formed and analyzed (which can take up to 5
years).
Conclusion
In this study, the QTLs were only detected for the male E.
guineensis parent, T128. As such, we cannot conclude if the
marker/QTL linkages will hold true for E. oleifera. Never-
theless, we believe that the linkages established between
the marker and QTLs could be followed in backcross pop-
ulations, which usually involve backcrossing the F
1
hybrid
to the E. guineensis parent. The QTLs identified in this
study would also be potentially useful in exploiting the
huge E. guineensis germplasm that Malaysia (through
MPOB) has accumulated. QTLs with favorable alleles can
be identified in the germplasm collection for incorpora-
tion into the existing breeding programmes. The high
phenotypic variation explained by most of the QTL
improves confidence in their application for MAS. Never-
theless, certain drawbacks should also be pointed out.
There is always a possibility of linkage drag occurring,
especially when involving germplasm collections and in
oil palm interspecific hybrids, where unfavorable alleles
such as that responsible for low yield are also incorpo-
rated together with the favorable alleles for higher unsatu-
ration. However, as pointed out by Rance et al. [15], this
can be minimized by selecting for QTLs with small confi-
dence interval that defines a very narrow region.
Methods
Plant materials
An interspecific mapping population derived from the
cross between E. oleifera palm UP1026 from Monteria,
BMC Plant Biology 2009, 9:114 />Page 16 of 19
(page number not for citation purposes)
Colombia (female parent) and E. guineensis tenera palm
T128 (male parent) from Nigeria was utilized in this
study. Controlled self-pollination was adopted to gener-
ate the hybrids used in this mapping population. A total
of 118 palms from this interspecific cross were planted
and evaluated at one location at United Plantations, Teluk
Intan, Perak, Malaysia.
Preparation of genomic DNA
Leaf samples (young unopened or spear leaves) from all
palms were collected and immediately frozen under liq-
uid nitrogen and then stored at -80°C until DNA prepara-
tion could be carried out. DNA was prepared based on the
method of Doyle and Doyle [52].
Amplified fragment length polymorphism (AFLP)
procedure
AFLP analysis was carried out by using the EcoRI/MseI and
TaqI/HindIII enzyme pairs. The EcoRI/MseI assay was car-
ried out by using the GIBCO BRL AFLP Analysis System 1
(Invitrogen, USA), essentially as described in the manu-
facturer's manual. The AFLP analysis using the TaqI/Hin-
dIII enzyme pairs was essentially performed as described
by Rafalski et al. [53]. A subset comprising five samples
(including the parents) was included in each electro-
phoresis run to ensure reproducibility.
Restriction fragment length polymorphism (RFLP) analysis
i RFLP probes
The RFLP probes used to screen the interspecific hybrid
mapping population were cDNA clones obtained from
the various cDNA libraries (young etiolated seedlings,
mesocarp, kernel and root) constructed previously as
described by Cheah [54]. In addition, cDNA clones from
a subtracted flower library [55] were also used to screen
the mapping population. Plasmid DNA was prepared
from individual clones and purified using column based
kits (Qiagen, USA). The presence of the DNA insert was
examined by restriction digestion (EcoRI) and electro-
phoresing on a 1.5% agarose gel. cDNA clones with insert
sizes larger than 500 base-pairs (bp) were selected to
screen for their ability to detect RFLP in the mapping pop-
ulation.
The DNA probes were diluted to a concentration of 5 ng/
μl in TE buffer. The DNA probe (50 ng) was then labeled
with α
32
P-dCTP (NEN
®
Radiochemicals, Perkin Elmer,
3000 Ci/mmol stock) by using the Megaprime™ DNA
Labeling system (GE Healthcare Life Sciences), as recom-
mended by the manufacturer. The labeled probe was sep-
arated from the unincorporated nucleotides by
purification through a Sephadex column as described in
Sambrook et al. [56].
ii Southern blotting and hybridization
For the screening procedure, DNA samples (20 μg) from
10 palms (including the parental palms) were digested
with 14 restriction enzymes (BamHI, BclI, BglII, DraI,
EcoRI, HincII, HindIII, ScaI, SstI, XbaI, BstNI, HaeIII, RsaI
and TaqI). The restricted DNA fragments were separated
by electrophoresis in 0.9% agarose gel in 1× TAE (0.04 M
Tris-acetate, pH 7.9, 1 mM EDTA pH 8.0) buffer and then
transferred onto nylon membranes (Hybond N
+
, GE
Healthcare Life Sciences) by vacuum blotting.
The 140 samples were then hybridized in turn with each
candidate probe to identify the probe/restriction enzyme
combination that gave a segregation profile. In the case of
more than one enzyme showing polymorphism with a
particular probe, the probe/enzyme combination that
gave a clear single/low copy profile was selected for
screening the entire mapping population. Replicate DNA
preparations of the ten samples selected for screening
(representing 8.7% of all the samples) were also screened
concurrently with the entire mapping population. This
was to facilitate reproducibility of RFLP profiles for differ-
ent batches of DNA extraction. A subset comprising five
samples (including the parental palms) was included as
positive controls in every electrophoresis run to ensure
reproducibility of the RFLP analysis.
Pre-hybridization and hybridization were carried out in
glass tubes in a rotisserie oven at 65°C, essentially as
described by Rahimah et al. [57].
DNA sequencing and analysis
Plasmid DNA containing the cDNA clones was prepared
as described above. cDNA inserts were sequenced from
the 5' end with SK primer using the ABI PRISM™ Ready
Reaction BigDye™ Terminator Cycle Sequencing Kit
(Applied Biosystems, USA). Sequencing was performed
on an ABI377 automated DNA sequencer (Applied Bio-
systems, USA). Raw ABI formatted chromatograms were
base called using PHRED [58]. Customized Perl scripts
were used to trim vector, adaptor, poly A-ends and low
quality sequences. The edited sequences were searched
against GenBank's non-redundant protein database using
BLASTX [59]. Sequence similarities identified by BLASTX
were considered statistically significant at a Poisson P
value of ≤ 10
-10
.
Microsatellites
i Isolation of microsatellites in oil palm
Degenerate primers described by Fisher et al. [60] and Bra-
chet et al. [61] were used to isolate clones containing mic-
rosatellite sequences from oil palm. PCR was performed
separately for the two parental DNA samples, T128 (Nige-
rian E. guineensis) and UP1026 (Colombian E. oleifera),
using the protocol described by Fisher et al. [60]. The post
BMC Plant Biology 2009, 9:114 />Page 17 of 19
(page number not for citation purposes)
PCR mix was cloned using the TOPO-TA cloning kit (Inv-
itrogen, USA), essentially as recommended by the manu-
facturer. Sequencing was carried out on both strands using
M13 forward and reverse primers (Invitrogen, USA) using
an ABI377 sequencer (Applied Biosystems, USA). Specific
primers in the flanking regions of the microsatellites were
designed using the PRIMER3 software [62].
One primer for each primer pair was 5' end labeled at
37°C for 30 min using T4 polynucleotide kinase (Invitro-
gen, USA). The labeling reactions contained 50 pmoles of
primer, 3 μl of γ-
33
P dATP (NEN
®
Radiochemicals, Perkin
Elmer, 3000 Ci/mmol), 1 U of T4 polynucleotide kinase
in a total volume of 25 μl. Subsequently, the PCR reaction
was carried out essentially as described by Billotte et al.
[18]. After the PCR was completed, the reactions were
stopped by the addition of 25 μl formamide buffer (0.3%
bromophenol blue, 0.3% xylene cyanol, 10 mM EDTA pH
8.0, 97.5% deionized formamide). Each PCR reaction was
subjected to electrophoresis on a 6% denaturing acryla-
mide gel containing 7 M urea using 0.5× TBE buffer at
constant power of 40 W for 3 hours. The gels were then
dried and exposed to X-ray film (Kodak) for 3 – 4 days at
-80°C. Sizing of each allele was done using AFLP molecu-
lar weight ladder (Invitrogen, USA). To ensure reproduci-
bility in the PCR reactions and electrophoresis runs, a
subset of five samples (including the parents) was
included in each batch of amplification reactions and sub-
sequently included in each electrophoresis run.
ii Application of published oil palm microsatellite sequences
The 20 published single-locus microsatellite primer pairs
[18] and the five EST-SSRs described by Chua et al. [63]
were also tested on the mapping population. All the
primer pairs were synthesized based on the published
sequences and tested on a small number of individuals
from the mapping population as described above. The
informative primer pairs were then used to screen the
entire mapping population.
In RFLP and SSR analysis, multiple loci detected by a sin-
gle probe or primer pair were coded with the probe/
primer name plus the suffix "I" or "II".
Data analysis
The molecular results were analyzed according to the two-
way pseudo-testcross approach described by Grattapaglia
and Sederoff [34]. Data from RFLP, AFLP and SSR were
scored and coded according to Lespinasse et al. [64] and
Billotte et al. [13] (Table 2). Segregation ratios of markers
were evaluated using the chi-square test for goodness-of-
fit to the expected ratio (P < 0.05).
Map construction
Map construction was carried out using JoinMap version
4.0 [65]. The interspecific cross was analyzed as a popula-
tion resulting from a cross between two heterozygous dip-
loid parents. The data of the female parent and the male
parent were analyzed separately using the population type
code "Cross Pollinator (CP)". Markers showing very sig-
nificant distortion (P < 0.0001) were removed from the
analysis. Subsequently, markers with 12 or more missing
data points (approximately 10% or more missing geno-
types) were also removed from the analysis, as the maxi-
mum likelihood mapping algorithm initially employed
for map construction may be sensitive to having many
unknown genotypes in the dataset [65].
The grouping of markers into linkage groups was evalu-
ated using both independence LOD and recombination
frequency. The maximum likelihood mapping (MLM)
algorithm (using default parameters) was used to order
the markers in the respective groups. Map order was
improved by maintaining markers exhibiting a nearest
neighbor stress value less than 2 cM. Plausible positions
were determined to check the stability of map positions.
In order to improve the map order, the total number of
recombinations for each palm across linkage groups was
also evaluated. The map order was further confirmed
using Regression mapping (default parameters, recombi-
nation frequency < 0.4, LOD > 1 and jump = 5). Map dis-
tances were calculated by using the Haldane map
function. In this study, the map order produced using
MLM is presented.
Quantitative data analysis
Quantitative traits associated with oil quality were of
interest in this study. The criteria used to determine a ripe
bunch was based on the standard practice in the industry
of a minimum of 10 abscised fruitlets per bunch after har-
vest (irrespective of palm height) [1]. The harvested
bunches were carefully tagged individually and bagged
separately before being sent to the laboratory. Care was
taken to prevent damaging the fruits when chopping the
bunch and the oil was extracted, dried and filtered using
the procedure described by Sharma [1]. The oil samples
were then stored in UV-proof glass vials and sealed with
Whatman film before being stored at -20°C. The samples
were then sent to MPOB's analytical laboratory for the
analysis of iodine value (IV), as well as the various fatty
acid components i.e. myristic acid (C14:0), palmitic acid
(C16: 0), palmitoleic acid (C16:1), stearic acid (C18:0),
oleic acid (C18:1), linoleic acid (C18:2) and linolenic
acid (C18:3). The analysis of IV and the individual fatty
acid components was carried out essentially as described
by Lin et al. [66].
BMC Plant Biology 2009, 9:114 />Page 18 of 19
(page number not for citation purposes)
Sampling was attempted on all 118 palms in the mapping
population. However, owing to the variable degree of
female sterility arising out of the interspecific nature of the
cross, it was only possible to get sufficient fruit samples
from 81 palms despite attempting to collect the samples
over a two-year period. All these 81 palms were included
in the final map construction and not omitted for any rea-
son. QTL mapping analysis was initially performed using
interval mapping as implemented in MapQTL version 5.0
[30]. Estimates of QTL position were obtained at the point
where the LOD score assumes its maximum. The markers
closest to the QTL position were then used as cofactors in
MQM (or also known as Composite Interval Mapping)
analysis, also implemented using the same software. The
genome wide empirical thresholds for QTL detection (P <
0.05) were estimated using the permutation test as imple-
mented in MapQTL version 5.0 [30]. In the permutation
test, the presence of QTL is estimated from 1000 permuta-
tions carried out for each trait. The non-parametric
Kruskal-Wallis test was also performed as a procedure of
the MapQTL programme version 5.0 [30], in order to
detect association between the markers and traits individ-
ually.
Authors' contributions
RS and RAR performed the RFLP, AFLP and SSR analysis
of the mapping population. MS carried out the breeding
of the interspecific hybrid cross and collection of data for
QTL analysis. RS and JJ constructed the genetic map and
carried out the QTL analysis. LCLO sequenced, prepared
and maintained the RFLP cDNA clones. ETLL edited and
formatted the SSR and RFLP cDNA sequences for GenBank
submission. RS drafted the manuscript. SCC, SGT, JMP,
MS and RS participated in the design of the study. SCC,
SGT and JMP supervised and coordinated the study. JJ,
MS, SCC, LCLO and SGT critically revised the manuscript.
All authors read and approved the final manuscript.
Acknowledgements
The authors would like to thank the Director-General of MPOB for per-
mission to publish this paper. The authors are also greatly indebted to
United Plantations for providing plant material for the studies described
here. The project was funded by the Malaysian Palm Oil Board.
References
1. Sharma M: Breeding and selection for improved yield and oil
quality in oil palm. In PhD Thesis National University of Malaysia,
Faculty of Science and Technology; 2005.
2. Corley RHV, Tinker PB: Care and maintenance of oil palms. In
The Oil Palm 4th edition. Edited by: Corley RHV, Tinker PB. Wiley-
Blackwell, Oxford, United Kingdom; 2003:287-326.
3. Meunier J, Boulin D: Elaeis melanococca and E. melanococca × E.
guineensis hybrids. First results. Oleagineux 1975, 30:5-8.
4. Rajanaidu N, Kushairi A, Rafii M, Mohd Din A, Maizura I, Jalani BS: Oil
palm breeding and genetic resources. In Advances in Oil Palm
Research Volume 1. Edited by: Basiron Y, Jalani BS, Chan KW. Malay-
sian Palm Oil Board, Bandar Baru Bangi, Malaysia; 2000:171-237.
5. Hartley CWS: The botany of oil palm. In The oil palm 3rd edition.
Longman, London; 1988:47-94.
6. Meunier J, Hardon JJ: Interspecific hybrids between Elaeis
guineensis and Elaeis oleifera. In Oil Palm Research Edited by: Cor-
ley RHV, Hardon JJ, Wood BJ. Elsevier, Amsterdam; 1976:127-138.
7. Suheimi S, Lubis AU: Beberapa hasil pengujian hibrida Elaeis
melanococca di Pusat Penelitian Marihat. Bulletin Pusat Penelitian
Marihat 1985, 5:37-44.
8. Chin CW, Suhaimi S, Nasaruddin MM, Ng WJ: Selection of elite
ortets from interspecific hybrids and backcrosses. In Proceed-
ings of the MPOB Palm Oil International Conference, PIPOC Palm Oil: the
power house for the Global Oils and Fats Economy Malaysian Palm Oil
Board; 2003:36-50.
9. Oboh BO, Fakorede MAB: Optimum time for yield evaluation
and selection in the oil palm (Elaeis guineensis Jacq.). Oleag-
ineux 1989, 44:509-513.
10. Mayes S, Jack PL, Marshall DF, Corley RHV: Construction of a
RFLP genetic linkage map for oil palm (Elaeis guineensis
Jacq.). Genome 1997, 40:116-122.
11. Moretzsohn MC, Nunes CDM, Ferreira ME, Grattapaglia D:
RAPD
linkage mapping of the shell thickness locus in oil palm
(Elaeis guineensis Jacq.). Theor Appl Genet 2000, 100:63-70.
12. Grattapaglia D, Bertolucci FL, Sederoff R: Genetic mapping of
QTLs controlling vegetative propagation in Eucalyptus gran-
dis and Eucalyptus urophylla using a pseudo-testcross strat-
egy and RAPD markers. Theor Appl Genet 1995, 90:933-947.
13. Billotte N, Marseillac N, Risterucci AM, Adon B, Brotteir P, Baurens
FC, Singh R, Herran A, Asmady H, Billot C, Amblard P, Durrand-Gas-
selin T, Courtois B, Asmono D, Cheah SC, Rohde W, Charrier A:
Microsatellite-based high density linkage map in oil palm
(Elaeis guineensis Jacq.). Theor Appl Genet 2005, 110:754-765.
14. Maria M, Clyde MM, Cheah SC: Cytological analysis of Elaeis
guineensis (tenera) chromosomes. Elaeis 1995, 7:122-134.
15. Rance KA, Mayes S, Price Z, Jack PL, Corley RH: Quantitative trait
loci for yield components in oil palm (Elaeis guineensis Jacq.).
Theor Appl Genet 2001, 103:1302-1310.
16. Matthews BF, Devine TE, Weisemann JM, Beard HS, Lewers KS, Mac-
Donald MH, Park YB, Maiti R, Lin JJ, Kuo J, Pedroni MJ, Cregan PB,
Saunders JA: Incorporation of sequenced cDNA and genomic
markers into the soybean map. Crop Sci 2001, 41:516-521.
17. Pfaff T, Kahl G: Mapping of gene-specific markers on the
genetic map of chickpea (Cicer arietinum L.). Mol Gen Genomics
2003, 269:243-251.
18. Billotte N, Risterucci AM, Barcelos E, Noyer JL, Amblard P, Baurens
FC: Development, characterization and across-taxa utility of
oil palm (Elaeis guineensis Jacq.) microsatellite markers.
Genome 2001, 44:413-425.
19. Maliepaard C, Alston FH, van Arkel G, Brown LM, Chevreau E, Dune-
mann F, Evans KM, Gardiner S, Guilford P, van Heusden AW, Janse J,
Laurens F, Lynn JR, Manganaris AG, den Nijs APM, Periam N,
Rikkerink E, Roche P, Ryder C, Sansavini S, Schmidt H, Tartarini S,
Verhaegh JJ, Vrielink-van Ginkel M, King CJ: Aligning male and
female linkage maps of apple (Malus pumilla Mill.) using
multi-allelic markers. Theor Appl Genet 1998, 97:60-73.
20. Marques CM, Araujo JA, Ferreira JA, Whetten R, O' Malley DM, Liu
BH, Sederoff R: AFLP genetic maps of Eucalyptus globules and
E. tereticornis. Theor Appl Genet 1998, 96:727-737.
21. Vilanova S, Romero C, Abbott AG, Llacer G, Badenes ML: An apri-
cot (Prunus armeniaca L.) F2 progeny linkage map based on
SSR and AFLP markers, mapping plum pox virus resistance
and self-incompatability traits. Theor Appl Genet 2003,
107:239-247.
22. Rajapakse S, Byrne DH, Zhang L, Anderson N, Arumugathan K, Bal-
lard RE: Two genetic linkage maps of tetraploid roses. Theor
Appl Genet 2001, 103:575-583.
23. Ky CL, Barre P, Lorieux M, Trouslot P, Akaffou S, Louarn J, Charrier
A, Hamon S, Noirot M: Interspecific genetic linkage map, seg-
regation distortion and genetic conversion in coffee (Coffea
sp). Theor Appl Genet 2000, 101:669-676.
24. Ong SH, Chuah CC, Sow HP: The co-dominance theory: genetic
interpretations of analysis of mesocarp oils from Elaeis
guineensis, Elaies oleifera and their hybrids. J Amer Oil Chem Soc
1981, 58:1032-1038.
25. Septiningsih EM, Trijatmiko KR, Moeljopawiro S, McCouch SR: Iden-
tification of quantitative trait loci for grain quality in an
advanced backcross population derived from the Oryza
sativa variety IR64 and the wild relative O. rufipogon. Theor
Appl Genet 2003, 107:1433-1441.
BMC Plant Biology 2009, 9:114 />Page 19 of 19
(page number not for citation purposes)
26. Rajanaidu N, Rao V, Tan BK: Analysis of fatty acids composition
(FAC) in Elaeis guineensis, Elaeis oleifera, their hybrids and its
implications in breeding. Palm Oil Research Institute (PORIM) Bulle-
tin 1983, 7:9-20.
27. Sambanthamurthi R, Abrizah O, Umi Salamah R: Biochemical fac-
tors that control oil composition in the oil palm. J Oil Palm Res
1999:24-33.
28. Zhao J, Dimov Z, Becker HC, Ecke W, Mollers C: Mapping QTL
controlling fatty acid composition in a doubled haploid rape-
seed population segregating for oil content. Mol Breeding 2008,
21:115-125.
29. Perez-Vich B, Knapp SJ, Leon AJ, Fernandez-Martinez JM, Berry ST:
Mapping minor QTL for increased stearic acid content in
sunflower seed oil. Mol Breeding 2004, 13:313-322.
30. van Ooijen JW: MapQTL
®
5.0: Software for the mapping of
quantitative trait loci in experimental populations. Kyazma
BV, Wageningen, Netherlands; 2004.
31. Sambanthamurti R, Parveez GKA, Cheah SC: Genetic engineering
of the oil palm. In Advances in Oil Palm Research Volume 1. Edited by:
Basiron Y, Jalani BS, Chan KW. Malaysian Palm Oil Board, Bandar Baru
Bangi, Malaysia; 2000:284-331.
32. Parveez GK: Novel products from transgenic oil palm. AgBio-
techNet 2003, 5:ABN113.
33. Arasu NT, Lawrence MJ, Rajanaidu N: Prospects for the altera-
tion of fatty acid composition in the oil palm through breed-
ing. In Proceedings of the 1987 International Oil Palm/Palm Oil
Conference, Progress & Prospects Edited by: Hassan, AH, Chew, PS,
Wood BJ, Pushparajah E. Palm Oil Research Institute of Malaysia and
Incorporated Society of Planters; 1987:86-93.
34. Grattapaglia D, Sederoff R: Genetic linkage mapping in Eucalyp-
tus grandis and Eucalyptus urophylla using a pseudo-testcross
mapping strategy and RAPD markers. Genetics 1994,
137:1121-1137.
35. Simone MD, Morgante M, Lucchin M, Parrini P, Marocco A: A first
linkage map of Cichorium intybus L. using a one-way pseudo-
testcross and PCR-derived markers. Mol Breeding 1997,
3:415-425.
36. Ho CL, Kwan YY, Choi MC, Tee SS, Ng WH, Lim KA, Lee YP, Ooi
SE, Lee WW, Tee JM, Tan SH, Kulaveerasingam H, Alwee SSRS,
Abdullah MO: Analysis and functional annotation of expressed
sequence tags (ESTs) from multiple tissues of oil palm (Elaeis
guineensis Jacq.). BMC Genomics 2007, 8:381.
37. Low ET, Halimah A, Soo-Heong B, Elyana MS, Chi-Yee AT, Leslie CL,
Suan-Choo C, Abdul RR, Kiew-Lian W, Rajinder S: Oil palm Elaeis
guineensis Jacq. tissue culture ESTs Identifying genes associ-
ated with callogenesis and embryogenesis. BMC Plant Biology
2008, 8:62.
38. Hu X, Sullivan-Gilbert M, Gupta M, Thompson SA: Mapping of the
loci controlling oleic and linolenic acid contents and develop-
ment of fad2 nd fad3 allele-specific markers in canola
(Brassica napus L.). Theor Appl Genet 2006, 113:
497-507.
39. Singh R, Soon-Guan T, Panandam J, Sharma M, Suan-Choo C: Prelim-
inary analysis of quantitative traits loci associated with oil
quality in an interspecific cross of oil palm. Pertanika J Trop Agric
Sci 2007, 30:31-44.
40. Alrefai R, Berk TG, Rocheford TR: Quantitative trait locus anal-
ysis of fatty acid concentration in maize. Genome 1995,
38:894-901.
41. Mangolin CA, de Souza CL, Garcia AF, Sibov ST, de Souza AP: Map-
ping QTLs for kernel oil content in a tropical maize popula-
tion. Euphytica 2004, 137:251-259.
42. Somers DJ, Friesen KR, Rakow G: Identification of molecular
markers associated with linolenic acid desaturation in
Brassica napus. Theor Appl Genet 1998, 96:897-903.
43. Jourdren C, Barret P, Horvais R, Delourme R, Renard M: Identifica-
tion of RAPD markers linked to linolenic acid genes in rape-
seed. Euphytica 1996, 90:351-357.
44. Perez-Vich B, Fernandez-Martinez JM, Grondona M, Knapp SJ, Berry
ST: Stearoyl-ACP and oleoyl-PC desaturase genes cosegre-
gate with quantitative trait loci underlying high stearic and
high oleic acid mutant phenotypes in sunflower. Theor Appl
Genet 2002, 104:338-349.
45. Burns MJ, Barnes SR, Bowman JG, Clarke MH, Werner CP, Kearsey
MJ: QTL analysis of an intervarietal set of substitution lines in
Brassica napus: (i) Seed oil content and fatty acid composi-
tion. Heredity 2003, 90:39-48.
46. Panthee DR, Pantalone VR, Saxton AM: Modifier QTL for fatty
acid composition in soybean oil. Euphytica 2006, 152:67-73.
47. Lande R, Thompson R: Efficiency of marker-assisted selection in
the improvement of quantitative traits. Genetics 1990,
124:743-756.
48. Strauss SH, Lande R, Namkoong G: Limitations of molecular
marker aided selection in forest tree breeding. Can J For Res
1992, 22:1050-1061.
49. Lander E, Kruglyak L: Genetic dissection of complex traits:
guidelines for interpreting and reporting linkage results. Nat
Genet 1995, 11:241-247.
50. Cheah SC: Genetic engineering of oil crops for oil quality. Palm
Oil Developments 1994, 20:28-34.
51. Hospital F, Moreau L, Charcosset A, Gallais A: More on the effi-
ciency of marker assisted selection. Theor Appl Genet 1997,
95:1181-1189.
52. Doyle JJ, Doyle JL: Isolation of plant DNA from fresh tissue.
FOCUS 1990, 12:13-15.
53. Rafalski JA, Vogel JM, Morgante M, Powell W, Andre C, Tingey SV:
Generating and using DNA markers in plants. In Non-mamma-
lian Genomic Analysis – A Practical Guide Edited by: Birren B, Lai E. Aca-
demic Press, San Diego; 1996.
54. Cheah SC: Restriction Fragment Length Polymorphism
(RFLP) in Oil Palm. In Project Completion Report No. 0011/95
Malaysian Palm Oil Board, Bandar Baru Bangi, Malaysia; 1996.
55. Cheah SC, Rajinder S: Gene expression during flower develop-
ment in the oil palm. In Project Completion Report No. 0057/98
Malaysian Palm Oil Board, Bandar Baru Bangi, Malaysia; 1998.
56. Sambrook J, Fritsch EF, Maniatis T: Molecular cloning: A Labora-
tory manual. 2nd edition. Cold Spring Harbor Laboratory Press,
Cold Spring Harbor, N.Y; 1989.
57. Rahimah AR, Cheah SC, Singh R: Freeze-drying of oil palm (Elaeis
guineensis) leaf tissue and its effect on quality of extractable
DNA. J Oil Palm Res 2006, 18:296-304.
58. Ewing B, Hillier LAD, Wendl MC, Green P: Base-calling of auto-
mated sequences traces using Phred. I. Accuracy Assess-
ment. Genome Res 1998, 8:175-185.
59. Altschul SF, Madden TL, Schaffer AA, Zhang J, Zhang Z, Miller W, Lip-
man DJ: Gapped Blast and PSI-BLAST: new generation of
protein database search programs. Nucleic Acids Res 1997,
25:3389-3402.
60. Fisher PJ, Gardner RC, Richardson TE: Single locus microsatel-
lites isolated using 5' anchored PCR. Nucleic Acids Res 1996,
24:4369-4371.
61. Brachet S, Jubier MF, Richard M, Jung-Muller B, Lacoste NF: Rapid
identification of microsatellite loci using 5' anchored PCR in
the common ash Fraxinus excelsior L. Mol Ecol 1999, 8:160-163.
62. Rozen S, Skaletsky HJ: Primer 3 on the WWW for general users
and for biologists programmers. In Bioinformatics Methods and
Protocols: Methods in Molecular Biology Edited by: Krawetz S, Misener S.
Humana Press, Totowa, NJ; 2000:365-386.
63. Chua BH, Elyana MS, Boon SH, Wizana ZA, Leslie LET, Rajinder S,
Tan SG, Faridah QZ, Cheah SC: Preliminary analysis of micros-
atellites derived from oil palm tissue culture ESTs. Malaysian
Society for Molecular Biology and Biotechnology (MSMBB) 2004 Scientific
Meeting, Melaka, Malaysia 2004:127.
64. Lespinasse D, Rodier-Goud M, Grivet L, Leconte A, Legnate H, Seguin
M: A saturated genetic linkage map of rubber tree (Hevea
spp.) based on RFLP, AFLP, microsatellite, and isozyme
markers. Theor Appl Genet 2000, 100:127-138.
65. van Ooijen JW: JoinMap
®
4.0: Software for the calculation of
genetic linkage maps in experimental populations. Kyazma
BV, Wageningen, Netherlands; 2006.
66. Lin SW, Sue TT, Ai TY: Methods of test for palm oil and palm
oil products. In PORIM Test Methods Palm Oil Research Institute of
Malaysia, Bandar Baru Bangi, Malaysia; 1995:181.