báo cáo khoa học: " Association mapping and marker-assisted selection of the lettuce dieback resistance gene Tvr1" potx
Bạn đang xem bản rút gọn của tài liệu. Xem và tải ngay bản đầy đủ của tài liệu tại đây (4.21 MB, 16 trang )
BioMed Central
Page 1 of 16
(page number not for citation purposes)
BMC Plant Biology
Open Access
Research article
Association mapping and marker-assisted selection of the lettuce
dieback resistance gene Tvr1
Ivan Simko*
1
, Dov A Pechenick
1
, Leah K McHale
2,3,4
, María José Truco
2
,
Oswaldo E Ochoa
2
, Richard W Michelmore
2
and Brian E Scheffler
5
Address:
1
United States Department of Agriculture-Agricultural Research Service, Crop Improvement and Protection Research Unit, 1636 East
Alisal Street, Salinas, CA 93905, USA,
2
The Genome Center and Department of Plant Sciences, University of California, 451 Health Sciences Drive,
Davis, CA 95616, USA,
3
Rijk Zwaan BV, PO Box 40, 2678 ZG De Lier, the Netherlands,
4
Department of Horticulture and Crop Science, Ohio State
University, Columbus, OH 43210, USA and
5
United States Department of Agriculture-Agricultural Research Service, Genomics and Bioinformatics
Research Unit, 141 Experiment Station Road, Stoneville, MS 38776, USA
Email: Ivan Simko* - ; Dov A Pechenick - ; Leah K McHale - ;
María José Truco - ; Oswaldo E Ochoa - ; Richard W Michelmore - ;
Brian E Scheffler -
* Corresponding author
Abstract
Background: Lettuce (Lactuca saliva L.) is susceptible to dieback, a soilborne disease caused by two
viruses from the family Tombusviridae. Susceptibility to dieback is widespread in romaine and leaf-type
lettuce, while modern iceberg cultivars are resistant to this disease. Resistance in iceberg cultivars is
conferred by Tvr1 - a single, dominant gene that provides durable resistance. This study describes fine
mapping of the resistance gene, analysis of nucleotide polymorphism and linkage disequilibrium in the Tvr1
region, and development of molecular markers for marker-assisted selection.
Results: A combination of classical linkage mapping and association mapping allowed us to pinpoint the
location of the Tvr1 resistance gene on chromosomal linkage group 2. Nine molecular markers, based on
expressed sequence tags (EST), were closely linked to Tvr1 in the mapping population, developed from
crosses between resistant (Salinas and Salinas 88) and susceptible (Valmaine) cultivars. Sequencing of these
markers from a set of 68 cultivars revealed a relatively high level of nucleotide polymorphism (
θ
= 6.7 ×
10
-3
) and extensive linkage disequilibrium (r
2
= 0.124 at 8 cM) in this region. However, the extent of linkage
disequilibrium was affected by population structure and the values were substantially larger when the
analysis was performed only for romaine (r
2
= 0.247) and crisphead (r
2
= 0.345) accessions. The association
mapping approach revealed that one of the nine markers (Cntg10192) in the Tvr1 region matched exactly
with resistant and susceptible phenotypes when tested on a set of 200 L. sativa accessions from all
horticultural types of lettuce. The marker-trait association was also confirmed on two accessions of
Lactuca serriola - a wild relative of cultivated lettuce. The combination of three single-nucleotide
polymorphisms (SNPs) at the Cntg10192 marker identified four haplotypes. Three of the haplotypes were
associated with resistance and one of them was always associated with susceptibility to the disease.
Conclusion: We have successfully applied high-resolution DNA melting (HRM) analysis to distinguish all
four haplotypes of the Cntg10192 marker in a single analysis. Marker-assisted selection for dieback
resistance with HRM is now an integral part of our breeding program that is focused on the development
of improved lettuce cultivars.
Published: 23 November 2009
BMC Plant Biology 2009, 9:135 doi:10.1186/1471-2229-9-135
Received: 17 July 2009
Accepted: 23 November 2009
This article is available from: />© 2009 Simko et al; licensee BioMed Central Ltd.
This is an Open Access article distributed under the terms of the Creative Commons Attribution License ( />),
which permits unrestricted use, distribution, and reproduction in any medium, provided the original work is properly cited.
BMC Plant Biology 2009, 9:135 />Page 2 of 16
(page number not for citation purposes)
Background
Lettuce dieback disease is widespread in commercially
grown romaine and leaf-type lettuces [1]. The disease is
caused by two closely related soilborne viruses from the
family Tombusviridae Tomato bushy stunt virus (TBSV)
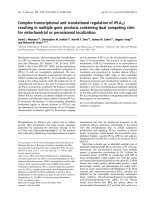
and Lettuce necrotic stunt virus (LNSV) [2]. Symptoms of
lettuce dieback include mottling and necrosis of older
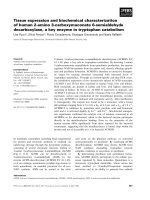
leaves, stunting, and plant death (Figure 1). The character-
istic symptoms usually appear after the plant has reached
6 to 8 weeks of age and render the plant unmarketable [1].
TBSV and LNSV are extremely persistent viruses and they
are likely to survive in soil and water for long periods of
time [3]. The virus has no known vector and it seems to
move through infested soil and water [4]. While fungal
vectors are not necessary for transmission, studies have yet
to be conducted to determine if such vectors can facilitate
or increase rates of virus transmission to lettuce. Previous
studies have provided no evidence that either chemical
treatment or rotation with non-host crops can effectively
reduce, remove, or destroy the virus in infested soil [5].
Since there are no known methods to prevent the disease
in a lettuce crop grown in an infested field, genetic resist-
ance remains the only option for disease control [1].
Although susceptibility to dieback is widespread in
romaine and leaf lettuces, modern iceberg-type cultivars
remain completely free of symptoms when grown in
infested soil [1,6]. It appears that the resistance observed
in iceberg cultivars was originally introduced into the ice-
berg genepool from the cultivar Imperial around 70 years
ago [3,7]. If true, this suggests that the resistance is effec-
tive and highly durable despite extensive cultivation of
iceberg cultivars. Through use of molecular marker tech-
nology, the single dominant gene (Tvr1), which is respon-
sible for the dieback resistance in iceberg lettuce, has been
mapped to chromosomal linkage group 2 [1]. Position of
the gene was inferred with AFLP and RAPD markers in a
population originating from a cross between the resistant
cultivar Salinas and the susceptible cultivar Iceberg (cv.
Iceberg is a Batavia type lettuce). Another dieback resist-
ance gene was discovered in the primitive romaine-like
accession PI491224 [6]. Analysis of resistance in offspring
originating from a cross between the two resistant geno-
types (Salinas × PI491224) indicates that the resistance
locus in PI491224 is either allelic or linked to Tvr1 [1].
Because of the increased interest in non-iceberg types of
lettuce, introgressing Tvr1 into romaine, leaf, and other
susceptible types is of high priority for the lettuce indus-
try. However, the breeding process is slow and labor
intensive due to a need for extensive field-based testing.
Application of marker-assisted selection (MAS) can
reduce the need for field screening and accelerate develop-
ment of dieback resistant material.
To pinpoint the location of the Tvr1 gene and develop
markers for marker-assisted selection, we employed a
Dieback symptoms on different types of lettuce: A - stem type, B - leaf type, C - green romaine, and D - red romaineFigure 1
Dieback symptoms on different types of lettuce: A -
stem type, B - leaf type, C - green romaine, and D -
red romaine. Plants on the left are healthy, while plants on
the right show typical symptoms of dieback, such as stunted
growth, yellowing of older leaves, and gradual dying. Photo-
graphs were taken eight weeks after planting.
BMC Plant Biology 2009, 9:135 />Page 3 of 16
(page number not for citation purposes)
combination of classical linkage and association mapping
techniques [8]. The association mapping approach is
based on the extent of linkage disequilibrium observed in
a set of accessions that are not closely related. In contrast
to linkage mapping, association mapping is a method that
detects relationships between phenotypic variation and
genetic polymorphism in existing germplasm, without
development of mapping populations. This method
incorporates the effects of recombination occurring in
many past generations into a single analysis [9] and is
thus complementary to linkage analysis. Association map-
ping has been successfully applied in mapping resistance
genes in several diploid and polyploid plant species (e.g.
[10-12]). The main drawback of association mapping is
the possibility of false-positive results due to an unrecog-
nized population structure. When the trait of interest is
more prevalent in one subpopulation (e.g. dieback resist-
ance in iceberg lettuce) than others, the trait will be asso-
ciated with any marker allele that is in high frequency in
that subpopulation (e.g. [13]). Our previous analysis of
population structure with molecular markers revealed
that cultivated lettuce is divided into several well-defined
subpopulations that correspond approximately to differ-
ent horticultural types [14,15]. Consequently, traits that
are strongly correlated with lettuce types display many
false-positive results when population structure is
ignored. However, these spurious associations disappear
when estimates of population structure are included in
the statistical model [15]. Therefore, the best approach for
avoiding spurious associations in lettuce association stud-
ies is to assess relatedness of accessions with molecular
markers and to include this information into the statisti-
cal model [15].
In the present study we mapped the Tvr1 gene using a
combination of linkage and association mapping. High-
resolution DNA melting curve analysis (HRM) was used
to assess polymorphism in mapping populations and to
detect haplotypes associated with the disease resistance.
The potential for marker-assisted selection was then vali-
dated in the genetic backgrounds present in most com-
mon horticultural types of lettuce. Finally, we used SNP
markers to assess intra- and inter-locus linkage disequilib-
rium in the Tvr1 region.
Methods
Linkage mapping population
Recombinant-inbred lines (RILs) were derived from a
cross between an F
1
of cv. Valmaine (dieback susceptible
romaine type) × cv. Salinas 88 and cv. Salinas. Both Sali-
nas and Salinas 88 are iceberg type lettuces resistant to
dieback whose appearance and performance is the same,
except for reaction to Lettuce mosaic virus (Salinas 88 is
resistant). Two hundred and fifty three F
8
RILs were
screened for resistance to dieback in multiple trials and
192 of these RILs were randomly selected for genotyping
with molecular markers.
Association mapping set
A set of 68 cultivars, plant introductions (PI), and breed-
ing lines representing all predominant types of cultivated
lettuce was used for association mapping. The set includes
8 Batavia types, 5 butterhead types, 5 iceberg types, 5 Latin
types, 9 leaf types, 31 romaine types, and 5 stem types
(Table 1). The lettuce accessions were selected from mate-
rial used in breeding programs, ancestors frequently
observed in pedigrees, and newly developed breeding
lines. For each horticultural type both dieback resistant
and susceptible accessions were selected, with the excep-
tion of iceberg lettuce, where only resistant cultivars were
available, and the Latin type, where only susceptible culti-
vars were available.
Validation set
To validate the marker-trait association detected in the
association mapping set, a validation set of 132 accessions
was screened for disease resistance and genotyped with
the marker, Cntg10192. This set represents the spectrum
of phenotypic and genotypic variability observed in culti-
vated lettuce and includes 12 Batavia types, 11 butterhead
types, 36 iceberg types, 1 Latin type, 25 leaf types, 2 oil
types, 42 romaine types, and 3 stem types (Table 1).
Assessment of dieback resistance
Dieback resistance data were obtained from field observa-
tions as previously described [15]. Susceptibility was eval-
uated by seeding lettuce directly in the field in Salinas, CA,
from which TBSV and LNSV had previously been isolated
from plants exhibiting characteristic dieback symptoms
[1]. The experiment was comprised of two complete
blocks, with ~30 plants per genotype per block. Plants
were seeded in two rows on 1 m wide beds and were
thinned to obtain spacing of 30 cm between plants.
Standard commercial practices were used for irrigation,
fertilization, and pest control. Plants were checked weekly
for disease symptoms in order to discriminate between
plants dying due to dieback and those due to unrelated
causes. The percentage of plants that showed typical die-
back symptoms (or were dead due to dieback) was
recorded at harvest maturity. Accessions with < 5% of
symptomatic plants were considered to be resistant. To
minimize the possibility of inaccurate scoring, all acces-
sions were tested in at least three independent field trials.
If results from all three trials were consistent, the material
was not tested further. In the case of inconsistent results,
material was retested in another two independent trials,
BMC Plant Biology 2009, 9:135 />Page 4 of 16
(page number not for citation purposes)
after which all accessions were classified into one of the
two groups. The resistance and susceptibility classification
was subsequently used in statistical analyses.
DNA isolation
Tissue from young leaves of about one-month-old plants
was collected and immediately lyophilized. Lyophilized
samples were ground to fine powder using a TissueLyser
mill (Qiagen, Valencia, CA), before extracting genomic
DNA with the NucleoSpin Plant II kit (Macherey-Nagel,
Betlehem, PA). The DNA concentration and quality was
analyzed with an ND-1000 Spectrometer (NanoDrop
Technologies, Wilmington, DE) and gel electrophoresis.
Polymerase chain reaction, allele detection, and product
sequencing
Primer pairs were designed for each marker from EST
(expressed sequence tag) sequence with the PRIMER 3
software [16]. The selection of ESTs from the CGPDB
database [17] was based on their position in the genome
- only ESTs previously mapped to the linkage group 2 were
considered for development of markers. Due to the pres-
ence of introns in genomic DNA, primers for several
markers had to be designed more than once to obtain an
amplicon for the given marker. The polymerase chain
reaction (PCR) was performed in a 20 μl volume contain-
ing 10 ng of genomic DNA as a template, 200 μmol/L of
Table 1: List of 200 L. sativa accessions used in the association mapping study.
Horticultural Type Resistant Susceptible
Batavia AvonCrisp, Batavia Beaujolais, Drumhead White
Cabbage, Express, Great Lakes 54, Imperial, La
Brillante, River Green
Batavia Blonde A Bord Rouge, Batavia Blonde de Paris,
Batavia Reine des Glaces, Carnival, Fortessa, Hanson,
Holborn's Standard, Iceberg, New York, Progress,
Tahoe Red, Webb's Wonderful
Butterhead Bibb, Cobham Green, Dark Green Boston, Margarita,
Tania, Verpia
Ancora, Dandie, Encore, Lednicky, Madrilene, MayKing,
Ninja, Saffier, Tinto, Tom Thumb
Iceberg Astral, Autumn Gold, Ballade, Barcelona, Bix, Black Velvet,
Bounty, Bronco, Bullseye, Calmar, Climax, Coyote,
Diamond, Duchesse, Eastern Lakes, Empire, Fimba,
Formidana, Glacier, Green Lightening, IceCube, Invader,
Lighthouse, Mini Green, Misty Day, Monument, Pacific,
Primus, Raiders, Red Coach, Salinas, Salinas 88, Sea
Green, Sharp Shooter, Sniper, Sureshot, Tiber,
Vanguard, Winterhaven, Winterselect, Wolverine
Latin Barnwood Gem, Eruption, Gallega, Little Gem,
Pavane, Sucrine
Leaf Alpine, Cracoviensis, Grand Rapids, PI177418, Pybas
Green, Ruby Ruffles, Salad Bowl, Shining Star, Slobolt,
Two Star, Waldmann's Green
Australian, Cavarly, Coastal Star BS, Colorado, Deep red,
Deer's Tongue, Flame, Lolla Rossa, Merlot, North Star,
Oak Leaf, Prizehead, Red Oak Leaf, Red Salad Bowl, Red
Tide, Redina, Royal Red, Ruby, Squadron, Triple Red,
Ventana, Vulcan, Xena
Oil PI250020, PI251245
Romaine 01-778M, 01-781M, 01-789M, Athena, Bandit, Blonde
Lente a Monter, Defender, PI171666, PI491209,
PI491214, PI491224, Skyway, Sturgis, Sx08-003, Sx08-
004, Sx08-005, Sx08-006, Sx08-007, Sx08-008, Triple
Threat
Annapolis, Apache, Ballon, Bautista, Brave Heart, Caesar,
Camino Real, Chicon des Charentes, Clemente, Coastal
Star WS, Conquistador, Dark Green Cos, Darkland, Eiffel
Tower, Gladiator, Gorilla, Green Forest, Green
Towers, Heart's Delight, Infantry, King Henry, Larga
Rubia, Lobjoits, Majestic Red, Medallion, Outback, Paris
White, Parris Island Cos, PI140395, PI169510, PI177426,
PI179297, PI220665, PI268405, PI269503, PI269504,
PI289064, PI358027, PI370473, PI420389, Queen of Hearts,
Reuben's Red, Romaine Chicon, Rouge d'Hiver, Short
Guzmaine, Signal, Tall Guzmaine, Triton, Ultegra,
Valcos, Valmaine, Wayahead, White Paris
Stem Balady Bahera, Balady Banha, Balady Barrage,
Celtuce, Chima
Balady Aswan, Balady Cairo, PI207490
Accessions that were sequenced are in bold; the remaining accessions were analyzed with the HRM approach only.
BMC Plant Biology 2009, 9:135 />Page 5 of 16
(page number not for citation purposes)
each dNTP, 1× Standard Taq PCR buffer with 1.5 mmol/L
MgCl
2
, 1.2 U Taq polymerase (all from New England
Biolabs, Ipswich, MA), and forward and reverse primers at
a concentration of 0.25 μmol/L each. The reaction condi-
tions were as follows: 95° for 2 min, followed by 35 cycles
of 95° for 30 s, annealing temperature (Table 2) for 30 s,
and 72° for 30 s, with final extension of 72° for 5 min.
Amplification was performed in an MJ Research Tetrad
Thermal Cycler (MJ Research, Waltham, MA). The PCR
products were analyzed on gels composed of 0.7% agar-
ose (Fisher Scientific, Pittsburgh, PA) and 1.15% Synergel
(Diversified Biotech, Boston, MA) run with 0.5× TBE
buffer. PCR samples were stained prior to electrophoresis
with 1× GelRed (Biotium, Hayward, CA). Alternatively,
the PCR products were separated using an HDA-GT12
DNA analyzer and scored by Biocalculator software (both
from eGene, Irvine, CA). If sequencing was needed, PCR
products were first treated with Exonuclease I and subse-
quently with Antarctic Phosphatase (both from New Eng-
land Biolabs). DNA sequencing was performed using ABI
BigDye Terminator (v3.1; Applied Biosystems, Foster City,
CA) according to the manufacturer's protocol, except that
5-μl reactions were performed with 0.25 μl of BigDye on
an ABI 3730xl DNA sequencing machine with 50 cm
arrays.
DNA sequences were analyzed with CodonCode Aligner
v. 2.0.6 (CodonCode Corporation, Dedham, MA). We
detected three types of polymorphism in our sequences -
single feature polymorphism (SFP), insertions and dele-
tions (indels) and variable number tandem repeats
(VNTRs). Most of the SFPs that had been detected using
the Affymetrix GeneChip [17] were due to a single nucle-
otide polymorphism (SNP), but in five cases due to a sin-
gle base indel. Since Haploview cannot handle missing
values, missing bases were substituted prior to data analy-
sis with an appropriate single nucleotide. Because all sin-
gle-base indels could be tagged with SNPs from the same
marker locus (as described below), we use the term SNP
throughout the text. Both indels and VNTRs were
excluded from data analysis, unless otherwise noted in the
text.
High-resolution DNA melting curve (HRM) analysis
EST-derived markers were screened for polymorphism
using high-resolution melting curve analysis. Primer pairs
for each marker were developed with the PRIMER 3 soft-
ware and tested for optimal amplification using a temper-
ature gradient (from 58-67°). Amplifications were
performed in 10 μl reactions containing 10 ng DNA, 200
μmol/L of each dNTP, 0.6 U Taq polymerase, 1× Standard
Taq buffer with 1.5 mmol/L MgCl
2
(all from New England
Biolab), 1× LCGreen Plus Melting Dye (Idaho Technol-
ogy, Salt Lake City, UT), 0.25 μmol/L of each primer, and
15 μL of mineral oil (USB Corporation, Cleveland, OH).
PCR was performed on a MJ Research Tetrad Thermal
Cycler with an initial denaturation of 95° for 2 min, fol-
lowed by 45 cycles of 95° for 30 s, annealing temperature
(Table 3) for 30 s, and 72° for 30 s, with final extension
of 72° for 5 min. To facilitate heteroduplex formation
Table 2: Information for nine markers that were sequenced from a set of 68 L. sativa accessions.
Marker EST/Contig in CGPDB Primers (5' - 3') Ta (°C) Mg (mM) Amplicon
size (bp)
LK1457 QG_CA_Contig4638 F - AGGAGCAAAGGAAAGGCTTC 57 1.5 636-648
R - TGCAACTTCTTCAGCCAATG
Cntg10044 CLS_S3_Contig10044 F - GCATGCCGATTACTCCTTTC
R - TCCCCAATCACCTAAGATGG
57 1.5 845-860
QGG19E03 QGG19E03.yg.ab1 F - ATATCCCACCGCCCATAGAT 57 1.5 711-720
R - ACGCAACTAACCCGTTTCAT
Cntg4252 CLS_S3_Contig4252 F - GGGGAGTTCAGACGTTCAGT 57 1.5 1160
R - CGAATTGATACACCGCAAAA
Cntg10192 CLS_S3_Contig10192 F - CTCGTTTTCAACACCGACAA 57 1.5 349
R - TTGTCTCCGGCACTGTATCATCG
CLSM9959 CLSM9959.b1_N18.ab1 F - TGCTCAATTACACTCGAACCA 57 1.5 326
R - CTTCATGGAGAGAAATACAAGGTC
CLSZ1525 CLSZ1525.b1_J22.ab1 F - TTGTTGAAATTATAAACACGAAGCA 57 3 499-629
R - CAACAAAGGATGTCTCAAATTCA
QGC11N03 QGC11N03.yg.ab1 F - GCACCTGATGGCTGAATATG 57 1.5 569-581
R - CATCCTCAATCGCTTGTGTT
Cntg11275 CLS_S3_Contig11275 F - GGAGAAATTTTGGAGCTGTAATTAC 61 1.5 765-956
R - GGAGGTATGTTGAGGTACATGAC
Columns indicate marker name, EST or Contig information in the CGPDB database, forward and reverse primers, annealing temperature (Ta),
magnesium concentration in PCR reaction, and size of amplicon. Marker QGG19E03 could not be successfully amplified from 13 accessions even
though 34 primer combinations were tested.
BMC Plant Biology 2009, 9:135 />Page 6 of 16
(page number not for citation purposes)
samples were subjected, after the final extension, to 95°
for 30 s followed by cooling to 25° for 30 s. Simulation of
a heterozygote was achieved by mixing equal amounts of
DNA from the two parental homozygous cultivars before
PCR amplification. Melting-curve analysis was performed
in a 96-well plate (HSP-9665, Biorad, Hercules, CA) on a
LightScanner System and with the LightScanner software
v. 2.0.0.1331 (both from Idaho Technology). Melting
curves were analyzed as described in the LightScanner
software manual.
Linkage mapping
One hundred and ninety two RILs derived from a cross
between an F
1
of cv. Valmaine × cv. Salinas 88 and cv. Sali-
nas were genotyped with EST-derived markers. Selection
of markers for this first round of genotyping was based on
the molecular linkage map developed from an interspe-
cific cross between L. sativa cv. Salinas and Lactuca serriola
accession UC96US23 [17,18]. Twenty markers were
selected to evenly cover linkage group 2 in intervals of
approximately 10 to 20 cM. After preliminary mapping of
the resistance gene, the region containing Tvr1 was satu-
rated with markers originating from a microarray-based
study also carried out on the Salinas × UC96US23 popu-
lation [17]. Marker polymorphism was tested with HRM
analysis, unless the difference between segregating alleles
could be visually observed using gel electrophoresis. If
polymorphism could not be observed with HRM analysis,
PCR products from the two parental genotypes were
sequenced and new primers were designed for HRM. Sta-
tistical analysis of the linkage between molecular markers
and dieback resistance was performed by MapManager
QTX software [19]. Dieback resistance for each RIL was
considered as a bi-allelic qualitative trait (resistant or sus-
ceptible) and used for linkage analysis.
Association mapping and assessment of population
structure
Association mapping was performed on a set of 68 acces-
sions from seven horticultural types of lettuce (Table 1).
In the first step, markers closely linked to the Tvr1 gene
were amplified from each accession and sequenced. In the
second step, the sequenced amplicons were analyzed for
polymorphism with the CodonCode software and input-
ted into Haploview v. 4.2 [20]. Intra-locus SNPs were
tagged in Haploview with the Tagger function at r
2
= 1.
Untagged SNPs from all markers and a representative SNP
for each tag were then entered into TASSEL v. 2.0.1 [21].
TASSEL was subsequently used to test for association
between individual SNPs and resistance to dieback while
accounting for the population structure. Both p-values for
each SNP and percent of phenotypic variation explained
by the model (R
2
) were calculated with TASSEL after
100,000 permutations.
Prior to association analysis, the population structure in
the set of 68 accessions was assessed with thirty EST-SSR
markers distributed throughout the genome [14] using
the computer program STRUCTURE 2.2 [22]. Ten runs of
STRUCTURE were done by setting the number of popula-
tions (K) from 1 to 15. For each run, the number of itera-
tions and burn-in period iterations were both set to
200,000. The ad hoc statistic [23] was used to estimate the
number of subpopulations. The optimum number of sub-
populations (K = 5) was subsequently used to calculate
the fraction of each individual's genome (q
k
) that origi-
nates from each of the five subpopulations. The q
k
values
obtained from STRUCTURE were used as covariates in the
statistical model given by TASSEL.
Table 3: Information for six markers that were analyzed in the (Valmaine × Salinas 88) × Salinas mapping population with the HRM
approach.
Marker EST/Contig in CGPDB Primer (5' - 3') Ta (°C) Mg (mM) Amplicon size (bp)
LK1457 QG_CA_Contig4638 F - AGGAGCAAAGGAAAGGCTTC 64 3 636-648
R - TGCAACTTCTTCAGCCAATG
Cntg4252 CLS_S3_Contig4252 F - AGAACCAGGTCGAATCATGG 61 1.5 208
R - TTCTCGCCGTTGAGAAGAAT
Probe - AAGTGGCTATACAGCTTTGATCATAACGA
Cntg10192 CLS_S3_Contig10192 F - CTCGTTTTCAACACCGACAA 61 1.5 185
R - TAGGTGGGTCCGACTTTGAG
CLSM9959 CLSM9959.b1_N18.ab1 F - TGCTCAATTACACTCGAACCA 61 1.5 326
R - CTTCATGGAGAGAAATACAAGGTC
CLSZ1525 CLSZ1525.b1_J22.ab1 F - GAAGAAACTCATGAATCTGCTCAA 62 3 157-158
R - TTTGCTCAAGAACTCTTAAACCATT
Cntg11275 CLS_S3_Contig11275 F - CCAAACCATAGGGACGAAAA 61 1.5 252-260
R - GGAGGTATGTTGAGGTACATGAC
Marker Cntg4252 was analyzed in combination with a probe. Polymorphisms for three markers that are not shown in the table were detected by
electrophoresis. All information for these is the same as in Table 2.
BMC Plant Biology 2009, 9:135 />Page 7 of 16
(page number not for citation purposes)
Genetic variation and a linkage disequilibrium estimate
The level of genetic variation at the nucleotide level was
estimated as nucleotide polymorphism (
θ
, [24]) and
nucleotide diversity (
π
, [25]). To test the neutrality of
mutations, we employed Tajima's D test [26], which is
based on differences between
π
and
θ
. Analyses of genetic
variation and estimates of haplotype diversity (Hd) were
carried out using DnaSP v. 5.00.04 software [27].
Linkage disequilibrium (r
2
) between pairs of SNP loci in
the genome was calculated with Haploview and the values
were pooled over the entire data set. Decay of LD with dis-
tance was estimated using a logarithmic trend line that
was fitted to the data. Distances between markers were cal-
culated from their respective positions on the consensus
molecular linkage map. The consensus map was created
with JoinMap v. 2.0 [28] from the Salinas × UC96US23
map [18] and the (Valmaine × Salinas 88) × Salinas map
(present work). SNPs with frequency < 5% were excluded
from the analysis.
Results
Linkage mapping
Cv. Salinas was resistant, while cv. Valmaine was suscepti-
ble to dieback in seven trials over four years. The disease
index for cultivar Salinas ranged from 0% to 2% and for
cultivar Valmaine from 69% to 100% among these field
experiments. We found highly significant correlations
(from r = 0.63 to r = 0.89, p < 0.001) between estimated
percentages of symptomatic plants in independent trials
(data not shown). From 253 RILs tested in multiple exper-
iments, 124 were resistant and 129 were susceptible. This
segregation is not significantly different from the expected
1:1 ratio, consistent with a single gene effect. The segrega-
tion ratio in the 192 individuals that were used for map-
ping of the resistance gene was 92 resistant to 100
susceptible. Linkage mapping on the framework map with
markers spaced about 10 cM to 20 cM apart indicated that
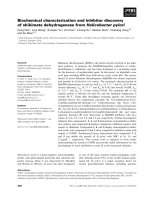
the Tvr1 gene is linked to the marker LK1457. When this
genomic region was saturated with additional markers,
the Tvr1 locus co-segregated with two of them. These two
markers are based on ESTs Cntg4252 and Cntg10192.
Besides the two co-segregating markers; another six mark-
ers were located within 5 cM of the resistance gene. These
markers are based on ESTs Cntg10044, QGG19E03,
CLSM9959, CLSZ1525, QGC11N03, and Cntg11275
(Figure 2).
Nucleotide polymorphism
The nine markers closely linked to Tvr1 were amplified
and sequenced from a set of 68 accessions. This set
included all major horticultural types of lettuce that had
been previously screened for resistance to dieback. Thirty-
six of the accessions showed resistance to the disease and
32 were susceptible. Five of the seven horticultural types
included both resistant and susceptible genotypes. The
two exceptions were iceberg and Latin types, where only
resistant and susceptible accessions respectively were
available. Sequencing of over 370 kb from nine markers in
the 68 accessions revealed 160 SNPs, six indels (3 bp to 12
bp long), and two VNTRs (in markers CLSZ1525 and
Cntg11275). Sequenced markers were between ~300 bp
to 1 kb long, having 3 to 35 polymorphic sites, and 3 to
10 haplotypes (Table 4). Haplotype diversity (Hd) was
similar in all markers and ranged from 0.593 to 0.809.
Values for nucleotide diversity (
π
) ranged from 2.37 × 10
-
3
to 8.67 × 10
-3
(exon and intron values combined) with
an exception of marker CLSZ1525 that had a value of
31.22 × 10
-3
. Nucleotide polymorphism (
θ
) was in the
range from 1.54 × 10
-3
to 8.30 × 10
-3
. However, two mark-
ers each had a level of polymorphism above 10 × 10
-3
;
marker QGC11N03 (11.32 × 10
-3
) and marker CLCZ1525
(15.23 × 10
-3
). Since the sequenced regions of markers
LK1457, Cntg10044, Cntg4252, and Cntg11275 contain
both introns and exons, it is possible to compare poly-
morphism between the two groups. While there was no
significant difference in haplotype diversity between
introns and exons, both nucleotide diversity (
π
) and pol-
ymorphism (
θ
) were approximately 4.7 fold higher in
introns (p = 0.01998 for
π
, p = 0.00018 for
θ
) (data not
shown). Values of Tajima's D ranged from -1.224 to
3.397. Significant values of this parameter were calculated
for markers LK1475, Cntg4252, and Cntg11275 when
combined intron and exon data were considered and for
markers Cntg10192, CLSM9959, and CLSZ1525 that con-
tain exons only.
Association mapping
Evaluation of population structure in a set of 68 acces-
sions revealed that the best estimate of the number of sub-
populations was five (K = 5) (data not shown). These
subpopulations corresponded approximately with the
horticultural types. Best separated were crisphead (this
type combines iceberg and Batavia), romaine, butterhead
plus Latin, and stem-type lettuces. Leaf-type lettuce was
not separated in a single sub-population. From 160 SNPs
that were identified in the nine markers closely linked to
the Tvr1 gene, 60 were non-redundant for discrimination
of haplotypes. These unique SNPs were included together
with the estimates of population structure in the associa-
tion analysis performed with TASSEL. Eighteen SNPs, one
indel, and one VNTR were significantly (p ≤ 0.001) associ-
ated with the resistance allele (Table 5). Significant SNPs
were detected on all markers with the exception of marker
Cntg4252, for which the best value was p = 0.0042. The
SNP with the largest effect was found on marker
Cntg10192 at position 72. This SNP matches perfectly
with the observed resistance (R
2
= 100%). An additional
SNP from the same tag is located at position 54. Both of
these SNPs have C ⇔ T base substitutions where T is asso-
BMC Plant Biology 2009, 9:135 />Page 8 of 16
(page number not for citation purposes)
ciated with resistance and C with susceptibility to dieback.
Although both mutations are located in the coding region,
they are synonymous and do not lead to changes in
amino acids.
Linkage disequilibrium
Intra- and inter-locus LD were analyzed on nine markers
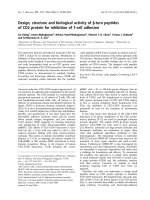
flanking the Tvr1 gene. Intra-locus LD shows a gradual
decline as a function of distance and was estimated to
have a value of r
2
~0.322 at 900 bp (Figure 3). To observe
inter-locus LD, we calculated r
2
between SNPs detected in
different markers. Analysis showed progressive, but slow,
decay of LD and SNPs separated by ~8 cM had an r
2
value
of 0.124. Since estimates of LD can be substantially
affected by a population structure, we calculated LD decay
in two well-defined subpopulations with sufficient num-
bers of individuals (romaine and crisphead). Estimated
values of r
2
at 900 bp were 0.396 and 0.498 for romaine
and crisphead types, respectively. Similarly, at a distance
of ~8 cM we observed a larger LD in both types (r
2
0.247
for romaine, and 0.345 for crisphead) than in the whole
set that combined multiple subpopulations.
Development of markers for marker-assisted selection
The resistance-SNP association observed in the set of 68
accessions was detected through sequencing of PCR
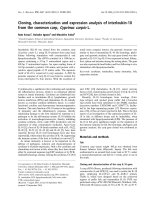
Part of chromosomal linkage group 2, showing nine markers linked to the Tvr1 geneFigure 2
Part of chromosomal linkage group 2, showing nine markers linked to the Tvr1 gene. The map on the left is based
on segregation observed in the (Valmaine × Salinas 88) × Salinas population, the map on the right is based on segregation
observed in the Salinas × UC96US23 population, and the map in the center is a consensus map developed from the two linkage
maps. A black bar on the (Valmaine × Salinas 88) × Salinas map indicates the estimated position of the Tvr1 gene.
Tvr1
cM
LK1457
Cntg10044
QGG19E03
Cntg4252
Cntg10192
CLSM9959
CLSZ1525
QGC11N03
Cntg11275
(Valmaine × Salinas 88) ×
Salinas
LK1457
Cntg10044
QGG19E03
Cntg4252
Cntg10192
CLSM9959
CLSZ1525
QGC11N03
Cntg11275
Consensus
LK1457
Cntg10044
QGG19E03
Cntg4252
Cntg10192
CLSM9959
CLSZ1525
QGC11N03
Cntg11275
Salinas × UC96US23
0
10
BMC Plant Biology 2009, 9:135 />Page 9 of 16
(page number not for citation purposes)
amplicons from individual accessions. In order to acceler-
ate and simplify the test of association, we developed a
primer pair that allowed detection of polymorphism in
the marker Cntg10192 through high-resolution melting
analysis. These primers amplify a 185 bp product that
contains all three SNPs detected in the marker Cntg10192
at the positions 54, 72, and 100. The first two SNPs match
perfectly with the resistance allele, while the third SNP
explains 40.9% of the trait variation. As with the first two
SNPs, the third SNP has a C ⇔ T substitution. All suscep-
tible genotypes carry the T allele, while resistant genotypes
have either the T or C alleles at the third SNP. It appears
that the T allele in the resistant material is associated with
the resistance present in cv. Salinas and most of the other
iceberg cultivars, whereas the C allele is associated with
the resistance present in the three lines (01-778 M, 01-781
M, 01-789 M) that originate from the romaine-like prim-
itive accession PI491224. Marker Cntg10192, therefore,
not only allows for the detection of alleles associated with
dieback resistance, but also separates alleles of different
origins. To further investigate polymorphism in this
genomic region we sequenced two accessions from L. ser-
riola, a wild species closely related to cultivated lettuce.
One of the accessions (UC96US23) is resistant to the dis-
ease, while the other one (PI274808) is susceptible. The
susceptible genotype has the same allele sequence as all
susceptible L. sativa accessions. The resistant accession has
a haplotype similar to cv. Salinas but instead of the T allele
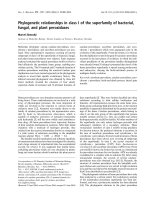
at position 54, it carries the C allele. The three SNPs at the
marker Cntg10192 can thus distinguish four different
haplotypes; three resistant and one associated with sus-
ceptibility (Figure 4). Haplotype R1 (cv. Salinas) has the
T-T-T allele combination at positions 54, 72, and 100.
Haplotype R2 (PI491224) carries the T-T-C combination,
while haplotype R3 (UC96US23) carries the C-T-T alleles.
Disease susceptibility was always associated with the S1
haplotype (cv. Valmaine) that carries the C-C-T combina-
tion. All four haplotypes can easily be separated through
high-resolution melting analysis (Figure 5).
Marker validation
Validation of the haplotype-resistance association
detected in the set of 68 L. sativa accessions and two L. ser-
riola genotypes was performed on an additional set con-
sisting of 132 accessions of L. sativa. This set also
contained diverse material that represented a broad spec-
trum of the variability present in cultivated lettuce. We
used the HRM approach for marker Cntg10192 and, as
before, all genotypes that were susceptible to the disease
carried haplotype S1, while resistant material had either
the R1 or R2 haplotypes (Figure 5). This association was
independent from population structure and was observed
across all horticultural types.
Discussion
Nucleotide polymorphism
Nucleotide polymorphism was observed in all nine mark-
ers that were sequenced from the region flanking the Tvr1
Table 4: Estimates of nucleotide variation in nine markers linked to the Tvr1 gene.
Marker Size (bp) Polymorphic
sites (S)
Haplotypes Haplotype
diversity (Hd)
Nucleotide
diversity (
π
× 10
-3
)
Nucleotide poly-
morphism (
θ
× 10
-
3
)
Tajima's D
LK1457 526 12 5 0.705 8.47 4.75 2.19978 *
LK1457 (exons) 270 2 3 0.634 3.02 1.54 1.59391
Cntg10044 727 29 10 0.760 5.10 8.30 -1.22415
Cntg10044
(exons)
330 6 8 0.758 4.55 3.78 0.4853
QGG19E03
(exons)
673 14 5 0.593 7.05 4.98 1.27593
Cntg4252 1021 16 6 0.747 5.91 3.29 2.3525 *
Cntg4252
(exons)
852 7 5 0.722 2.37 1.73 0.9381
Cntg10192
(exons)
348 3 3 0.644 5.33 2.39 2.78285 **
CLSM9959
(exons)
302 4 5 0.763 6.27 2.75 2.7119 **
CLSZ1525
(exons)
492 35 5 0.783 31.22 15.23 3.3968 ***
QGC11N03
(exons)
518 28 7 0.783 7.43 11.32 -1.09141
Cntg11275 840 29 7 0.809 8.67 4.67 2.11930 *
Cntg11275
(exons)
384 4 5 0.729 2.55 1.65 1.23874
Five of the markers consist of exons only, while the remaining four markers consist of a combination of exons and introns. Analyzed fragments are
shorter than amplified markers, because indels, VNTRs, and some poor sequences were deleted prior to data analysis. *, **, and *** indicate the
significance of Tajima's D test at p ≤ 0.05, p ≤ 0.01, and p ≤ 0.001 (respectively).
BMC Plant Biology 2009, 9:135 />Page 10 of 16
(page number not for citation purposes)
gene. The rate of nucleotide substitutions in a set of 68
accessions translates into ~1 SNP per 149 bp (1/
θ
)
between pairs of randomly selected sequences. This SNP
frequency was somewhat lower when only coding regions
were considered (1 SNP per 187 bp). These values are well
within the range observed for other plant species. For
example, the average SNP frequency is 60 bp in aspen
(Populus tremula L.) [29], 87 bp in potato (Solanum tubero-
sum L.) [30], 104 bp in maize (Zea mays L.) [31], 130 bp
in sugar beet (Beta vulgaris L.) [32], 232 bp in rice (Oryza
sativa L.) [33], 435 bp in sorghum (Sorghum bicolor L.)
[34], 585 bp in tomato (Solanum lycopersicum L.) [35], and
1030 bp in soybean (Glycine max L.) [36]. Both nucleotide
polymorphism (
θ
= 6.7 × 10
-3
, in the coding region 5.4 ×
10
-3
) and nucleotide diversity (
π
= 9.6 × 10
-3
, in the cod-
ing 8.0 × 10
-3
) of lettuce are similar to that observed in
maize (
θ
= 9.6 × 10
-3
,
π
= 6.3 × 10
-3
), potato (
θ
= 11.5 ×
10
-3
,
π
= 14.6 × 10
-3
), and sugar beet (
π
= 7.6 × 10
-3
), but
larger than in tomato (
θ
= 1.71 × 10
-3
,
π
= 1.34 × 10
-3
),
and soybean (
θ
= 0.97 × 10
-3
,
π
= 1.25 × 10
-3
) [30-32,35-
37]. If results from the analyzed region correspond to
those for the whole genome, sequence variation in lettuce
is relatively high for a selfing species. It was previously
observed that selfing species have generally lower levels of
sequence variation than outcrossing species because of
smaller effective population sizes [38]. Although poly-
morphism in lettuce appears to be considerably larger
than in selfing soybean and tomato, it is similar to that
observed in rice, which is also a self-pollinating species.
The ratio of nucleotide diversity in coding (exon) and
non-coding (intron) sequences was not analyzed in detail,
since data from only four markers (LK1457, Cntg10044,
Table 5: Association between SNPs and dieback resistance in a set of 68 L. sativa accessions.
Marker SNP position p-value R
2
% Tagged SNPs
LK1457 137 0.00008 29.2 513
224 0.00001 48.7 235, 236, 251
318 0.00037 25.9 482
Cntg10044 9 0.00470 19.4
27 0.00022 24.8
109* 0.00001 32.3
170** 0.00300 20.1
337 0.00085 22.5
733 0.00001 33.9
QGG19E03 27 0.00001 53.9 46, 525, 574, 594
355 0.00130 33.0 393, 415, 480, 597, 598
Cntg4252 472 0.00420 22.6 480, 486, 489, 490. 492, 493, 499, 544, 577
Cntg10192 72 0.00001 100.0 54
100 0.00001 40.9
CLSM9959 77 0.00001 38.0
242 0.00210 22.7
CLSZ1525 84 0.00498 19.4 100, 102, 144, 236, 250, 258, 279, 309, 399, 400, 402, 457, 464, 483
89 0.00001 48.6 107, 110, 116, 123, 149, 181, 296
465 0.00001 33.2
VNTR*** 0.00001 48.8
QGC11N03 42 0.00010 29.8
50 0.00001 45.0
448 0.00001 50.4
Cntg11275 7 0.00001 42.5
431 0.00001 38.0 525, 534, 559, 583, 590, 748, 798, 799
623 0.00031 27.4 661, 685, 742, 766, 767
Columns indicate markers, SNP position in the marker, the p-value of association, the percent of phenotypic variation explained by the SNP (R
2
%),
and SNPs from the same tag. SNPs with a p-value of ≤ 0.005 are shown, but only those with p ≤ 0.001 are considered to be significant. *, **, and ***
denote indel, SFP, and Variable Number of Tandem Repeats (respectively).
BMC Plant Biology 2009, 9:135 />Page 11 of 16
(page number not for citation purposes)
Cntg4252, Cntg11275) are available. However, the ratio
(0.32) across these markers appears to be smaller than in
Arabidopsis (Arabidopsis thaliana) (0.38 [36]), soybean
(0.45 [36]), maize (0.65 [31]), and potato (0.71 [30]).
This difference is likely due to a higher level of functional
constraint on the perigenic sequence [36] of lettuce. Meas-
ures of haplotype diversity (Hd) were based on estimated
haplotype frequencies [39], and calculated using the
DNAsp software. This measure of diversity is analogous to
the heterozygosity at a single locus, and is at its maximum
when haplotypes observed in the sample occur at equal
frequencies [40]. Diversity based on haplotypes ranged
from 0.593 in QGG19E03 to 0.809 in marker Cntg11275,
with an average value of 0.732 ± 0.024. These values are
Decay of linkage disequilibrium (r
2
) as a function of distance between two SNPsFigure 3
Decay of linkage disequilibrium (r
2
) as a function of distance between two SNPs. Pooled data from nine markers in
the Tvr1 region were used to estimate the (A) intra-locus and (B) inter-locus linkage disequilibrium. Distances for the intra-
locus LD are in base-pairs (bp), while those for inter-locus LD are in centimorgans (cM). The lines indicate logarithmic curves
fitted to the data from a set of 68 accessions representing either all horticultural types, or data from crisphead or romaine
types only.
Crisphead
Romaine
All Types
0
0.1
0.2
0.3
0.4
0.5
0.6
0.7
0.8
0.9
1
0 100 200 300 400 500 600 700 800 900 1000
LD (r2)
Distance
Base pairs CentiMorgans
LD (r
2
)
All Types
Crisphead
Romaine
0 1 2 34567 8
AB
Crisphead
Romaine
All Types
0
0.1
0.2
0.3
0.4
0.5
0.6
0.7
0.8
0.9
1
0 100 200 300 400 500 600 700 800 900 1000
LD (r2)
Distance
Base pairs CentiMorgans
LD (r
2
)
All Types
Crisphead
Romaine
0 1 2 34567 8
AB
Sequence comparison of the four haplotypes detected at marker Cntg10192Figure 4
Sequence comparison of the four haplotypes detected at marker Cntg10192. Three haplotypes (R1, R2, & R3) are
associated with dieback resistance while the S1 haplotype is always associated with susceptibility to the disease. Horizontal
arrows indicate positions of the primers used for sequencing and for the HRM analysis. Asterisks show the positions of the
three SNPs present in the marker.
6² &7&*7777&$$&$&&*$&$$7$$7&$7$&$*7&*7$&$$$&$7$&$$77&&$&&
&&
&$7&7$&$$&&7&7*7*$&
&&
&*$&$*&$$7*&7&77*$7$$&*$&$&77
77
7 ² 6
5² &7&*7777&$$&$&&*$&$$7$$7&$7$&$*7&*7$&$$$&$7$&$$77&&$&7
77
7$7&7$&$$&&7&7*7*$7
77
7*$&$*&$$7*&7&77*$7$$&*$&$&77
77
7 ² 5
5² &7&*7777&$$&$&&*$&$$7$$7&$7$&$*7&*7$&$$$&$7$&$$77&&$&7
77
7$7&7$&$$&&7&7*7*$7
77
7*$&$*&$$7*&7&77*$7$$&*$&$&7&
&&
& ² 5
5² &7&*7777&$$&$&&*$&$$7$$7&$7$&$*7&*7$&$$$&$7$&$$77&&$&&
&&
&$7&7$&$$&&7&7*7*$7
77
7*$&$*&$$7*&7&77*$7$$&*$&$&77
77
7 ² 5
6² 7&&$*7$&*&$7&$&&$*$&&&$7&**&*7&&$7&*7&&$&&&7*7&7&&*7&*&&*7&&&&&7&&7&$$$*7&**$&&&$&&7$777&77&7&$$*7*$² 6
5² 7&&$*7$&*&$7&$&&$*$&&&$7&**&*7&&$7&*7&&$&&&7*7&7&&*7&*&&*7&&&&&7&&7&$$$*7&**$&&&$&&7$777&77&7&$$*7*$ 5
5² 7&&$*7$&*&$7&$&&$*$&&&$7&**&*7&&$7&*7&&$&&&7*7&7&&*7&*&&*7&&&&&7&&7&$$$*7&**$&&&$&&7$777&77&7&$$*7*$ 5
5² 7&&$*7$&*&$7&$&&$*$&&&$7&**&*7&&$7&*7&&$&&&7*7&7&&*7&*&&*7&&&&&7&&7&$$$*7&**$&&&$&&7$777&77&7&$$*7*$ 5
6² 77$&*$&**7*$*&$*7*7*$*$$7**&&$*$**77&$*&$7&$$7*7&$&$7$&**&&$$**777*&&$&&$$*777*$**$&7&&*&&$&&$**$*&7² 6
5² 77$&*$&**7*$*&$*7*7*$*$$7**&&$*$**77&$*&$7&$$7*7&$&$7$&**&&$$**777*&&$&&$$*777*$**$&7&&*&&$&&$**$*&7 5
5² 77$&*$&**7*$*&$*7*7*$*$$7**&&$*$**77&$*&$7&$$7*7&$&$7$&**&&$$**777*&&$&&$$*777*$**$&7&&*&&$&&$**$*&7 5
5² 77$&*$&**7*$*&$*7*7*$*$$7**&&$*$**77&$*&$7&$$7*7&$&$7$&**&&$$**777*&&$&&$$*777*$**$&7&&*&&$&&$**$*&7 5
6² &&$***&&**7$**&&$$&$*7&&**&*$7*$7$&$*7*&&**$*$&$$² 6
5² &&$***&&**7$**&&$$&$*7&&**&*$7*$7$&$*7*&&**$*$&$$ 5
5² &&$***&&**7$**&&$$&$*7&&**&*$7*$7$&$*7*&&**$*$&$$ 5
5² &&$***&&**7$**&&$$&$*7&&**&*$7*$7$&$*7*&&**$*$&$$ 5
Forward (Sequencing & HRM)
Reverse (Sequencing)
Reverse (HRM)
***
BMC Plant Biology 2009, 9:135 />Page 12 of 16
(page number not for citation purposes)
higher than in rice (0.507 ± 0.048 [41]), soybean (0.52
[36]), and human (0.651 ± 0.016 [40]). It is possible that
the high level of diversity is related to the way that selec-
tion of the 68 accessions was performed. We included die-
back resistant and susceptible material from all
predominant horticultural types, thereby selecting haplo-
types at similar frequencies. It would be interesting to
observe how haplotype diversity changes in different
genomic regions and/or for a different set of accessions.
To test the neutrality of mutations, Tajima's D was calcu-
lated for all surveyed markers. The average D (1.48 ± 0.45
for the coding regions and 1.61 ± 0.56 for whole frag-
ments) was larger than in soybean (1.08 [36]), potato (0.5
[30]), and sorghum (0.30 [34]). A positive D value indi-
cates a deficit of low-frequency alleles relative to what is
expected. Since large D values can be caused by a popula-
tion subdivision [37], it is possible that the presence of
subpopulations in the analyzed set of lettuce accessions
affects both haplotype diversity and the D values. When
neutrality of mutations was tested in individual markers,
three markers closely linked to the Tvr1 gene (< 1.5 cM)
had Tajima's D values significantly higher (p ≤ 0.01) than
expected (Cntg10192 - 2.78, CLSM9959 - 2.72, CLSZ1525
- 3.40). Again, the population structure or selection at the
Tvr1 locus or the marker itself could have caused depar-
tures from neutrality.
Linkage disequilibrium
The decay of LD for the Trv1 region was relatively slow
when measured both within individual markers and
between markers flanking Tvr1. Estimated values of r
2
were ~0.322 at 900 bp, and ~0.124 at 8 cM. A fitted loga-
rithmic curve shows that the r
2
value of 0.2 (often consid-
ered the threshold for estimating the extent of LD) is
reached somewhere between 0.5 cM to 1 cM. LD of SNP
markers observed in some other selfing species was simi-
lar; LD in Arabidopsis was 250 kb or 1 cM [42]) and in
soybean was ~50 kb [36]). Intra-locus LD decayed very lit-
tle in tomato, with the log trend showing r
2
> 0.6 at 900
bp [35]. However, it is problematic to compare decay of
LD across species due to the large variability in LD quan-
tification. LD depends on a combination of many factors,
such as the origin of the population, selected set of acces-
sions, analyzed genomic region, molecular marker sys-
tem, and presence of unidentified subpopulations. Hyten
[43] compared four different soybean populations for lev-
els of LD decline. While in the domesticated Asian G. max
population LD did not decline along the 500 kb
sequenced region, the wild Glycine soja population had a
large LD decline within the LD block size averaging 12 kb.
Comparable observations were not only made in the self-
ing Arabidopsis [44], but also in the outcrossing maize
[31] and aspen [29]. Our results show a large difference
between estimates of LD when analyses were performed
across all horticultural types or within each individual
type. While the estimate of r
2
at a distance of 8 cM was
0.124 for the whole set, it was 0.247 for romaine type and
0.345 for crisphead lettuce. Because only a relatively small
part of the genome was analyzed in the present work, it is
not possible to calculate LD at distances over 8 cM. How-
ever, the trend for the logarithmic curve suggests that LD
could reach more than 15 cM in romaine and probably
more than 25 cM in crisphead types before declining to
the value of r
2
< 0.2. When only iceberg types (a subtype
of crisphead) were included in the analysis, LD was still at
its maximum (r
2
= 1) at a distance of 8 cM (data not
shown). Although these observations come from a lim-
ited number of individuals, they are supported by the fact
that the modern iceberg-type lettuce has an extremely lim-
ited genetic diversity [14,15] that is frequently associated
with extensive LD.
Linkage mapping
A previous study on the Salinas × Iceberg mapping popu-
lation showed that the single, dominant gene (Tvr1)
located on linkage group 2 confers resistance to lettuce
dieback [1]. We confirmed that the gene is located on link-
age group 2 and pinpointed its position with markers
Cntg4252 and Cntg10192. Both of these markers co-seg-
regated with the resistance allele in 192 RILs derived from
the (Valmane × Salinas 88) × Salinas cross. The molecular
linkage map based on the (Valmane × Salinas 88) × Sali-
nas cross showed good colinearity in order of the markers
with the map based on the interspecific cross between cv.
Salinas and L. serriola accessions UC96US23 [18]. How-
ever, the interval from LK1457 to Cntg11275 is more than
twice the size when estimated from the interspecific cross
(11.0 cM and 4.9 cM, respectively). Similarly, while mark-
The differences in shapes of melting curves illustrate the detection of four homoduplexes corresponding to haplo-types R1, R2, R3, and S1Figure 5
The differences in shapes of melting curves illustrate
the detection of four homoduplexes corresponding
to haplotypes R1, R2, R3, and S1. For example, the hap-
lotype R1 was detected in iceberg cv. Salinas, haplotype R2 in
primitive romaine-like accession PI491224, R3 in L. serriola
accession UC96US23, and S1 in romaine cv. Valmaine.
BMC Plant Biology 2009, 9:135 />Page 13 of 16
(page number not for citation purposes)
ers Cntg4252 and Cntg10192 co-segregate in the intraspe-
cific map, they are separated by 1 cM on the interspecific
map, despite the latter being based on fewer RILs. These
values are within the range of other observations on intra-
and interspecific maps of lettuce [45]. Colinearity
between the two maps allows for development of a con-
sensus map that places markers Cntg4252 and Cntg10192
0.5 cM apart.
Association mapping
We identified the genomic region carrying resistance
against dieback and nine markers closely linked with the
Tvr1 gene through linkage analysis. We subsequently used
this information to test the linked markers for association
with the disease resistance on a set of 68 diverse acces-
sions. Eight of the nine markers showed highly significant
association with dieback resistance, consistent with the
Tvr1 gene being located in this region. Although the
threshold for declaring association significant was set at p
< 0.001, most of the associations were significant at p ≤
0.00001. The only exception was marker Cntg4252,
where the most significant association reached only p =
0.0042. The low association between SNPs at this marker
and dieback resistance was somewhat unexpected, since
Cntg4252 co-segregated with the resistance allele in the
(Valmaine × Salinas 88) × Salinas mapping population.
While unexpected, it is not uncommon that markers
closely linked with a trait in a mapping population do not
show association when tested on a set of diverse acces-
sions. This problem is well documented in potato, where
markers linked to the Gro1 and H1 resistance genes in the
mapping population were tested on 136 unrelated culti-
vars. The Gro1-specific marker was not correlated with the
resistance phenotype, while H1-specific marker was indic-
ative of resistance in only four cultivars [46]. A similar
example can be shown for lettuce, where markers most
tightly linked to the cor resistance gene were the least use-
ful for diagnostic when tested in a large collection of cul-
tivars [47]. There are several other examples of markers
tightly linked to resistance genes, but whose use present
problems in material different from the original in which
they were identified [48]. Therefore, an important require-
ment for any molecular marker used in MAS is not just its
applicability in a specific cross, but its association in a
wide gene pool.
From SNPs that were significantly associated with dieback
resistance, the best fit was observed for those located in
marker Cntg10192. This is the second of two markers, the
other being Cntg4252, that co-segregated with the resist-
ance allele in the mapping population. It is intriguing that
one of the two markers co-segregating with the Tvr1 allele
in the mapping population showed no significant associ-
ation in a set of diverse accessions, while the other showed
a perfect match. Although these two markers were not sep-
arated in the intraspecific population, the linkage map
developed from the Salinas × UC96US23 cross indicates
that they are 1 cM apart. Therefore it is possible that test-
ing more RILs from the intraspecific population would
separate the two markers and Tvr1. Association of SNPs
from marker Cntg10192 with the resistance allele was val-
idated in a larger set of 132 diverse accessions from several
horticultural types. The marker-trait association was
observed not only in L. sativa, but also in two L. serriola
accessions included in the study. However, while the sus-
ceptible haplotype is identical in both species (S1), the
resistant haplotypes are different (R1 & R2 in L. sativa, and
R3 in L. serriola). To investigate the relationship between
Tvr1 and the resistance observed in L. serriola, we screened
119 F
8
RILs from the Salinas × UC96US23 population for
resistance to dieback. If Tvr1 and the resistance locus from
UC96US23 were distinct and unlinked, approximately
25% susceptible offspring would be observed. However,
since all RILs were resistant to the disease (data not
shown), we concluded that the resistance locus in
UC96US23 is either allelic or linked to Tvr1. The same
conclusion was reached for the resistance locus in the
primitive romaine-type accession PI491224 [1]. The three
resistance loci are associated with three distinct haplo-
types; resistance in cv. Salinas with R1, in PI491224 with
R2, and in UC96US23 with R3.
Even though all 200 L. sativa accessions from the two test-
ing sets showed the same haplotype-resistance associa-
tion, it is unlikely that the EST from which this marker was
derived is directly involved in dieback resistance. A search
for protein similarity in the NCBI database [49] indicates
that Cntg10192 is similar to the copper ion binding pro-
tein from castorbean (Ricinus communis L., EEF39175.1,
similarity 5e
-49
) and the plastocyanin-like domain-con-
taining protein from Arabidopsis (NP_563820, similarity
5e
-43
). The annotated functions of these two proteins do
not imply an obvious role in plant-pathogen interactions
[50]. Moreover, the two substitutions (at positions 54 and
72) at marker Cntg10192 that are the most significantly
associated with dieback resistance are synonymous, cod-
ing the same amino acid. Assuming that marker
Cntg10192 is not directly involved in the resistance, it is
probable that a recombinant genotype will eventually be
identified. On the other hand, marker-trait associations
can be very strong between some tightly linked alleles. For
example, Rick and Forbes [51] documented linkage
between allozyme Aps
1
and tomato resistance gene Mi that
did not break in as many as 30 backcross generations.
Chromosomal linkage group 2 contains a large cluster of
resistance genes that confer resistance to downy mildew
(Bremia lactucae) (Dm1, Dm3, Dm6, Dm14, Dm15, Dm16,
Dm18) and lettuce root aphid (Ra) [52,53]. However, the
Cntg10192 marker is well separated (> 25 cM) from this
BMC Plant Biology 2009, 9:135 />Page 14 of 16
(page number not for citation purposes)
cluster on the Salinas × UC96US12 map. Moreover, Tvr1
is one of the few resistance genes that was not at a genetic
position coincident with any type of candidate resistance
gene so far mapped in lettuce [52]. Thus, it is possible that
Tvr1 is different from the common types of pathogen rec-
ognition genes.
Using high-resolution DNA melting analysis for marker-
assisted selection
We used HRM to directly detect sequence variations in
PCR amplicons. High-resolution melting curves were
recorded by the slow and steady heating of PCR products
in a LightScanner instrument. Changes in the shape of the
melting curve were then used to identify mutations and
variations. The method worked well for most of the ana-
lyzed markers, however, in a few cases, alleles could not
be distinguished. When this occurred, we applied two
alternative approaches to increase sensitivity through het-
eroduplex formation. In one approach, the heteroduplex
formation was facilitated through mixing of samples prior
to PCR. For example, if one sample contained DNA from
cv. Salinas only, the other one would contain a mix of
DNA (1:1 ratio) from both cv. Salinas and Valmaine. The
second alternative used an unlabeled probe 20 bp to 35
bp long that was designed for the region carrying the SNP.
The probe was included in the PCR mix prior to cycling
but was not consumed during amplification due to 3'
block. Genotyping was accomplished by monitoring the
melting of probe-target duplexes post-PCR as described in
LightScanner manual. Both of the above alternatives
improved allele detection; however, the probe-target
duplex approach appeared to be more sensitive.
Conclusion
Lettuce dieback is a soil-borne viral disease that is one of
the limiting factors for romaine and leaf-type lettuce pro-
duction in California. Currently, there is no method that
effectively reduces, removes, or destroys the virus in
infested soil. Thus the best control of lettuce dieback is
accomplished by using resistant cultivars. However, devel-
opment of resistant cultivars up to now has required
extensive field-based testing. Our identification of a
molecular marker that is tightly linked to the Tvr1 gene
conferring durable resistance will reduce the need for
field-based screening and accelerate development of
resistant cultivars.
A combination of classical linkage mapping and associa-
tion mapping allowed us to pinpoint the location of the
resistance gene on chromosomal linkage group 2. Exami-
nation of the Tvr1 region revealed a relatively high level of
nucleotide polymorphism (for a selfing species) and
extensive linkage disequilibrium. One of the markers
(Cntg10192) flanking the Tvr1 gene showed 100% accu-
racy in detecting resistant and susceptible phenotypes in a
set of 200 L. sativa accessions from all horticultural types
of lettuce and two accessions from L. serriola. A combina-
tion of three SNPs in this EST-based marker identified
four haplotypes. Three of the haplotypes are related to die-
back resistance, while a single haplotype is always associ-
ated with susceptibility to the disease.
Application of high-resolution DNA melting analysis
allowed us to distinguish all four haplotypes of the
Cntg10192 marker in a single assay. Since heterozygous
state is also easily distinguishable by the HRM analysis
(data not shown), we can identify and select homozygous
individuals whose offspring do not segregate for resist-
ance in the following generation. Screening for dieback
resistance with this molecular marker is now part of our
breeding program. Marker-assisted selection with
Cntg10192 is being used to develop improved romaine
and leaf-type cultivars resistant to the disease. In addition,
we are employing the molecular markers to prevent inad-
vertent introgression of the susceptible haplotype into the
iceberg lettuce gene pool.
Data access
Described sequences have been submitted to GenBank
under accession numbers GQ340976
to GQ341571.
List of abbreviations
AFLP: amplified fragment length polymorphism; CGPDB:
Compositae Genome Project Database; cntg (in marker
name): contig; cv.: cultivar; EST: expressed sequence tag;
HRM: high-resolution DNA melting curve analysis; indel:
insertion or deletion; LD: linkage disequilibrium; NCBI:
National Center for Biotechnology Information; PCR:
polymerase chain reaction; RAPD: random amplification
of polymorphic DNA; RIL: recombinant-inbred line; SFP:
single-feature polymorphism; SNP: single-nucleotide pol-
ymorphism; VNTR: variable number tandem repeat.
Authors' contributions
IS designed and coordinated the study, performed pheno-
typic evaluations, carried out statistical analyses of the
data, and prepared the manuscript. DAP developed prim-
ers, performed marker and sequence analysis, and assisted
in drafting the manuscript. LKM, MJT, OEO and RWM
developed mapping populations, provided EST data, and
revised the manuscript. BES carried out sequencing and
revised the manuscript. All authors read and approved the
final manuscript.
Acknowledgements
The authors are grateful to Lisa Lai for the excellent technical assistance
and Jeffrey Skinner (Nunhems USA, Inc.) and William Waycott (Seminis
Vegetable Seeds, Inc.) for critically reviewing the manuscript. We also thank
Gary Higashi for generously providing field space for trials. This project was
supported in part by the California Leafy Greens Research Program.
BMC Plant Biology 2009, 9:135 />Page 15 of 16
(page number not for citation purposes)
References
1. Grube RC, Wintermantel WM, Hand P, Aburomia R, Pink DAC,
Ryder EJ: Genetic analysis and mapping of resistance to let-
tuce dieback: a soilborne disease caused by tombusviruses.
Theor Appl Genet 2005, 110(2):259-268.
2. Obermeier C, Sears JL, Liu HY, Schlueter KO, Ryder EJ, Duffus JE,
Koike ST, Wisler GC: Characterization of distinct tombusvi-
ruses that cause diseases of lettuce and tomato in the west-
ern United States. Phytopathology 2001, 91(8):797-806.
3. Wisler GC, Duffus JE: A century of plant virus management in
the Salinas Valley of California, 'East of Eden'. Virus Res 2000,
71(1-2):161-169.
4. Martelli GP, Gallitelli D, Russo M: Tombusviruses. In The plant
viruses Volume 3. Edited by: Koenig R. New York: Plenum; 1988:13-72.
5. Wintermantel WM, Anchieta AG: Tombusvirus infection of let-
tuce is influenced by soil salinity. Proceedings of the 5th symposium
of the international working group on plant viruses with fungal vectors:
2003; Zurich, Switzerland 2003:131-134.
6. Grube RC, Ryder EJ: Romaine lettuce breeding lines with
resistance to lettuce dieback caused by tombusviruses. Hort-
Science 2003, 38(4):627-628.
7. Jagger IC: The Imperial strains of lettuce. Washington: US
Department of Agriculture; 1941:1-15.
8. Simko I: One potato, two potato: Haplotype association map-
ping in autotetraploids. Trends Plant Sci 2004, 9(9):441-448.
9. Jorde LB: Linkage disequilibrium and the search for complex
disease genes. Genome Res 2000, 10(10):1435-1444.
10. Abdurakhmonov IY, Abdukarimov A: Application of association
mapping to understanding the genetic diversity of plant
germplasm resources. Int J Plant Genomics 2008, 2008:574927.
11. Simko I, Costanzo S, Haynes KG, Christ BJ, Jones RW: Linkage dis-
equilibrium mapping of a Verticillium dahliae resistance quan-
titative trait locus in tetraploid potato (Solanum tuberosum)
through a candidate gene approach. Theor Appl Genet 2004,
108(2):217-224.
12. Simko I, Haynes KG, Ewing EE, Costanzo S, Christ BJ, Jones RW:
Mapping genes for resistance to
Verticillium albo-atrum in
tetraploid and diploid potato populations using haplotype
association tests and genetic linkage analysis. Mol Genet
Genomics 2004, 271(5):522-531.
13. Pritchard JK, Rosenberg NA: Use of unlinked genetic markers to
detect population stratification in association studies. Am J
Hum Genet 1999, 65(1):220-228.
14. Simko I: Development of EST-SSR markers for the study of
population structure in lettuce (Lactuca sativa L.). J Hered
2009, 100(2):256-262.
15. Simko I, Hu J: Population structure in cultivated lettuce and its
impact on association mapping. J Am Soc Hortic Sci 2008,
133(1):61-68.
16. Rozen S, Skaletsky HJ: Primer3 on the WWW for general users
and for biologist programmers. In Methods Mol Biol Volume 132.
Edited by: Krawetz S, Misener S. Totowa, NJ: Humana Press;
2000:365-386.
17. Compositae Genome Project Database [http://
cgpdb.ucdavis.edu]
18. Johnson WC, Jackson LE, Ochoa O, van Wijk R, Peleman J, St. Clair
DA, Michelmore RW: Lettuce, a shallow-rooted crop, and Lac-
tuca serriola, its wild progenitor, differ at QTL determining
root architecture and deep soil water exploitation. Theor Appl
Genet 2000, 101(7):1066-1073.
19. Manly KF, Cudmore RH Jr, Meer JM: Map Manager QTX, cross-
platform software for genetic mapping. Mamm Genome 2001,
12(12):930-932.
20. Barrett JC, Fry B, Maller J, Daly MJ: Haploview: analysis and visu-
alization of LD and haplotype maps. Bioinformatics 2005,
21(2):263-265.
21. Bradbury PJ, Zhang Z, Kroon DE, Casstevens TM, Ramdoss Y, Buck-
ler ES: TASSEL: Software for association mapping of complex
traits in diverse samples. Bioinformatics 2007, 23(19):2633-2635.
22. Falush D, Stephens M, Pritchard JK: Inference of population struc-
ture using multilocus genotype data: Dominant markers and
null alleles. Mol Ecol Notes 2007, 7(4):574-578.
23. Evanno G, Regnaut S, Goudet J: Detecting the number of clusters
of individuals using the software STRUCTURE: A simulation
study. Mol Ecol 2005, 14(8):2611-2620.
24. Watterson GA: Number of segregating sites in genetic models
without recombination. Theor Popul Biol 1975, 7(2):256-276.
25. Tajima F: Evolutionary relationship of DNA-sequences in
finite populations. Genetics 1983, 105(2):437-460.
26. Tajima F: Statistical method for testing the neutral mutation
hypothesis by DNA polymorphism. Genetics 1989,
123(3):585-595.
27. Rozas J, Rozas R: DnaSP version 3: an integrated program for
molecular population genetics and molecular evolution anal-
ysis. Bioinformatics 1999, 15(2):174-175.
28. Stam P: Construction of integrated genetic linkage maps by
means of a new computer package: JOINMAP.
Plant J 1993,
3(5):739-744.
29. Ingvarsson PK: Nucleotide polymorphism and linkage disequi-
librium within and among natural populations of European
aspen (Populus tremula L., salicaceae). Genetics 2005,
169(2):945-953.
30. Simko I, Haynes KG, Jones RW: Assessment of linkage disequi-
librium in potato genome with single nucleotide polymor-
phism markers. Genetics 2006, 173(4):2237-2245.
31. Tenaillon MI, Sawkins MC, Long AD, Gaut RL, Doebley JF, Gaut BS:
Patterns of DNA sequence polymorphism along chromo-
some 1 of maize (Zea mays ssp mays L.). Proc Natl Acad Sci USA
2001, 98(16):9161-9166.
32. Schneider K, Weisshaar B, Borchardt DC, Salamini F: SNP fre-
quency and allelic haplotype structure of Beta vulgaris
expressed genes. Mol Breed 2001, 8(1):63-74.
33. Nasu S, Suzuki J, Ohta R, Hasegawa K, Yui R, Kitazawa N, Monna L,
Minobe Y: Search for and analysis of single nucleotide poly-
morphisms (SNPs) in rice (Oryza sativa, Oryza rufipogon) and
establishment of SNP markers. DNA Research 2002,
9(5):163-171.
34. Hamblin MT, Mitchell SE, White GM, Gallego W, Kukatla R, Wing RA,
Paterson AH, Kresovich S: Comparative population genetics of
the panicoid grasses: Sequence polymorphism, linkage dise-
quilibrium and selection in a diverse sample of Sorghum
bicolor. Genetics 2004, 167(1):471-483.
35. Labate JA, Robertson LD, Baldo AM: Multilocus sequence data
reveal extensive departures from equilibrium in domesti-
cated tomato (Solanum lycopersicum L.). Heredity 2009,
103(3):257-67.
36. Zhu YL, Song QJ, Hyten DL, Van Tassell CP, Matukumalli LK, Grimm
DR, Hyatt SM, Fickus EW, Young ND, Cregan PB: Single-nucle-
otide polymorphisms in soybean. Genetics 2003,
163(3):1123-1134.
37. Ching A, Caldwell KS, Jung M, Dolan M, Smith OS, Tingey S, Morgante
M, Rafalski AJ: SNP frequency, haplotype structure and linkage
disequilibrium in elite maize inbred lines. BMC Genet 2002,
3(1):19.
38. Pollak E: On the theory of partially inbreeding finite popula-
tions .1. Partial selfing. Genetics 1987, 117(2):353-360.
39. Nei M: Molecular evolutionary genetics. New York: Columbia
University Press; 1987.
40. Beaty TH, Fallin MD, Hetmanski JB, McIntosh I, Chong SS, Ingersoll R,
Sheng X, Chakraborty R, Scott AF: Haplotype diversity in 11 can-
didate genes across four populations. Genetics 2005,
171(1):259-267.
41. Garris AJ, Tai TH, Coburn J, Kresovich S, McCouch S: Genetic
structure and diversity in Oryza sativa L. Genetics 2005,
169(3):1631-1638.
42. Nordborg M, Borevitz JO, Bergelson J, Berry CC, Chory J, Hagenblad
J, Kreitman M, Maloof JN, Noyes T, Oefner PJ, et al.: The extent of
linkage disequilibrium in Arabidopsis thaliana. Nat Genet 2002,
30(2):190-193.
43. Hyten DL, Choi IY, Song Q, Shoemaker RC, Nelson RL, Costa JM,
Specht JE, Cregan PB: Highly variable patterns of linkage dise-
quilibrium in multiple soybean populations. Genetics 2007,
175(4):1937-1944.
44. Nordborg M, Hu TT, Ishino Y, Jhaveri J, Toomajian C, Zheng H,
Bakker E, Calabrese P, Gladstone J, Goyal R, et al.: The pattern of
polymorphism in Arabidopsis thaliana. PLoS Biol 2005,
3(7):e196.
45. Truco MJ, Antonise R, Lavelle D, Ochoa O, Kozik A, Witsenboer H,
Fort SB, Jeuken MJW, Kesseli RV, Lindhout P, et al.: A high-density,
integrated genetic linkage map of lettuce (Lactuca spp.).
Theor Appl Genet 2007, 115(6):735-746.
Publish with BioMed Central and every
scientist can read your work free of charge
"BioMed Central will be the most significant development for
disseminating the results of biomedical research in our lifetime."
Sir Paul Nurse, Cancer Research UK
Your research papers will be:
available free of charge to the entire biomedical community
peer reviewed and published immediately upon acceptance
cited in PubMed and archived on PubMed Central
yours — you keep the copyright
Submit your manuscript here:
/>BioMedcentral
BMC Plant Biology 2009, 9:135 />Page 16 of 16
(page number not for citation purposes)
46. Niewöhner J, Salamini F, Gebhardt C: Development of PCR
assays diagnostic for RFLP marker alleles closely linked to
alleles Gro1 and H1, conferring resistance to the root cyst-
nematode Globodera rostochiensis in potato. Mol Breed 1995,
1(1):65-78.
47. Moreno-Vázquez S, Ochoa OE, Faber N, Chao S, Jacobs JME, Maison-
neuve B, Kesseli RV, Michelmore RW: SNP-based codominant
markers for a recessive gene conferring resistance to corky
root rot (Rhizomonas suberifaciens) in lettuce (Lactuca
sativa). Genome 2003, 46(6):1059-1069.
48. Lawson WR, Goulter KC, Henry RJ, Kong GA, Kochman JK:
Marker-assisted selection for two rust resistance genes in
sunflower. Mol Breed 1998, 4(3):227-234.
49. National Center for Biotechnology Information [http://
www.ncbi.nlm.nih.gov]
50. Redinbo MR, Yeates TO, Merchant S: Plastocyanin: structural
and functional analysis. J Bioenerg Biomembr 1994, 26(1):49-66.
51. Rick CM, Forbes JF: Association of an allozyme with nematode
resistance. Rep Tomato Genet Cooper 1974, 24:25.
52. McHale LK, Truco MJ, Kozik A, Wroblewski T, Ochoa OE, Lahre KA,
Knapp SJ, Michelmore RW: The genomic architecture of disease
resistance in lettuce. Theor Appl Genet 2009, 118(3):565-580.
53. Meyers BC, Chin DB, Shen KA, Sivaramakrishnan S, Lavelle DO,
Zhang Z, Michelmore RW: The major resistance gene cluster in
lettuce is highly duplicated and spans several megabases.
Plant Cell 1998, 10(11):1817-1832.