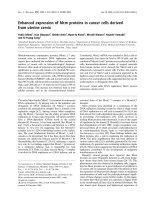
báo cáo khoa học: " The origin of populations of Arabidopsis thaliana in China, based on the chloroplast DNA sequences" docx
Bạn đang xem bản rút gọn của tài liệu. Xem và tải ngay bản đầy đủ của tài liệu tại đây (3.86 MB, 16 trang )
RESEARC H ARTIC LE Open Access
The origin of populations of Arabidopsis thaliana
in China, based on the chloroplast DNA
sequences
Ping Yin
1
, Juqing Kang
1
, Fei He
1
, Li-Jia Qu
1,2
, Hongya Gu
1,2*
Abstract
Background: In the studies incorporating worldwide sampling of A. thaliana populations, the samples from East
Asia, especially from China, were very scattered; and the studies focused on global patterns of cpDNA genetic
variation among accessions of A. thaliana are very few. In this study, chloroplast DNA sequence variability was used
to infer phylogenetic relationships among Arabidopsis thaliana accessions from around the world, with the
emphasis on samples from China.
Results: A data set comprising 77 accessions of A. thaliana, including 19 field-collected Chinese accessions
together with three related species (A. arenosa, A. suecica, and Olimarabidopsis cabulica) as the out-group, was
compiled. The analysis of the nucleotide sequences showed that the 77 accessions of A. thaliana were partitioned
into two major differentiated haplotype classes (MDHCs). The estimated divergence time of the two MDHCs was
about 0.39 mya. Forty-nine haplotypes were detected among the 77 accessions, which exhibited nucleotide
diversity (π) of 0.00169. The Chinese populations along the Yangtze River were characterized by five haplotypes,
and the two accessions collected from the middle range of the Altai Mountains in China shared six specific
variable sites.
Conclusions: The dimorphism in the chloroplast DNA could be due to founder effects during late Pleistocene
glaciations and interglacial periods, although introgression cannot be ruled out. The Chinese populations along the
Yangtze River may have dispersed eastwards to their present-day locations from the Himalayas. These populations
originated from a common ancestor, and a rapid demographic expansion began approximately 90,000 years ago.
Two accessions collected from the middle range of the Altai Mountains in China may have survived in a local
refugium during late Pleistocene glaciations. The natural popul ations from China with specific genetic
characteristics enriched the gene pools of global A. thaliana collections.
Background
Arabidopsis thaliana (L.) Heynh is an annual weed
belonging to the family Brassicaceae (Cruciferae). The
species is nati ve to Europe and Central Asia, but is now
widely distributed in the Northern Hemisphere ranging
from 68°N (northern Scandinavia) to Equator (moun-
tains of Tanzania and Kenya) [1]. Many characteristics,
from morphological traits to protei n and DNA markers,
have been used to evaluate natural genetic variation
among populations, and to reconstruct an intraspecific
phylogeny, for A. thaliana (for example, [2-9]). It has
been found t hat many nuclear genes comprise two or
more major differentiated h aplotypes, generally referred
to as allelic dimorphism [10-20]. Balancing selection or
ancient population subdivision was often invoked to
explain the pattern. The major mechanisms for balan-
cing selection are heterozygote advantage, frequency-
dependent selection, or environmental heterogeneity. It
is well known that A. thaliana has an inbreeding mating
system. The estimated outcrossing rate of the species is
1% or less [21]. It seems difficult to imagine that so
many loci in A. thaliana have experienced balancing
selection via heterozygote advantage [22]. Therefore,
* Correspondence:
1
National Laboratory of Protein Engineering and Plant Genetic Engineering,
Peking-Yale Joint Center for Plant Molecular Genetics and
AgroBiotechnology, College of Life Sciences, Peking University, Beijing
100871, China
Yin et al. BMC Plant Biology 2010, 10:22
/>© 2010 Yin et al; licensee BioMed Central Ltd. This is an Open Access article distributed under the terms of the Creative Commons
Attribution License ( which permits unrestricted use, distribution, and reproduction in
any medium, provided the original work is properly cited.
frequency-dependent selection and/or diversifying selec-
tion might be the driving forces for the dimorphism
phenomenon, as in the case of pathogen resistance (R)
genes [17,18,23]. It is not clear yet if the dimorp hism
also exists in the chloroplast genome.
The chloroplast genome of A. thaliana is a circular
DNA composed of 154,478 bp with a pair of inverted
repeats of 26,264 bp separated by small and large single-
copy regions of 17,780 bp and 84,170 bp, respectively
[24]. The uniparentally inherited chloroplast genome has
been utilized in many studies in plant population and
evolutionary genetics. However, studies focused on global
patterns of cpDNA genetic variation among accessions of
A. thaliana are scatte red. In an investigation on the
maternal origins of A. suecica,12cpDNAregionswere
sequenced for 25 A. thaliana accessions, which were
mainly collected from Scandinavia [25]. These authors
found considerable variation existed among the non-cod-
ing single-copy se quences in the c hloroplast genome of
A. thaliana. In another study, the trnL-trnF cpDNA
intergenic spacer region of 475 individuals from 167 A.
thaliana populations in its native range was sequenced
and 16 haplotypes were identified [8]. Based on the chlor-
oplast and nuclear DNA sequence data, Beck et al pro-
posed the Caucasian area as the possible ancestral area of
A. thaliana, and suggested four possibilities for the origin
of East Asian populations. They also found that the
maternal components of A. suecica shared a high similar-
ity to t hose in the Asian metapopulation of A. thaliana,
especially to those from China [8].
In the studies incorporating worldwide sampling of A.
thaliana populations, the samples from East Asia wer e
very scattered. He et al conducted a study on the
genetic diversity of 19 natural Arabidopsis thaliana
populati ons in China based on ISSR and RAPD makers,
and found that about 42-45% of the total genetic varia-
tion existed within populations and there was a signifi-
cant correlation between geographic distance and
genetic distance [7]. However, the phylogenetic relation-
ships of Chinese populations with those distributed in
other regions of the world, and the history of population
dispersal in this region, are not clear.
The goals of the present survey are: (1) to examine
global patterns of cpDNA g enetic variation in A. thali-
ana; (2) to infer phylogenetic relationships among A.
thaliana accessions f rom all over the world based on
cpDNA sequence data, with particular focus on Chinese
populations; and (3) to discuss the possible origin(s) of
the Chinese populations. It was found in this study that
dimorphism did exist in the chloroplast genome of A.
thaliana; the 77 accessions studied were grouped into
two major clusters; and the Chinese populations might
have two independent origins.
Results
Nucleotide variation in the chloroplast DNA sequences
Seventy-seven A. thaliana accessions were used in the
survey, among them 19 accessions were field collected
in China (Table 1). All sampling locations in China
were separated by at least 50 km, with most of the loca-
tions separated by more than 300 km (Figure 1, Table
2). No cp DNA polymorphism was detected within
either accession AHyxx or Abd-0, therefore only one
individual was chosen for each accession for DNA
sequence analysis. About 10600 nucleotides from the
chloroplast genome were amplified and sequenced for
each accession, of which 8750 nucleotides of non-coding
fragments were retained for analysis.
The combined data matrix contained 149 variable
nucleotide sites. Among them, 21 were mononucleotide
repeat polymorphisms, one was a dinucleotide repeat
polymorphism, and four were compli cated length varia-
tions. These 26 length polymorphisms were excluded in
the analyses. The other 123 polymorphic variations
comprised 95 single nucleotide polymorphisms (SNPs),
26 insertion/deletion events (indels) and two small frag-
ment inversions. Only one site exhibited three-base
polymorphism and the other 122 sites showed two-base
polymorphism (Figure 2).
The two small fragmental inversions were located at
sites 3633-3637 (Inversion 1) and sites 6501-6509
(Inversion 2). The characteristics of this kind of rever-
sion were: (1) a central region of 5 nt (TTACT in the
Inversion1ofCol-0)or9nt(AGTAGAATAinthe
Inversion 2 of Col-0), which could mutate to its rev erse
complement sequence (AGTAA and TATTCTACT,
respectively); and (2) two flanking sequences of 18 nt
(Inversion 1) or 20 nt (Inversion 2), respectively (Figure
3). The two flanking sequence s could be reversely com-
plemented to each other. It is most likely that each of
these two small fragmental inversions could be gener-
ated by only one or very few mutation event(s), but it
resulted in multiple SNPs.
Nucleotide diversity (π )fortheentiresequenced
regions was 0.00169, but ranged from 0.00010 for the
ycf3-trnS intergenic spacer (primer pair 4) to 0.01053
for psaJ-rpl33 (primer pair 9) (Table 3).
Less frequent nucleotide polymorphisms (such as sin-
gleton or doubleton) were in excess for the sequenced
regions. Singletons were found at a very high frequency:
44 among the 95 SNPs and 10 among the 26 indels
were singletons (Figure 2). The excess of low-frequency
polymorphisms resulted in negative Tajima’sD,Fuand
Li’s D* and F* values for most of the sequenced seg-
ments; for example, 10 out of 11 Tajima’s D values, nine
out of 11 Fu and Li’s D* values and 10 out of 11 Fu and
Li’ s F* values were negative (Table 3). The values for
Yin et al. BMC Plant Biology 2010, 10:22
/>Page 2 of 16
the combined data matrix were -1.17234 (Tajima’sD,P
> 0.10), -2.36692 (Fu and Li’s D*, P < 0.05) and -2.25760
(Fu and Li’ s F*, 0.10 > P > 0.05, critical). When Fu and
Li’s D and F tests were conducted using the A. arenosa
ortholog as the reference sequence, similar results were
obtained: e ight out of 11 Fu and Li’s D values and nine
out of 11 Fu and Li’s F values were negative and for the
combined data matrix; both the values were negative
(-2.06178 and -2.00798, respectively, 0.10 > P >0.05;
Table 3).
In total, we identified three types of nucleotide varia-
tions among the aligned sequences: SNPs, length poly-
morphism s (including indels), and two small fragmental
inversions.
Phylogenetic relationships among the accessions
Because the single base changes in the two short
inverted regions were not independent events, they were
excluded from the phylogenetic analysis. Two distinct
clusters with high bootstrap values were r etrieved in the
NJ tree. One cluster included 42 acce ssions and the
other included 35 acc essions (Figure 4). Although the
topology of the MP tree differed to that of the NJ tree,
one branch with 35 accessions corresponded to one of
the two clusters in the NJ tree (Figure 5). In general, no
significant correlation was detected between geographi-
cal origins and clusterings in the phylogenetic trees.
Accessions from the same country, such as four acces-
sions from Italy (Bl-1, Ct-1, Mr-0 a nd Sei-0) and five
accessions from USA (Berkeley, BG1, Col-0, FM10 and
HS10) failed to cluster together, but were scatte red on
different branches. This lack of phylogeographic struc-
ture conforms to the hypothesis of a rapid recent expan-
sion of the species with strong involvement of human-
mediated migrations [1].
Although there was incongruence between the two
phylogenies, the topological relationship was relatively
stable among a large number o f accessions. We identi-
fied four stable branches in both trees (A, B, D, and E
inFigures4and5).Theonlymajordifferencewasin
branch C. It was placed within one of the two clusters
in the NJ tree, but formed a deep polytonous branch in
the MP tree, containing the same accessions except Cvi-
0, an accession from Cape Verde Island. The branches
A-E comprised 61 out of the 77 accessions.
Figure 1 Distribution map of the 19 accessions of Arabidopsis thaliana from China and one from India (Kas-2). Solid circles indicate the
locations where samples were collected.
Yin et al. BMC Plant Biology 2010, 10:22
/>Page 3 of 16
Discrimination of two major differentiated haplotypes
among A. thaliana accessions
When only the parsimony-informative sites were consid-
ered, the nucleotide variation of the 77 accessions was
structured into two major different haplotype classes
(MDHCs, Figure 6). The MDHC-I and MDHC-II classes
were composed of 42 and 35 accessions, respectively, and
they corresponded well to the two clusters in the NJ tree.
The MDHC-I and MDHC-II classes differed at five
nucleotide sites (C to G at site 3129, T to C at site 3703, G
to T at site 4304, G to T at site 5379, and T to G at site
6777; Figure 2), and these sites were within a fragment
about 20 kb long from trnL to rpl33 in the chloroplast
genome.
For interspecific comparison, the homologous sequences
of three related species, Olimarabidopsis cabulica, A. are-
nosa and A. suecica, were aligned with the 77 A. thaliana
accessions. They were identical to those in MDHC-II of A.
Table 1 List of the A. thaliana accessions used in this study
Name Accession no. * Geographic Origin Name Accession no. * Geographic Origin
1 9481 N22458 Kazakhstan 39 KZ10 N22442 Kazakhstan
2 Aa-0 N934 Germany 40 La-0 N1298 Poland
3 Abd-0 CS932 UK 41 Lc-0 CS6769 Scotland
4 Ag-0 N936 France 42 Lip-0 N1336 Poland
5 Al-0 N940 Denmark 43 Mr-0 N1372 Italy
6 Alc-0 N1656 Spain 44 Ms-0 N905 Russia
7 Ang-0 N948 Belgium 45 Mt-0 N1380 Libya
8 Anholt-1 CS22313 Germany 46 N1 N22479 Russia
9 Ba-1 N952 UK 47 Ost-0 N1430 Sweden
10 Berkeley N8068 USA 48 Per-2 N1448 Russia
11 BG1 N22341 USA 49 Pi-0 N1454 Austria
12 Bl-1 CS6615 Italy 50 Pog-0 N1476 Canada
13 Blh-1 N1030 Czech Republic 51 Rubezhnoe-1 N927 Ukraine
14 Bs-1 N996 Switzerland 52 Sei-0 N1504 Italy
15 Bur-0 N1028 Ireland 53 Sorbo N931 Tajikistan
16 Bus-0 N1056 Norway 54 Ta-0 N1548 Czech Republic
17 Cal-0 N1062 UK 55 Te-0 CS6918 Finland
18 Can-0 N1064 Spain 56 Tsu-0 N1564 Japan
19 Cha-0 N1068 Switzerland 57 Wassilewskija N915 Russia
20 Chi-0 N1072 Russia 58 Wil-1 N1594 Lithuania
21 Col-0 N1092 USA 59 XJalt PKU101 China
22 Ct-1 N1094 Italy 60 XJqhx PKU102 China
23 Cvi-0 N1096 Cape Verde Island 61 CQbbq PKU304 China
24 Eil-0 N1132 Germany 62 CQtlx PKU305 China
25 Es-0 N1144 Finland 63 GSwex PKU306 China
26 Est-0 N1148 Previous USSR 64 GZyjx PKU603 China
27 FM10 N22391 USA 65 HNylx PKU602 China
28 For-1 N1164 UK 66 HNzjj PKU601 China
29 Gr-3 N1202 Austria 67 SXcgx PKU308 China
30 Gy-0 N1216 France 68 SXmix PKU307 China
31 Hi-0 N1226 Netherlands 69 AHthx PKU218 China
32 Hirokazu N3963 Japan 70 AHyxx PKU219 China
Tsukaya 71 HBhax PKU309 China
33 HR14 N22213 UK 72 HBwcq PKU303 China
34 HS10 N22354 USA 73 JSnjs PKU301 China
35 Ita-0 CS1244 Morocco 74 JXjgs PKU210 China
36 Kas-1 CS903 India 75 JXnfx PKU207 China
37 Kas-2 CS1264 India 76 ZJdys PKU205 China
38 Kn-0 N1286 Lithuania 77 ZJjds PKU201 China
*Accession no. begun with ‘N’ were obtained from the Nottingham Arabidopsis Stock Center (NASC); with ‘CS’ were obtained from the Arabidopsis Biological
Resource Center (ABRC); with “PKU” were field collected in China and their detailed information is listed in Table 2.
Yin et al. BMC Plant Biology 2010, 10:22
/>Page 4 of 16
thaliana at all five nucleotide sites where the two MDHCs
could be distinguished from each other (Figure 7).
All the sites except the inverted length variants were
used to form a binary data set for haplotype network
analysis. Forty-nine haplotypes were identified in the 77
accessions of A. thaliana. The 49 haplotypes were also
bifurcated to form two haplogr oups (Figure 8). Hap-
logroup 1 (21 haplotypes) and Haplogroup 2 (28 haplo-
types) differed at the same five sites (3129, 3703, 4304,
5379 and 6777) where MDHC-I and -II differed, and
the accessions in Haplogroup 1 and Haplogrou p 2 were
identical to those in MDHC-I and -II, respectively.
Estimated divergence time for MDHC-I and MDHC-II, and
demographic expansion of a monophyletic group of
accessions in Asia
The K value between A. arenosa and 77 A. thaliana
accessions was 0.0280 ± 0.0037. Using Equation 1, the
substitution rate per nucleotide site per year for the
sequenced chloroplast regions was 2.8 × 1 0
-9
.TheK
value between MDHC-I and MDHC-II was 0.0022 ±
0.0005. Therefore, the estimated divergence time for
MDHC-I and MDHC-II was estimated (using Equation
2) to be about 0.39 ± 0.09 mya.
Although no significant correlation was detected
between geographic origin and genetic distance, the 17
accessions collected along the Yangtze River, China, were
always clustered together with Kas-2, an accession from
Kashmir (74°E, 34°N) in both NJ and MP trees (Figures 4
and 5). In the network analysis, they congregat ed closely
and formed a distinct cluster (Cluster A) in Haplogroup 1
(Figure 8). The level of nucleotide polymorphism of the 18
accessions was very low (π = 0.00030), only six haplotypes
(h) were detected (five specific in the 17 accessions along
the Yangtze River) and haplotype diversity (Hd) was 0.778.
In comparison, the values of π, h and Hd for the 77 acces-
sions were 0.00169, 49 and 0.977, respectively.
To test the model of demographic population growth in
the region from which the 18 accessions were sampled,
especially for the 17 accessions along the Yangtze River, a
mismatch distribution analysis was conducted. Each small
fragment inversion was treated as a SNP in the analysis.
The SSD between the observed and expected mismatch
distribution was 0.093 (P = 0.062) and HRag was 0.300 (P
= 0.022). There was an only marginally significant differ-
ence in SSD between the observed and the predicted pair-
wise difference distr ibution und er the sudden-expansion
model. This result provided evidence of rapid population
expansion along the Yangtze River. The average τ-value
was 4.521 (95% confidence intervals: 0.684~8.197). The
initial time when the populations expanded along the
Yangtze River were calculated using Equation 4 to obtain
u (2.52 × 10
-5
), and then using Eq uation 3 to obtain t
(0.897 × 10
5
). Therefore, the initial time of expansion was
estimated to be about 90,000 years ago.
Discussion
The level and pattern of nucleotide variation in the
sequenced chloroplast regions
The π value of the sequenced chloroplast regions among
global samples of A. thaliana accessions was 0.00169,
Table 2 Geographic information for the 19 accessions collected from China
Name Location Latitude and longitude Altitude (m)
XJalt Xinjiang, Aletaishi 47°46’ 72” N 88°20’ 64” E 830
XJqhx Xinjiang, Qinghexian 46°48’ 72” N 90°20’ 39” E 1400
CQbbq Chongqing, Beibeiqu 29°47’ 41” N 106°28’ 64” E 184
CQtlx Chongqing, Tongliangxian 29°49’ 40” N 106°03’ 38” E 263
GSwex Gansu, Wenxian 32°43’ 30” N 105°07’ 21” E 650
GZyjx Guizhou, Yinjiangxian 27°56’ 64” N 108°36’ 49” E 800
HNylx Hunan, Yuanlingxian 28°31’ 23” N 110°43’ 13” E 200
HNzjj Hunan, Zhangjiajie 29°24’ 45” N 110°26’ 33” E 500
SXcgx Shanxi, Chengguxian 32°55’ 93” N 107°12’ 65” E 607
SXmix Shanxi, Mianxian 33°08’ 82” N 106°44’ 72” E 532
AHthx Anhui, Taihuxian 30°27’ 80” N 117°17’ 79” E 120
AHyxx Anhui, Yuexixian 30°42
’ 89” N 116°15’ 33” E 600–800
HBhax Hubei, Honganxian 31°16’ 70” N 115°01’ 11” E 100
HBwcq Hubei, Wuchangqu 30°31’ 32” N 114°28’ 16” E70
JSnjs Jiangsu, Nanjingshi 32°03’ 12” N 118°49’ 93” E60
JXjgs Jiangxi, Jinggangshan 26°44’ 78” N 114°17’ 98” E 390
JXnfx Jiangxi, Nanfengxian 26°59’ 18” N 116°14’ 51” E 360
ZJdys Zhejiang, Dongyangshi 29°05’ 02” N 120°25’ 65” E 290
ZJjds Zhejiang, Jiandeshi 29°32’ 13” N 119°29’ 61” E 100
Yin et al. BMC Plant Biology 2010, 10:22
/>Page 5 of 16
which is about one-quarte r of that of the mean nucleo-
tide diver sity of the nuclear genes in A. thaliana [1], but
double that in another study by Sall et al [25], in which
12 non-coding single-copy cpDNA regions were
sequenced f or 25 A. thaliana accession s (π = 0.00061).
Thedifferencesmaybeduetothedifferentsampling
strategies. The 25 A. thaliana accessions in the latter
study were mainly collected from Scandinavia, whereas
the 77 accessions in the present study were sampled
worldwide. For a highly self-fertilizing species, geogra-
phical structure may play an important role on a smaller
scale in the level of polymorphism, at least for the uni-
parentally inherited chloroplast genome. For example,
the π value reduced to 0.00030 if only 18 accessions in
branch A (Kas-2 and 17 accessions along the Yangtze
River) were considered.
Inversions in the chloroplast genome exist in monoco-
tyledonous plants and the Asteraceae. The length of
these inversions range from 0.5 to 28 kb, and all have
phylogenetic implications [26,27]. The length of the
inversions found in the present study were much
shorter, only about 18-20 bp. The accessions with inver-
sions were found mostly scattered on branches B, D, E
in the NJ and MP trees. The exception is in branch A,
where all accessions had inversion 2. The mechanism
responsible for these inversions is not known, but they
might have originated several times during the popula-
tion expansion process. Therefore, it is advisable not to
consider them for phylogenetic analysis.
Dimorphism in the chloroplast DNA of A. thaliana
Two significantly differentiated haplotype classes could
be identified in the sequenced chloroplast DNA regions,
Figure 2 The 123 polymorphic v ariations in the combined data matrix.Inthe“Type of Change”,S=singletonsite;P=parsimony
informative site. The numbers in the “Site” denote the nucleotide sites at which the variations occurred in the combined data matrix. In the first
row of the data matrix, the capital letters indicate the nucleotides in Col-0, a minus sign (-) indicates a deletion whereas a plus sign (+) indicates
an insertion in certain accession(s) relative to Col-0, * and @ indicate the sites which two small fragment inversions were located. In the data
matrix, # d = deletion of # nt; # i = insertion of # nt; I = inversion relative to the first sequence (Col-0), and a dot indicates the same nucleotide
as in the first sequence (Col-0).
Yin et al. BMC Plant Biology 2010, 10:22
/>Page 6 of 16
just as in the allelic dimo rphism found in some nuclear
DNA sequences of A. thaliana. At least three different
interpretations have been proposed to explain the
nuclear dimorphism phenomenon. First, balanced poly-
morphisms were usually the mutations maintained in
populations b y natural selection through heterozygotic
advantage [17,28]. T he chloroplast genome is maternally
inherited in A. thaliana, and the DNA regions selected
for analysis in this study are i ntergenic regions. There-
fore, the dimorphism found in the chloroplast may not
be caused by balancing selection via heterozygotic
advantage. Furthermore, in our investigation, the value
of the Tajima’ s D-value was negative. A negative Taji-
ma’ sDvalueisageneralfeatureoftheArabidopsis
thaliana genome [29], and is correlated to demographic
factors, such as population growth [30], rather than
non-neutral forces such as selection [8].
A second explanation for the nuclear dimorphism is
that introgression might result in the allelic dimorphism.
Chloroplast DNA introgression has been widely
reported [e.g., [31,32]]. In this study, we found that two
related species, Olimarabidopsis cabulica and A. are-
nosa, had all five identical nucleotide site variations with
MDHC-II of A. thaliana,whichwerethe‘markers’ to
separate MDHC-II from MDHC-I. However, the K
values between O. cabulica and the 77 accessions of A.
thaliana,andbetweenA. arenosa and the 77 A. thali-
ana accessions, are 0.0395 and 0.0280, respectively,
Figure 3 Two inversions found in cp-genome of A. thaliana. The dots denote the same nucleotides as in Col-0. The two franking sequences
are reversely complemented to each other but maintain invariable in all accessions studied (except for Pog-0) whereas the central part may
mutate to its reverse complementary sequence.
Table 3 Nucleotide diversity (π) and the results of neutral mutation hypothesis tests for the 11 fragments data sets
Primer No. π Tajima’s
D
Fu and Li’s D* Fu and Li’s F* Fu and Li’s D Fu and Li’sF
1 0.0017 -1.4447 NS -1.6261 NS -1.8451 NS 0.0183 NS -0.4667 NS
2 0.0014 -1.1220 NS -2.6973* -2.5490* -2.4816* -2.3338*
3 0.0010 -1.4093 NS 0.0316 NS -0.5085 NS 1.0701 NS 0.3136 NS
4 0.0001 -1.8133* -3.7112** -3.6475** -3.7960** -3.7259**
5 0.0027 -0.2615 NS -0.4679 NS -0.4713 NS -0.4989 NS -0.4973 NS
6 0.0021 -0.8466 NS 0.0413 NS -0.3111 NS 0.0244 NS -0.3331 NS
7 0.0017 -0.6747 NS -1.0450 NS -1.0878 NS -1.0991 NS -1.1344 NS
8 0.0015 -1.1267 NS -0.3436 NS -0.7422 NS -0.3861 NS -0.7901 NS
9 0.0105 1.26884 NS -0.4650 NS 0.1805 NS -0.2106 NS 0.3956 NS
10 0.0003 -2.18989** -3.9879** -3.9933** -4.1744** -4.1512**
11 0.0012 -1.4249 NS -1.8752 NS -2.0389NS
a
-1.1622 NS -1.4037 NS
Comb. 0.0017 -1.1723 NS -2.3669* -2.2576NS
a
-2.0618NS
a
-2.0080NS
a
NS = Not significant and P > 0.10
NS
a
= Not significant but 0.10 > P > 0.05
*P<0.05
** P < 0.02
Yin et al. BMC Plant Biology 2010, 10:22
/>Page 7 of 16
whereas that between the two MDHCs of A. thaliana is
only 0.0022. The interspecific genetic distance is at least
one order of magnitude higher than intraspecific genetic
distances. The estimated divergence time between O.
cabulica and A. thaliana is about 10~14 mya, and that
between A. arenosa and A. thaliana is about 3.0~5.8
mya [33]. The genetic distances based on cpDNA
between these species pairs correlate to their nuclear
gene-based estimated divergent time. These re sults indi-
cated that the dimorphism in cpDNA found in this
study was not the result of recent introgressive hybridi-
zation events, but we cannot rule out the poss ibility that
the dimorphism might be the result of ancient introgres-
sion events. Hybridization between A. thaliana and its
closely related species does o ccur in nature. For exam-
ple, several studies confirmed the allotetraploid species,
A. suecica , resulted from a hybridization e vent between
A. thaliana and A. are nosa about 10,000 to 50,000 years
ago [e.g., [25,34,35]].
The third explanation for genetic dimorphism is
demographic factors, such as founder effects. Being a
small annual weed, A. thaliana is a poor competitor in
dense vegetation whereas the highly self-fertilizing char-
acteristic makes it capable of founding a population
even from a single seed. As a result, this species has a
tendency for rapid colonization and extinction cycles
[1,7,36]. Founder ef fects might have occurre d repeated ly
in the evolutionary history of A. thaliana. The founder
event(s) could enable some rare alleles to spread into
additional populations when the founder population
expanded rapidly i f the unoccupied ecological niches
were favourable. The divergence time between MDHC-I
and M DHC-II was estimated to be about 0.36 mya
based on our cpDNA data. This is earlier than the esti-
mated time of demographic expansion during the
Eemian interglacial (about 0.122 mya; [8]). Therefore,
another possible explanation for the cpDNA dimorph-
ism might be a founder effect followed by limited gene
flow during late Pleistocene glaciations and interglacial
periods.
As the accessions in MDHC-II share five specific vari-
able sites with A. arenosa, the chloroplast genomes in
MDHC-II might represent more ancient types than
those in MDHC-I. It is also supported by the fact that
more haplotypes are found in MDHC-II (28) than in
MDHC-I (21).
Origin of Chinese populations
The 26 accessions of A. thaliana from Asia included in
this study are scattered compared to those collected
from Europe. Six of them belong to MDHC-II and 20
belong to MDHC-I. Of the MDHC-II group, two collec-
tions from China (XJalt and XJqhx) and two from
Kazakhstan (9481 and Kz10) are within or very close to
the Altai Mountains. Although these four accessions
Figure 4 NJ tree based on the combined data matrix. Bar at the
left bottom indicates scale value. Numbers at nodes indicate
bootstrap values. All nodes with <50% bootstrap support are
collapsed.
Yin et al. BMC Plant Biology 2010, 10:22
/>Page 8 of 16
Figure 5 MP tree inferred from the combined data matrix. The numbers at nodes indicate bootstrap values. All nodes with <50% bootstrap
support are collapsed.
Yin et al. BMC Plant Biology 2010, 10:22
/>Page 9 of 16
were not clus tered in the same clade in the phylogenies,
the two accessions from China were al ways on the same
branch. One of the Kazakhstan accessions (Kz10) was
clustered with XJalt and XJqhx together with a Russian
accession (N1, from Europe) in the NJ tree (Figure 4).
XJalt and XJqhx are unique in that they share six speci-
fic variable sites (Figure 2), the most number of specific
variable sites in this study. The provenances of these
two accessions are about 115 km apart and located in
the middle of the Altai Mountains range. Based on the
cpDNA data, the populations on the A ltai Mountain
range may have dispersed there during one of the late
Pleistocene glaciations, and some lo cal habitats along
the southern slopes of the Altai Mountains might have
served as refugia. In contrast to som e refugia in Europe,
where A. thaliana populations had contributed the post-
glacial colonization of western and northern Europe [9],
some populations in the Asian refugia, such as XJalt and
XJqhx, became relatively isolated genetically from other
populations after glaciers retreated. Therefore, some
fixed mutations were accumulated specifi cally in these
populations. It is also noticed by Beck et al [8] that
Figure 6 The 77 sequences were structured into two major differentiated haplotype classes. The solid circles in the first line denote the
five fixed nucleotide sites where the two MDHCs differ.
Yin et al. BMC Plant Biology 2010, 10:22
/>Page 10 of 16
Figure 7 Selected parsimony-informative SNP sites in the 77 accessions of A. thaliana andthreerelatedspecies.Thesolidcircles
indicate the sites where the three related species were identical to the MDHC-II.
Yin et al. BMC Plant Biology 2010, 10:22
/>Page 11 of 16
“differentiation is particularly strong between the Cen-
tral Asian refugia and all others, suggesting that either
small historical population sizes in Ce ntral Asia, rela-
tively limited gene flow between Central Asia and other
areas, o r a combination of the two have produced rela-
tively strong genetic drift in this region”. The other two
Asian accessions in the M DHC-II group are from Japan
(Tsu-0) and India (Kas-1). Although Tsu-0 was clustered
with Alc-0 from Spain, the bootstrap support is poor in
both NJ and MP trees (68% and 52%, respectively). Tsu-
0 has two specific variable sites, but only shares one
specific site with Alc-0. Its phylogenetic relationships
with other accessions are unclear and more samples are
needed to clarify its origin. Kas-1 fr om India shares four
specific variable sites with four accessions from Europe
(Figure 2); this accession will be discussed later.
In MDHC-I, 17 accessions collected along the Yangtze
River, China, were clustered together w ith an accession
from India (Kas-2). All data suggested th at the chloro-
plast genomes of these 18 accessions originated from a
single common ancestor. The initial time of expansion
of the populations along the Yangtze River was esti-
mated to be about 90,000 years ago based on the
cpDNA sequences. At l east we can rule out the possibi-
lity that these populations were introduced by recent
human activities, like th e populations found in the USA.
Both highlands of the western Himalayas and Caucasus
have been proposed as possible ancestral areas of A.
thaliana [8,37]. The populations along the Yangtze
River could have dispersed eastwards from the ancestral
area to the present-day locations via the Himalayas or
Kunlun Mountains, which ha ve an east-west trend. Kas-
Figure 8 Haplotype network. The red circles indicate median vectors and yellow circles indicate haplotypes. The areas of the yellow circles are
proportion to the number of accessions in each haplotype and the length of the lines between circle midpoints are proportion to the
differences between haplotypes. The haplotype is denoted by the accession name if there is only one accession in the haplotype, otherwise the
haplotype is denoted by H1~H10. The Arabic numerals denote the five sites where the two haplogroups differ. The five green lines and the
capital letters (A, B, C, D, E) beside the lines denote five clusters corresponding to the five branches (Branch A, B, C, D, E) in the NJ and MP trees.
H1: AHthx, GSwex, GZyjx, HBhax, HNzjj, SXcgx, SXmix; H2: HBwcq, HNylx, JXjgs, JXnfx, ZJdys; H3: CQbbq, CQtlx, ZJjds; H4: Aa-0, Berkeley, Col-0; H5:
Es-0, Est-0; H6: Ag-0, Al-0, FM10, Hirokazu Tsukaya, Lip-0, Ta-0; H7: Eil-0, Hi-0; H8: Bur-0, For-1; H9: BG1, HR14, Lc-0; H10: Ct-1, Kas-1, Ms-0, Pi-0,
Wassilewskija.
Yin et al. BMC Plant Biology 2010, 10:22
/>Page 12 of 16
2 was collected in Kashmir, India (74°E, 34°N), on the
southern slopes of the Himalayas. It shares a most fre-
quent haplotype with seven Chinese accessions, but it
can be distinguished from them only by one specific
variable site (Figure 2). There are at least two explana-
tions for the observed distribution pattern. The first is
that Kas-2 represents the type that is most similar to
the ancestor of the Yangtze River populations, and t he
expansion of the latter was immediately or ve ry shortly
after the dispersal event. However, in the phylogenies,
Kas-2 is not basal among the 18 accessions. The second
explanation is that Kas-2 might have been introduced to
Kashmir from China. It is uncertain which explanation
is more likely. More samples from the w estern part o f
the Himalayas and Kunlun Moun tains are definitely
needed for identification of the po ssible ancestral haplo-
type of the Yangtze River populations.
The other three accessions in MDHC-I are H Tsukaya
from Japan, Sorbo from Tajikistan, and Kas-1 from
India. The former shares one haplotype with four acces-
sions from Europe and one accession from the USA. It
is apparent that it represents a recent introduction to
Japan, possibly by human activity. The accession from
Tajikistan has a specific haplotype that is characterized
by four unique SNPs (Figure 2), and it shares a haplo-
type with one accession from Sweden, Italy and Libya,
respectively. Kas-1 shares the exact haplotype with two
accessions from Russia (Wassilewskija, Ms-0) and one
from Austria (Pi-0). Although Kas-1 and Kas-2 were col-
lected at the same locality (74°E, 34°N), as stated on th e
ABRC seed stock centre website, their genetic distinct-
ness has been noted previously [38]. Re-sampling from
their original locality might help in clarifying the
confusion.
The possible maternal parent of Arabidopsis suecica
Arabidopsis suecica is an allotetraploid species whose
maternal parent is A. thaliana. The species originated
more than 20,000 years ago from an allotetraploid
hybrid between A. thaliana and A. arenosa [25,35].
Several studies indicate that the ancestral area of A.
suecica is in Europe [e.g., [33]]. However, a recent
studybyBecket al [8] revealed a genetic similarity
between A. suecica and Chinese accessions of A. thali-
ana. In the present study, the cpDNA sequences of A.
suecica were more similar to those of some European
accessions, especially Chi-0 from Russia (34°E, 54°N).
Based on the comparison of cpDNA in this study, it is
most likely that the maternal parent of A. suecica was
from Europe.
Conclusions
Elucidating the dispersal of A. thaliana within Asia is a
very complicated issue. Temperature fluctuations during
glaciations and interglacial periods in the late
Pleistocene, the complex mountain ranges in the Central
and Central-East parts of Asia, and human activities
have all contributed to the present-day distribution pat-
terns. It is clear from this study that some populations
in East Asia, such as those along the Yangtze River,
were dispersed there along the Himalaya or Kunlun
Mountain ranges and underwent rap id expansion about
90,000 years ago. Altai Mountains may have provided
refugia for A. thaliana during Pleistocene glaciations.
However, more samples from the Altai, Kunlun, and
western part of the Himalaya mountain ranges are
needed to elucidate more fully the dispersal history of
A. thaliana populations in Asia.
Methods
Plants material and DNA extraction
Seventy-seven A. thaliana accessions were used in the
survey, seeds of 50 accessions were obtained from the
Nottingham Arabidopsis Stock Centre (NASC; Univer-
sity of Nottingham), eight accessions from t he Arabi-
dopsis Biological Resource Center (ABRC; Ohio State
University) and 19 accessions were field collected in
China (Table 1). All sampling locations in China were
separated by at least 50 km, with most of the locations
separated by more than 300 km (Figure 1, Table 2). The
nomenclature of the Chinese accessions follows that of
He et al. [7]. Two taxa closely related to A. thaliana,i.
e., A. arenosa and A. suecica, and one taxon closely
related to the genus Arabidopsis,i.e.,Olimarabidopsis
cabulica, were used as out-groups. Seeds of selected
plants were sterilized and germinated on MS solid agar
medium, and then transplanted into soil, as described
previou sly [7]. The seedlings were grown i n a cont rolled
environment at 22°C with a photoperiod of 16 h light/8
h dark. About 1 g of g reen leaf material was harvested
from a single plant for each accession and used for total
cellular DNA extraction using the CTAB method [39].
PCR amplification, DNA sequencing, and sequence
alignment
Intron or intergenic regions were selected for PCR
amplification in o rder to obtain maximum phylogenetic
information. Eleven pairs of PCR primers were designed
based on the Col-0 chloroplast genome sequences (Gen-
Bank accession no. AP000423) using the software Pri-
mer Premier [40]. All 11 pairs of primers are positioned
in protein- or RNA-coding gene regions flanking the
target fragments, and the length of the fragments ranged
from 570 nt to 1496 nt (Table 4). The amplified pro-
ducts were purified with the PCR Purification and Gel
Extraction Kit (V-gene Biotechnology), and sequenced
with an ABI 377 Automated DNA Sequencer (Perkin-
Elmer). To ensure the accuracy of the nucleotide
sequences, the sequences on both strands were deter-
mined, all polymorphisms were visually confirmed, and
Yin et al. BMC Plant Biology 2010, 10:22
/>Page 13 of 16
for ambiguous polymorphisms PCR amplificat ion and
sequencing were repeated.
Two accessions (AHyxx and Abd-0) were randomly
chosen to detect intra-accession polymorphism. The
seeds of AHyxx were field collected from at least 30
individual plants in Yuexi County, Anhui Province in
southeast China [7]. The seeds of Abd-0 were obtained
from the ABRC but were originally collect ed in the UK.
Green leaf material was harvested from 10 individual
plants for both accessions a nd total cellular DNA was
extracted separately. PCR amplification, purification and
sequencing were conducted as described above.
The DNA sequences were aligned initially using
MEGA 4.1 [41]. After alignment, the sequences were
edited manually. Gaps were positioned t o minimize
nucleotide mismatches. The 3’-and5’- flanking regions
of the protein-coding sequences were trimmed off and
only the i ntergenic spacer or intron regions were
retained for further analysis.
The nucleotide sequences of 11 fragments from each
accession were concatenated sequence by sequence to
form a combined sequence set. The combined sequence
sets formed a combined data matrix of 77 × 8978
nucleotides.
The sequences of these fragments have been sub-
mitted to the GenBank [42], and their accession num-
bers are listed in Table 4.
Population genetics and phylogenetic analyses
Polymorphism analyses were conducted for both intra-
and inter-specific comparison using DnaSP4.50 [43].
Nucleotide variation was estimated as nucleotide diversity
(π) [44]. The number of haplotypes was denoted by h and
haplotype diversity was denoted by Hd. Some statistical
methods, such as Tajima’s D test [45] and Fu and Li’s D*,
D, F* and F test [46], were conducted to test the neutral
mutation hypothesis. The A. arenosa orthologs were used
as the out-group sequences when needed.
Phylogenetic analyses were performed o n the com-
bined data matrix. Both neighbor joining (NJ) and maxi-
mum parsimony (MP) methods were used. The NJ tree
was constructed using MEGA 4.1, and Maximum Com-
posite Likelihood distance [47] was used and gaps were
treated as a complete deletion. The analysis w as done
with 1000 bootstrap replicates of the data. The MP tree
was constructed using PAUP*4.0 [48]. Bootstrap values
were calculated from 1000 replicates with a heuristic
search strategy. Gaps in the alignments of the sequences
were treated as missing data.
To visualize the relationship among haplotypes, a net-
work was constructed as describ ed by [49] using NET-
WORK version 4.2.0.1. A default weight of 10 was
applied to each site. ‘ Epsilon = 0’ was chosen for con-
structing the network for the 77 A. thaliana accessions
using the median joining algorithm.
Table 4 Information about eleven pairs of primers for PCR amplification and the length of their products
Primer No. Intergenic region Site*
(nt)
Primer sequence GenBank Acc No
1 trnR-atpA 9662-9937 5’-GGATAGGACATAGGTCTTCTAA-3’
5’-CACAGTGGAAGAACAGATAATG-3’
GU293237-GU293316
2 rpoB-trnC 26330-27372 5’-CCCTTCAAATTGTATCTGATTAAA-3’
5’-GATTTGAACTGGGGAAAAAGGATT-3’
GU293317-GU293396
3 trnG-trnfM-rps14 36561-36937 5’ -GCGGATATAGTCGAATGGTAAA-3’
5’-GTAAGATTCCGTCGCTAAGTGA-3’
GU293397-GU293476
4 ycf3-trnS 43752-44826 5’-CGCATAGCTTCATAATAATTCTGT-3’
5’-TCTACATAACAGTTCCAATGTTAC-3’
GU293477-GU293556
5 trnL-trnF 47491-48174 5’-TCCTCTGCTCTACCAACTGA-3’
5’-AAATCGTGAGGGTTCAAGTC-3’
GU293557-GU293636
6 rbcL-accD 56398-57074 5’-CTAGCTGCTGCTTGTGAAGTATGG-3’
5’-TAAAATTGAACCACGATTTTTCCA-3’
GU293637-GU293716
7 accD-psaI 58542-59246 5’-CAATTGCCGGAAAGACTAGG-3’
5’-GTTCACAAGCGGCTGAATCT-3’
GU293717-GU293796
8 psbE-ORF31 64323-65711 5’-TATCGAATACTGGTAATAATATCA-3’ 5’-ATAGTTAAAGCTGCTAGTAGAAAA-3’ GU293797-GU293876
9 psaJ-rpl33 67064-67487 5’-CTAGGGGTGTTATGCCGATT-3’
5’-GTTCGGTTCGTTAGCAGGTT-3’
GU293877-GU293956
10 rpl20-clpP 68866-69909 5’-CATGGAACGGGATGTTTTTA-3’
5’-GTTCTACGCCTCCGAGCTAT-3’
GU293957-GU294036
11 Intron in rpl16 81588-82643 5’-TCCTCGATGTTGTTTACGAAATCT-3’
5’-TCGAACTATTTATGGGGTTTTAGG-3’
GU294037-GU294116
* The Col-0 chloroplast genome sequence was used as reference (GenBank Accession: AP000423).
Yin et al. BMC Plant Biology 2010, 10:22
/>Page 14 of 16
Estimated divergence time and demographic analysis
To estimate the divergence time for the A. th aliana
accessions, the homologous sequences of A. arenosa
were used as a reference. The diverge nce time between
A. arenosa and A. thaliana was estimated as 5.1-5.4 mil-
lion years ago (mya) [50]. In another study, Clauss and
Koch estimated a divergence time between these two
species as 3.0~5.8 mya [33]. Here we adopted a diver-
gence time of 5 mya to simplify the calculations [51].
MEGA 4.1 was used to calculate the number of base
substitutions per site from averaging over all sequence
pairs (K) [52] between A. arenosa and the 77 A. thali-
ana accessions. Standard error estimates were obtained
by a bootstrap procedure with 1000 replicates. All posi-
tions containing gaps and missing data were eliminated
from the dataset (complete deletion option). The substi-
tution rate per nucleotide site per year (μ)wascalcu-
lated as:
KT/2
(1)
where T is the divergence time between A. arenosa
and A. thaliana. The K value between two A. thaliana
accessions (or groups) was calculated using MEGA 4.1
as mentioned above. The values for the divergence time
of the two A. thaliana acce ssio ns (or accession groups),
T, was calculated as:
TK /2
(2)
To test for evidence of demographic population
growth, a mismatch distribution analysis [53-55] was
conducted by using Arlequin 3.11 [56]. Parametric boot-
strapping with 1 000 replicates was used to evaluate the
sum of squared deviations (SSD) between observed and
expected mismatch distribution, the r aggedness index of
Harpending (HRag) [57] , the mode of the mismatch dis-
tribution (τ), and the upper and lower 95% confidence
limits around the estimate of τ. For estimating the
expansion time t, we adopted:
tu
/2
(3)
where t is the expansion time in number of genera-
tions, τ is the mode of the mismatch distribution, and u
is the mutation rate per generation for the entire DNA
sequence [54,55]. The u was calculated as:
um g
T
(4)
where m
T
is the number of the nucleotides of the
entire DNA sequence, μ is the substitution rate per
nucleotide site per year, and g is the generation time in
years.
Acknowledgements
We would like to thank Professor Ji Yang at Fudan University, Shanghai, for
his kind help in phylogenetic analyses and Li Zhang for her excellent skill in
DNA sequencing. We also wish to thank Dr. Ihsan Al-Shehbaz at Missouri
Botanical Garden, USA, and Dr. Steve O’Kane Jr at University of Northern
Iowa, USA for providing the seeds of some out-group species. This study
was supported by the National Basic Research Program of China (Grant No.
2006CB100105) and National Natural Science Foundation of China
(30370093).
Author details
1
National Laboratory of Protein Engineering and Plant Genetic Engineering,
Peking-Yale Joint Center for Plant Molecular Genetics and
AgroBiotechnology, College of Life Sciences, Peking University, Beijing
100871, China.
2
National Plant Gene Research Center (Beijing), Beijing
100101, China.
Authors’ contributions
PY collected some samples, conducted PCR amplification, DNA sequencing ,
and data analysis, and wrote the first draft of the manuscript. JK collected
some samples, and helped in analyzing the data. FH collected most of the
samples and helped in analyzing the data. L-JQ and HG designed the study,
and HG conceived of the study and revised the manuscript. All authors read
and approved the final manuscript.
Received: 30 May 2009
Accepted: 8 February 2010 Published: 8 February 2010
References
1. Koornneef M, Alonso-Blanco C, Vreugdenhil D: Naturally occurring genetic
variation in Arabidopsis thaliana. Annu Rev Plant Biol 2004, 55:141-172.
2. Bergelson J, Stahl E, Dudek S, Kreitman M: Genetic variation within and
among populations of Arabidopsis thaliana. Genetics 1998, 148:1311-1323.
3. Loridon K, Cournoyer B, Goubely C, Depeiges A, Picard G: Length
polymorphism and allele structure of trinucleotide microsatellites in
natural accessions of Arabidopsis thaliana. Theor Appl Genet 1998,
97:591-604.
4. Zwan Vander C, Brodie SA, Campanella JJ: The intraspecific phylogenetics
of Arabidopsis thaliana in worldwide populations. Syst Bot 2000, 25:47-59.
5. Sharbel TF, Haubold B, Mitchell-Olds T: Genetic isolation by distance in
Arabidopsis thaliana: biogeography and postglacial colonization of
Europe. Mol Ecol 2000, 9:2109-2118.
6. Barth S, Melchinger AE, Lubberstedt T: Genetic diversity in Arabidopsis
thaliana (L.) Heynh investigated by cleaved amplified polymorphic
sequence (CAPS) and inter-simple sequence repeat (ISSR) markers. Mol
Ecol 2002, 11:495-505.
7. He F, Kang D, Ren Y, Qu LJ, Zhen Y, Gu H: Genetic diversity of the natural
populations of Arabidopsis thaliana in China. Heredity 2007, 99:423-431.
8. Beck JB, Schmuths H, Schaal BA: Native range genetic variation in
Arabidopsis thaliana is strongly geographically structured and reflects
Pleistocene glacial dynamics. Mol Ecol 2008, 17:902-915.
9. Pico FX, Mendez-Vigo B, Martinez-Zapater JM, Alonso-Blanco C: Natural
genetic variation of Arabidopsis thaliana is geographically structured in
the Iberian Peninsula. Genetics 2008, 180:1009-1021.
10. Hanfstingl U, Berry A, Kellogg EA, Costa JT, Rudiger W, Ausubel FM:
Haplotypic divergence coupled with lack of diversity at the Arabidopsis
thaliana alcohol-dehydrogenase locus - roles for both balancing and
directional selection. Genetics 1994, 138:811-828.
11. Kawabe A, Innan H, Terauchi R, Miyashita NT: Nucleotide polymorphism in
the acidic chitinase focus (ChiA) region of the wild plant Arabidopsis
thaliana.
Mol Biol Evol 1997, 14:1303-1315.
12. Miyashita NT, Kawabe A, Innan H: DNA variation in the wild plant
Arabidopsis thaliana revealed by amplified fragment length
polymorphism analysis. Genetics 1999, 152:1723-1731.
13. Purugganan MD, Suddith JI: Molecular population genetics of floral
homeotic loci: Departures from the equilibrium-neutral model at the
APETALA3 and PISTILLATA genes of Arabidopsis thaliana. Genetics 1999,
151:839-848.
14. Kawabe A, Yamane K, Miyashita NT: DNA polymorphism at the cytosolic
phosphoglucose isomerase (PgiC) locus of the wild plant Arabidopsis
thaliana. Genetics 2000, 156:1339-1347.
Yin et al. BMC Plant Biology 2010, 10:22
/>Page 15 of 16
15. Aguade M: Nucleotide sequence variation at two genes of the
phenylpropanoid pathway, the FAH1 and F3H genes, in Arabidopsis
thaliana. Mol Biol Evol 2001, 18:1-9.
16. Hauser MT, Harr B, Schlotterer C: Trichome distribution in Arabidopsis
thaliana and its close relative Arabidopsis lyrata: Molecular analysis of
the candidate gene GLABROUS1. Mol Biol Evol 2001, 18:1754-1763.
17. Tian DC, Araki H, Stahl E, Bergelson J, Kreitman M: Signature of balancing
selection in Arabidopsis. Proc Natl Acad Sci USA 2002, 99:11525-11530.
18. Mauricio R, Stahl EA, Korves T, Tian DC, Kreitman M, Bergelson J: Natural
selection for polymorphism in the disease resistance gene Rps2 of
Arabidopsis thaliana. Genetics 2003, 163:735-746.
19. Shepard KA, Purugganan MD: Molecular population genetics of the
Arabidopsis CLAVATA2 region: The genomic scale of variation and
selection in a selfing species. Genetics 2003, 163:1083-1095.
20. Yoshida K, Kamiya T, Kawabe A, Miyashita NT: DNA polymorphism at the
ACAULIS5 locus of the wild plant Arabidopsis thaliana. Genes Genet Syst
2003, 78:11-21.
21. Abbott RJ, Gomes MF: Population genetic-structure and outcrossing rate
of Arabidopsis thaliana (L.) Heynh. Heredity 1989, 62:411-418.
22. Innan H, Terauchi R, Miyashita NT: Microsatellite polymorphism in natural
populations of the wild plant Arabidopsis thaliana. Genetics 1997,
146:1441-1452.
23. Ding J, Zhang W, Jing Z, Chen J-Q, Tian D: Unique pattern of R - gene
variation within populations in Arabidopsis. Mol Genet Genomics 2007,
277:619-629.
24. Sato S, Nakamura Y, Kaneko T, Asamizu E, Tabata S: Complete structure of
the chloroplast genome of Arabidopsis thaliana. DNA Res 1999, 6:283-290.
25. Sall T, Jakobsson M, Lind-Hallden C, Hallden C: Chloroplast DNA indicates
a single origin of the allotetraplold Arabidopsis suecica. J Evol Biol 2003,
16
:1019-1029.
26. Doyle JJ, Davis JI, Soreng RJ, Garvin D, Anderson MJ: Chloroplast DNA
inversions and the origin of the grass family (Poaceae). Proc Natl Acad Sci
USA 1992, 89:7722-7726.
27. Kim KJ, Choi KS, Jansen RKL: Two chloroplast DNA inversions originated
simultaneously during the early evolution of the sunflower family
(Asteraceae). Mol Biol Evol 2005, 22:1783-1792.
28. Castric V, Bechsgaard J, Schierup MH, Vekemans X: Repeated adaptive
introgression at a gene under multiallelic balancing selection. PLoS
Genetics 2008, 4:e1000168.
29. Schmid KJ, Ramos-Onsins S, Ringys-Beckstein H, Weisshaar B, Mitchell-
Olds T: A multilocus sequence survey in Arabidopsis thaliana reveals a
genome-wide departure from a neutral model of DNA sequence
polymorphism. Genetics 2005, 169:1601-1615.
30. Aris-Brosou S, Excoffier L: The impact of population expansion and
mutation rate heterogeneity on DNA sequence polymorphism. Mol Biol
Evol 1996, 13:494-504.
31. Rieseberg LH, Brunsfeld SJ: Molecular evidence and plant introgression.
Molecular systematics of plants New York: Chapman and HallSoltis PS, Soltis
DE, Doyle JJ 1992, 151-176.
32. Smissen RD, Breitwieser I, Ward JM: Phylogenetic implications of trans-
specific chloroplast DNA sequence polymorphism in New Zealand
Gnaphalieae (Asteraceae). Plant Syst Evol 2004, 249:37-53.
33. Clauss MJ, Koch MA: Poorly known relatives of Arabidopsis thaliana.
Trends Plant Sci 2006, 11:449-459.
34. O’Kane SL, Schaal BA, Al-Shehbaz IA: The Origins of Arabidopsis suecica
(Brassicaceae) as indicated by nuclear rDNA sequences. Systematic Botany
1996, 21:559-566.
35. Pontes O, Neves N, Silva M, Lewis MS, Madlung A, Comai L, Viegas W,
Pikaard CS: Chromosomal locus rearrangements are a rapid response to
formation of the allotetraploid Arabidopsis suecica genome. Proc Natl
Acad Sci USA 2004, 101:18240-18245.
36. Ostrowski MF, David J, Santoni S, McKhann H, Reboud X, Le Corre V,
Camilleri C, Brunel D, Bouchez D, Faure B, Bataillon T: Evidence for a large-
scale population structure among accessions of Arabidopsis thaliana:
possible causes and consequences for the distribution of linkage
disequilibrium. Mol Ecol 2006, 15:1507-1517.
37. Berger B: The taxonomic confusion within Arabidopsis and allied genera.
Arabidopsis research University of Gottingen, Gottingen, GermanyRobbelen
G 1965, 19-25.
38. Levey S, Wingler A: Natural variation in the regulation of leaf senescence
and relation to other traits in Arabidopsis. Plant, Cell and Envir 2005,
28:223-231.
39. Doyle JJ, Doyle JL: A rapid total DNA preparation procedure for fresh
plant tissue. Focus 1990, 12:13-15.
40. Primer Premier. />41. Tamura K, Dudley J, Nei M, Kumar S: MEGA4: Molecular evolutionary
genetics analysis (MEGA) software version 4.0. Mol Biol Evol 2007,
24:1596-1599.
42. GenBank. />43. Rozas J, Sanchez-DelBarrio JC, Messeguer X, Rozas R: DnaSP, DNA
polymorphism analyses by the coalescent and other methods.
Bioinformatics 2003, 19:2496-2497.
44. Nei M: Molecular evolutionary genetics Columbia University Press, New York
1987.
45. Tajima F: Statistical-method for testing the neutral mutation hypothesis
by DNA polymorphism. Genetics 1989, 123:585-595.
46. Fu YX, Li WH: Statistical tests of neutrality of mutations. Genetics 1993,
133:693-709.
47. Tamura K, Nei M, Kumar S: Prospects for inferring very large phylogenies
by using the neighbor-joining method. Proc Natl Acad Sci USA 2004,
101:11030-11035.
48. Swofford DL: PAUP*: Phylogenetic Analysis Using Parsimony (* and Other
Methods). Version 4 Sinauer Associates, Sunderland, Mass 1998.
49. Bandelt HJ, Forster P, Rohl A: Median-joining networks for inferring
intraspecific phylogenies. Mol Biol Evol 1999, 16:37-48.
50. Koch MA, Haubold B, Mitchell-Olds T: Comparative evolutionary analysis
of chalcone synthase and alcohol dehydrogenase loci in Arabidopsis,
Arabis, and related genera (Brassicaceae). Mol Biol Evol 2000,
17:1483-1498.
51. Koch MA, Matschinger M: Evolution and genetic differentiation among
relatives of Arabidopsis thaliana. Proc Natl Acad Sci USA 2007,
104:6272-6277.
52. Kimura M: A simple method for estimating evolutionary rates of base
substitutions through comparative studies of nucleotide-sequences. J
Mol Evol 1980, 16:111-120.
53. Slatkin M, Hudson RR:
Pairwise comparisons of mitochondrial-DNA
sequences in stable and exponentially growing populations. Genetics
1991, 129:555-562.
54. Rogers AR, Harpending H: Population growth makes waves in the
distribution of pairwise genetic differences. Mol Biol Evol 1992, 9:552-569.
55. Rogers AR: Genetic evidence for a Pleistocene population explosion.
Evolution 1995, 49:608-615.
56. Excoffier L, Laval G, Schneider S: ARLEQUIN (version 3.0): an integrated
software package for population genetics data analysis. Evol Bioinform
Online 2005, 1:47-50.
57. Harpending HC: Signature of ancient population-growth in a low-
resolution mitochondrial-DNA mismatch distribution. Hum Biol 1994,
66:591-600.
doi:10.1186/1471-2229-10-22
Cite this article as: Yin et al.: The origin of populations of Arabidopsis
thaliana in China, based on the chloroplast DNA sequences. BMC Plant
Biology 2010 10:22.
Submit your next manuscript to BioMed Central
and take full advantage of:
• Convenient online submission
• Thorough peer review
• No space constraints or color figure charges
• Immediate publication on acceptance
• Inclusion in PubMed, CAS, Scopus and Google Scholar
• Research which is freely available for redistribution
Submit your manuscript at
www.biomedcentral.com/submit
Yin et al. BMC Plant Biology 2010, 10:22
/>Page 16 of 16