báo cáo khoa học: " Defining reference genes in Oryza sativa using organ, development, biotic and abiotic transcriptome datasets" pot
Bạn đang xem bản rút gọn của tài liệu. Xem và tải ngay bản đầy đủ của tài liệu tại đây (3.09 MB, 13 trang )
Narsai et al. BMC Plant Biology 2010, 10:56
/>Open Access
METHODOLOGY ARTICLE
BioMed Central
© 2010 Narsai et al; licensee BioMed Central Ltd. This is an Open Access article distributed under the terms of the Creative Commons
Attribution License ( which permits unrestricted use, distribution, and reproduction in
any medium, provided the original work is properly cited.
Methodology article
Defining reference genes in
Oryza sativa
using
organ, development, biotic and abiotic
transcriptome datasets
Reena Narsai, Aneta Ivanova, Sophia Ng and James Whelan*
Abstract
Background: Reference genes are widely used to normalise transcript abundance data determined by quantitative RT-
PCR and microarrays. However, the approaches taken to define reference genes can be variable. Although Oryza sativa
(rice) is a widely used model plant and important crop specie, there has been no comprehensive analysis carried out to
define superior reference genes.
Results: Analysis of 136 Affymetrix transcriptome datasets comprising of 373 genome microarrays from studies in rice
that encompass tissue, developmental, abiotic, biotic and hormonal transcriptome datasets identified 151 genes
whose expression was considered relatively stable under all conditions. A sub-set of 12 of these genes were validated
by quantitative RT-PCR and were seen to be stable under a number of conditions. All except one gene that has been
previously proposed as a stably expressed gene for rice, were observed to change significantly under some treatment.
Conclusion: A new set of reference genes that are stable across tissue, development, stress and hormonal treatments
have been identified in rice. This provides a superior set of reference genes for future studies in rice. It confirms the
approach of mining large scale datasets as a robust method to define reference genes, but cautions against using gene
orthology or counterparts of reference genes in other plant species as a means of defining reference genes.
Background
The analysis of gene expression, or more correctly tran-
script abundance, is widely carried out in a variety of lab-
oratories in various disciplines. Northern blotting,
quantitative RT-PCR (QRT-PCR) and microarray
approaches are commonly used to assess transcript abun-
dance. All these approaches need a standard or reference
for comparison, so that the changes observed can be
attributed to a biological process rather than an artefact
of the particular technique used [1,2]. The use of north-
ern blotting often involves the use of equal RNA (total or
mRNA) loading as a reference point. Although this can
lead to errors, the variability of many steps in northern
blotting means that northern blots are generally only
used to assess large changes in transcript abundance. In
contrast, microarray analysis assesses the transcript
abundance of tens of thousands of genes, thus it has
required the application of statistical methods to norma-
lise the distribution of signals and also requires correc-
tion for large samples sets, so called false discovery rate
correction [3,4]. For QRT-PCR analysis, house-keeping
or reference genes can be used as a standard and by defi-
nition; the transcript abundance of this gene should not
change under the experimental conditions being studied.
The definition of reference genes is important as the
use of common sets of reference genes by scientists
allows direct comparisons between studies. The benefits
of comparing transcripts abundance datasets between a
variety of studies is best exemplified with microarray
studies, where the predominant use of a single robust
platform for studies in Arabidopsis thaliana has led to the
development of a number of databases where in silico or
digital northern analyses can be carried out. Thus, data-
bases such as Genevestigator [5] and the Botany Array
Resource (BAR) [6] are just two examples that provide a
valuable resource for researchers to obtain information of
transcript abundance patterns for genes of interest.
* Correspondence:
1
ARC Centre of Excellence in Plant Energy Biology, MCS Building M316
University of Western Australia, 35 Stirling Highway, Crawley 6009, Western
Australia, Australia
Full list of author information is available at the end of the article
Narsai et al. BMC Plant Biology 2010, 10:56
/>Page 2 of 13
QRT-PCR is often used to validate transcriptome data
obtained from array studies or is used in more directed
studies where the transcript abundance of a limited num-
ber of genes is analysed. Increasingly large scale studies
encompassing several hundred to thousands of genes are
also analysed by QRT-PCR and represent an important
resource to the scientific community, e.g. expression pro-
filing of transcription factors [7-9]. Thus, accurate refer-
ence genes are required to interpret such data. In an
Arabidopsis study that defined stably expressed genes
under a wide variety of conditions and organs, a "superior
set" of reference genes were identified that are widely
used in QRT-PCR studies in Arabidopsis [10]. An alter-
native approach to define reference genes is the use of
various statistical tests that essentially rank the variability
of transcripts abundances for sets of genes that are analy-
sed [1]. Bestkeeper [11], Norm-Finder [12] and geNORM
[13] are examples of such widely used programs, albeit
their use is limited to some extent in studies with plants
[2].
A variety of studies in different plant species have
defined reference genes [2]. Many studies selected a num-
ber of potential reference genes based on what is used in
other plant species, and tested changes in transcript
abundance, using statistical algorithms outlined above to
test for variations in different organs or environmental
conditions, to determine their suitability as reference
genes [14-17]. All these studies have defined reference
genes, but the limited number of conditions tested and
the lack of genome wide searches for superior reference
genes means that these sets may not represent the best
reference genes under a wide variety of conditions. The
ability of software programs to define variations in gene
expression is limited by the input data. However, it is
desirable to define reference genes that are stable in tran-
script abundance under as many conditions as possible
and analysing as many genes in the genome as possible.
Oryza sativa (rice) represents an important model
plant [18] and as a crop, provides 21% of the calorie needs
of the world's population (and up to ~75% for the popula-
tion of south east Asia [19]. As such, it is the focus of
intense research by a wide variety of researchers. One of
the fundamental problems facing researchers carrying
out gene expression studies is the use of control or refer-
ence genes that should not change, preferably under all
experimental conditions. Reference genes in rice have
been proposed by testing commonly used reference genes
in plants and orthologues of reference genes that have
been defined as in Arabidopsis [7,20]. It is unclear under
how many different parameters these genes are appropri-
ate reference genes and also if superior reference genes
could be defined using a genome wide approach as previ-
ously carried out in Arabidopsis [10].
In order to define suitable reference genes in rice in an
objective manner, a similar procedure to that used to
define reference genes in Arabidopsis was undertaken
[10]. We collated 373 Affymetrix genome arrays from rice
that encompassed tissue, abiotic, biotic and hormonal
parameters to define a set of 151 probesets that were sta-
bly expressed under all conditions. Of these, 12 genes
were chosen as reference genes and validated using QRT-
PCR, for different tissues and under stress. In this way, a
superior set of reference genes for rice was identified that
are suitable for organ, development and stress based
experiments.
Results and Discussion
Selection of transcriptome datasets
To meet the criteria for a suitable reference gene, the
transcript must be detected in all organs, developmental
conditions and under a variety of stress conditions. In
order to identify genes that fulfilled these criteria, all
transcriptome data available for rice on the Affymetrix
platform (August 2009) was utilised. Apart from being
widely used, it contains a variety of datasets that can be
analysed together on a common platform. Thus, data
from 373 microarrays were analysed together from exper-
iments encompassing tissue development sets (embryo,
endosperm, dry seed, germinating seed, coleoptiles, leaf,
apical meristem, root, stigma, ovary, and inflorescence),
abiotic stress (cold, heat, drought, salt, nutrient and phys-
ical), biotic stress (fungal, parasite, viral and bacterial)
and hormone treatments are represented (Table 1). Addi-
tionally, as the experiments presented in these datasets
have been performed in a variety of laboratories using
different varieties of rice, it is likely that genes defined as
not changing in expression are more likely to be robust.
Global analysis of transcriptome datasets
In order to analyse these multiple global rice transcrip-
tome data in a comparable way, all arrays were norma-
lised in the same way (materials and methods) and
present/absent calls were determined MAS5.0 normalisa-
tion. The genome was defined as the 57,302 probesets
targeted to Oryza sativa, thus the 81 probesets designed
for the bacterial/phage controls were not included. The
normalised data from all 373 microarrays (Table 1), rep-
resenting 136 biological samples were collated together
and a probeset was considered to be expressed in a par-
ticular tissue/sample if all replicates for every sample
showed statistically significant present calls (p < 0.05).
This cut-off method has previously been used as a way of
present/absent determination [10,21]. Using this princi-
ple, the expression for each probeset across all microar-
rays could be determined. Nearly eight thousand (7,922)
probesets were detected in all 373 microarray samples,
Narsai et al. BMC Plant Biology 2010, 10:56
/>Page 3 of 13
Table 1: Overview of experiments involving 373 Affymetrix rice genome microarrays used for the global analysis in this
study.
Sample description Ref GEO/other
accession
Reps Arrays Tissue
DEVELOPMENT/TISSUE
Dry seed and aerobic
germination (up to 24 h) cv.
Amaroo
[25] E-MEXP-1766 3 15 Dry and germinating
seed
Dry seed and anaerobic
germination (up to 24 h) and
switch conditions cv. Amaroo
[21] E-MEXP-2267 3 36 Imbibed seed
Aerobic and anaerobic grown
coleoptiles cv. Nipponbare
[27] GSE6908 2 4 Coleoptile
Embryo, endosperm, leaf and
root from 7-d seedling, 10-d
seedling cv. Zhonghua
[28] GSE11966 2 10 Embryo, endosperm,
leaf and root from 7-d
seedling, 10-d
seedling
Stigma, Ovary+7 single arrays
cv. Nipponbare
[29] GSE7951 1-3 13 Stigma, ovary+7
single arrays
Mature leaf, young leaf, semi
apical meristem, inflorescence,
seed cv. IR64
[30] GSE6893 3 45 Mature leaf, young
leaf, semi apical
meristem,
inflorescence, seed
ABIOTIC STRESS
Drought, salt, cold stress cv. IR64 [30] GSE6901 3 12 Seedling
Heat stress cv. Zhonghua [31] GSE14275 3 6 Seedling
Salt stress on 2 cultivars; indica,
FL478 (salt tolerant), indica, IR29
(salt sensitive)
[32] GSE3053 3 11 Crown and growing
point
Salt stress on 4 cultivars;
japonica, m103 (salt sensitive),
indica, IR29 (salt sensitive),
japonica, Agami (salt tolerant),
indica, IR63731 (salt tolerant)
[33] GSE4438 3 24 Panicle initiation
stage
Salt stress on root using 4
cultivars; FL478 (salt tolerant),
IR29 (salt sensitive), IR63731 (salt
tolerant), Pokkali (salt tolerant)
Not found GSE14403 3 23 Root
Fe and P treatments cv.
Nipponbare
[34] GSE17245 2 16 Root
Arsenate treatment cv. Azucena [35] GSE4471 3 12 Seedling
Physical stress at roots tips cv.
Bala
[35] GSE10857 3 12 Root tip
BIOTIC STRESS
S.Hermonthica plant parasite
infection cv. Nipponbare
(resistant), IAC165 (susceptible)
[36] GSE10373 2 24 Root
Narsai et al. BMC Plant Biology 2010, 10:56
/>Page 4 of 13
thereby fulfilling the first criterion for defining reference
genes (Figure 1).
Selection of reference genes
The GC-RMA normalised data for all microarrays with
publically available CEL files (331 microarrays; Table 1)
was used to calculate the mean, standard deviation (SD)
and coefficient of variance (CV; CV = SD/mean) for all
7,922 probesets, where a low CV is indicative of lower
variation. This was followed by selection process under-
taken to determine which of these genes were suitable as
reference genes (Figure 1). Only 151 of the 7,922 probe-
sets were defined as stably expressed across the develop-
mental, stress and/or entire dataset (Figure 1).
In order to visualise the expression of these 151 probe-
sets, the log
2
normalised values were hierarchically clus-
tered and as expected, stable expression profiles were
observed across the tissue development, stress and hor-
mone microarray experiments (Figure 2A). Only 2 of
these genes, LOC_Os07g02340.1 and
LOC_Os03g05290.1, have been previously identified as
stably expressed, with the former gene identified in a pre-
vious rice study [22], and the latter based on orthology
with an Arabidopsis reference gene [7] (Figure 2B, red
asterisk). A selection of 12 genes that showed stable
expression across the microarrays (Figure 2B) were analy-
sed further by QRT-PCR (Genes 1-12; Table 2). These 12
genes were selected on the basis of their CV and
included; 2 transcripts with the lowest CV calculated
across the stress microarray set (Genes 1-2), 2 transcripts
with the lowest CV across the developmental set (Genes
3-4), 3 transcripts with the lowest CV across the entire
microarray set (Genes 5-7) and the remaining 4 genes
were randomly selected from the 66 probesets with low
CV values (</=0.35; Genes 8-12) from the entire microar-
ray set (Figure 1 and 2B; Table 2).
Closer analysis of these 12 genes reveals that the genes
encoding, a 3-phosphoinositide-dependent protein
kinase-1 (LOC_Os06g48970.1) and a nucleic acid binding
protein (LOC_Os06g11170.1) showed stable, moderate
expression levels across the stress microarray set (Genes
1-2 in Table 2; Figure 2B). While the genes encoding a
tumor protein homolog (LOC_Os11g43900.1) and trans-
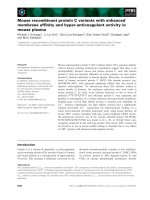
Figure 1 Schematic of selection criteria for stably expressed
genes and reference genes selected for QRT-PCR validation. CV =
coefficient of variance.
Expressed in all 373 microarrays
= 7922 probesets
CV <0.3 across the
116 developmental array set
= 37 probesets
CV <0.3 across the
185 stress array set
= 99 probesets
CV </=0.35 across the
331 full array set
=66 probesets
AND
either has:
151 probesets defined as stably expressed
12 transcripts selected for QRT-PCR analysis on the
basis of lowest CV within developmental, stress and
entire microarray set
M.grisea blast fungus infection
cv. Nipponbare
[37] GSE7256 2 8 Leaf
Rice stripe virus infection cv.
WuYun3, KT95-418
Not found GSE11025 3 12 Seedling
Infection with bacteria X.Oryzae
pv. oryzicola and oryzae cv.
Nipponbare
Not found GSE16793 4 60 Whole-plant tissue
HORMONE TREATMENT
Cytokinin treatment on root and
leaf cv. Nipponbare
[38] GSE6719 3 24 Root, 2-week old
seedlings
Indole-3-actetic acid and benzyl
aminopurine treatment cv. IR64
[39] GSE5167 2 6 Seedling
The microarray experiments are classified as development/tissue, abiotic stress, biotic stress or hormone treatment respectively, depending
on the purpose of the experiment. For each microarray dataset; the sample/experimental description, the respective cultivar (cv.), the
corresponding publication (Ref - where available), public Gene Expression Omnibus (GSE) identifier or MIAME Genexpress identifier (E-MEXP),
the number of biological replications carried out (Reps), the number of microarrays carried out in that experimental dataset and the tissues
analysed are shown.
Table 1: Overview of experiments involving 373 Affymetrix rice genome microarrays used for the global analysis in this
study. (Continued)
Narsai et al. BMC Plant Biology 2010, 10:56
/>Page 5 of 13
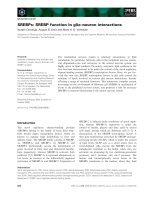
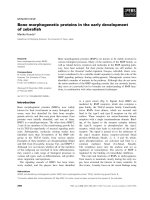
Figure 2 Analysis of stably expressed genes. A) Average linkage hierarchical clustering of the group of 151 probesets, based on CV criteria de-
scribed in Figure 1. The genes are on the y-axis and the samples on the x-axis. The details of the treatments are outlined in Table 1. The scale is log2
normalised values where blue is low levels of transcript abundance and red is high levels of transcript abundance. Genes indicated by blue asterisk
denotes novel reference genes indentified in this study, while red asterisk indicates genes previously defined as stably expressed in other studies
[8,22]. B) The probesets indicated by blue asterisk (*) in A, were independently hierarchically clustered and analysed by QRT-PCR. C) Average linkage
hierarchical clustering of the previously suggested/commonly used reference genes. The variation in transcript abundance across the various param-
eters is evident by the variation in colour intensity from left to right.
7
11
15
Log2 normalised values
*
*
*
*
*
*
*
*
*
*
*
*
*
*
**
Parasite
Fungus
Virus
Bacteria
IAA, BAP
Cytokinin
Coleoptile
Cold, drought, salt, heat
Salt
Iro n , p h o sp h orus
Root at wax
Arsenate
Development
Abiotic stre ss
Biotic stress Hormone
Seed
Aerobic germination
Anaerobic germ ination
Flower
Leaf
Root
*
LOC_Os06g48970.1
Protein kinase
*
LOC_Os06g11170.1
Nucleic acid binding protein
*
LOC_Os05g48960.1
Splic ing f ac tor U2af
*
LOC_Os06g43650.1
Expressed protein
*
LOC_Os12g32950.1
Membrane protein
*
LOC_Os11g21990.1
Eukar y otic in itiatio n f ac to r 5C
*
LOC_Os11g26910.1
SKP1-like protein 1A
**
LOC_Os07g02340.1
Expressed protein
*
LOC_Os11g43900.1
Tumor protein homolog
*
LOC_Os03g46770.1
RNA-binding protein
*
LOC_Os06g47230.1
Expressed protein
*
LOC_Os07g34589.1
Translation factor SUI1
A
B
C
LOC_Os03g55270.1 TIP41-like
LOC_Os03g25980.1 Nucleotide tract-binding protein
LOC_Os03g21210.1 endo-1,4-beta-glucanase
LOC_Os05g36290.1 Actin1
LOC_Os01g39260.1 FtsH protease
LOC_Os02g46510.1 AP-2 complex subunit
LOC_Os02g16040.1 Ubiquitin
LOC_Os01g59150.1 Beta-tubulin
LOC_Os08g23180.1 Arabinogalactan protein
LOC_Os07g43730.1 Elongation factor 1
LOC_Os07g42300.1 Elongation factor 1-delta
LOC_Os03g50890.1 Actin
LOC_Os02g38920.1 GAPDH
LOC_Os06g46770.1 Polyubiquitin
Narsai et al. BMC Plant Biology 2010, 10:56
/>Page 6 of 13
Table 2: The list of reference genes for rice, defined in this and previous studies.
Gene Probe Set
Identifier
TIGR
Identifier
Description Mean SD CV MV Source
1 Os.10676.1.S1_a_at LOC_Os06g1
1170.1
Nucleic acid
binding
protein
991.9 210.2 0.21 0.25 This study
2 Os.8912.1.S1_at LOC_Os06g4
8970.1
Protein
kinase
453.3 96.8 0.21 0.50 This study
3 Os.6.1.S1_a_at LOC_Os11g4
3900.1
Tumor
protein
homolog
13137.5 3692.7 0.28 0.66 This study
Os.6.1.S1_x_at Tumor
protein
homolog
13870.8 3368.4 0.24 This study
- Os.12625.2.S1_x_at No TIGR
identifier
NA 18285.5 4473.7 0.24 - This study
4 Os.12237.2.S1_a_at LOC_Os06g4
7230.1
Expressed
protein
18251.2 4481.0 0.25 0.30 This study
Os.12237.1.S1_a_at Expressed
protein
22019.9 5294.2 0.24 This study
5 Os.46231.2.S1_x_at LOC_Os03g4
6770.1
RNA-binding
protein
17176.5 4280.7 0.25 0.68 This study
Os.46231.1.S1_a_at RNA-binding
protein
22461.1 5636.0 0.25 This study
6 Os.6860.1.S1_at LOC_Os11g2
1990.1
Eukaryotic
initiation
factor 5C
6969.6 1967.0 0.28 0.54 This study
7 Os.7945.1.S1_at LOC_Os07g3
4589.1
Translation
factor SUI1
24678.2 7030.8 0.28 0.61 This study
8 Os.12409.1.S1_at LOC_Os07g0
2340.1
Expressed
protein
11392.3 3488.8 0.31 0.44 This study
9 Os.37924.1.S1_x_at LOC_Os11g2
6910.1
SKP1-like
protein 1A
8488.5 2713.8 0.32 0.85 This study
10 Os.12382.1.S1_at LOC_Os12g3
2950.1
Membrane
protein
6550.4 2258.4 0.34 0.59 This study
11 Os.8092.1.S1_at LOC_Os05g4
8960.1
Splicing
factor U2af
4051.7 1403.7 0.35 0.49 This study
12 Os.12151.1.S1_at LOC_Os06g4
3650.1
Expressed
protein
4504.6 1581.7 0.35 0.39 This study
13 AFFX-Os-actin-
3_s_at
LOC_Os03g5
0890.1
Actin 9556.3 5719.5 0.60 0.97 [7]; commonly
used reference
gene
14 Os.11355.1.S1_at LOC_Os05g3
6290.1
Actin1 1842.8 1471.3 0.80 0.79 [7]; commonly
used reference
gene
15 Os.9504.1.S1_at LOC_Os07g3
8730.1
Alpha-
tubulin
5400.3 3466.6 0.64 0.76 [7]; commonly
used reference
gene
16 Os.10139.1.S1_s_at LOC_Os06g4
6770.1
Polyubiquitin 15085.3 6524.3 0.43 0.47 [7]; commonly
used reference
gene
17 Os.7899.1.S1_at LOC_Os02g1
6040.1
Ubiquitin 2598.8 1135.4 0.44 0.63 [20]; commonly
used reference
gene
Narsai et al. BMC Plant Biology 2010, 10:56
/>Page 7 of 13
lation initiation factor SUI1 (LOC_Os07g34589.1)
showed stable expression across the developmental and
entire microarray sets respectively (Genes 4, 7 in Table 2;
Figure 2B). As would be expected, it can be seen that
many of these stably expressed genes are involved in core
cellular functions such as mRNA splicing and translation
initiation (Genes 1-12 denoted by blue asterisks in Figure
2A; 2B; Table 2).
In order to compare the reference genes defined in this
study with the expression of some genes defined as stably
expressed in these previous studies [7,10,22], 14 genes
commonly used reference genes were visualised in the
same way across the microarrays (Figure 2C) and the
mean, SD and CV for each was also calculated (Genes 13-
26; Table 2). It can be seen that there is a large amount of
variation in transcript abundance for many of the previ-
ously proposed stably expressed genes as well as the typi-
cal reference genes, such as those encoding Actin and
ubiquitin (Figure 2C; high CVs in Table 2). It is particu-
larly evidenced that beta-tubulin transcript expression is
variable under bacterial and parasite infection respec-
tively (Figure 2C). Although the heatmap visualisation of
the expression for the nucleotide tract-binding protein
(LOC_Os03g25980.1) and TIP41-like protein
(LOC_Os03g55270.1) appears unchanging (Figure 3 - top
2 genes), it can be seen that the CVs for both of those
genes is over 0.4 indicating a higher level of variation in
expression (Table 2).
Validation of reference genes in quantitative RT-PCR in
tissue and stress samples
In order to confirm stable expression of the reference
genes identified in this study primers were designed to 26
genes,12 stably expressed genes identified in this study
and 14 previously suggested reference genes (Table 1,
Additional file 1, Table S1). The stability of transcript
abundance of these genes was analysed by QRT-PCR
across 15 different samples from a variety of developmen-
tal (dry seed, imbibed seed, leaf and roots from young
and old plants) and stress treated tissues (shoots from
cold treated and heat treated young seedlings over time;
Materials and methods). High quality total RNA was iso-
lated from these samples and reverse transcribed to gen-
erate cDNA. The same cDNA pool from each of the
samples was used to measure the transcript abundance by
QRT-PCR, with melt curve analysis for each gene con-
firming primer specificity.
The geNORM v3.5 software was used to analyse the
expression stability for the reference genes analysed by
QRT-PCR from the 12 tissue samples (Additional file 1,
Table S1) [13]. This software allows calculation of a gene
stability measure (M) value for all the genes analysed,
18 Os.22781.1.S1_at LOC_Os02g3
8920.1
GAPDH 11640.8 8346.8 0.72 1.09 [20]; commonly
used reference
gene
19 Os.10158.1.S1_at LOC_Os07g4
3730.1
EF1 5619.9 2549.3 0.45 0.52 [20]; commonly
used reference
gene
20 Os.10385.1.S1_at LOC_Os03g5
5270.1
TIP41-like 482.7 274.5 0.57 0.42 [7]
21 Os.5500.1.S1_s_at LOC_Os08g2
3180.1
Arabinogalac
tan protein
4957.5 3114.1 0.63 0.90 [22]
22 Os.12835.2.S1_a_at LOC_Os07g4
2300.1
EF1d 6073.3 3003.7 0.49 0.82 [22]
23 Os.19618.1.S1_at LOC_Os01g3
9260.1
FtsH protease 1487.4 725.5 0.49 0.57 [22]
24 Os.7952.1.S1_at LOC_Os03g2
5980.1
Nucleotide
tract-binding
protein
607.8 241.8 0.40 0.56 (Orthologue)
[10]
25 Os.22806.1.S1_s_at LOC_Os02g4
6510.1
AP-2
complex
subunit
1550.2 744.5 0.48 0.64 (Orthologue)
[10]
26 Os.13910.1.S1_at LOC_Os03g2
1210.1
endo-1,4-
beta-
glucanase
900.7 1063.3 1.18 0.72 (Orthologue)
[10]
The gene number, Affymetrix probeset identifiers, TIGR identifiers, gene descriptions (TIGR), mean expression and standard deviation (SD) based
on GC-RMA normalised data. The coefficient of variance (CV) is also indicated for each probeset/gene. The M values calculated based the QRT-
PCR data; using geNORM software is also shown. Source indicates the studies from which these genes were selected.
Table 2: The list of reference genes for rice, defined in this and previous studies. (Continued)
Narsai et al. BMC Plant Biology 2010, 10:56
/>Page 8 of 13
where genes with the lowest M value shown the most sta-
ble expression (Figure 3A). Authors of the geNORM soft-
ware suggest using the 3 most stable genes (3 lowest M
values) as the most appropriate reference genes [13]. It
can be seen that even when commonly or previously sug-
gested reference genes and the novel reference genes
from this study are analysed together, all 3 of the most
stable genes are the novel reference genes identified in
this study (Figure 3A). It is important to note that this M
value is only calculated based on data from the limited
number of samples that were analysed by QRT-PCR, thus
not representing the wide variety of tissues/treatments
analysed by microarrays. Therefore, in order to visualise
the variation in expression across in the microarrays in
parallel, the CV values for each gene was also plotted with
the M values, where a lower CV value indicates greater
stability. In this way, the most stable genes were identified
as those with both low M and CV values. In this com-
bined analysis, the 12 genes chosen all outperformed pre-
viously used reference genes, particularly in terms of
having a lower CV (Figure 3A), the genes indicated with a
black diamond all had lower CV values as indicated by
the bar graph, with a gene encoding a nucleic acid bind-
ing protein (LOC_Os06g11170.1) apparently the most
stable (Figure 3A).
To further test the stability of the reference genes
defined in this study, the expression of the 12 novel refer-
ence genes defined in this study were analysed indepen-
dently by geNORM for the samples analysed by QRT-
PCR (Figure 3B and 3C). Overall, it can be seen that the
most stable genes had low M values as well and low CV
values, indicating stable expression (Figure 3B). Further-
more, the geNORM pair-wise analysis to determine the
number of control genes recommended for use in nor-
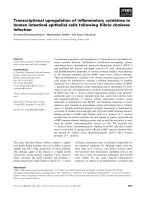
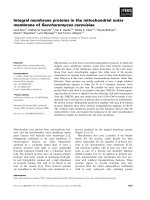
Figure 3 QRT-PCR validation of proposed reference genes and comparison to previously suggested/commonly used reference genes. A)
geNORM output using QRT-PCR data showing average expression stability values of all commonly used and novel reference genes, lower M value
indicates greater stability. The coefficient of variance for each gene across all the microarrays is also shown, lower CV indicates greater stability. Genes
with low M value and low CV are the most stable. Genes not expressed in all microarrays are indicated with an asterisk (*). B) Transcript abundance of
the 12 reference genes identified in this study (indicated in grey) and AP-2, HSF-82 and AOX in shoots from the (i) cold and (ii) heat treated (as indi-
cated) seedlings over time. C) Comparison of the change in AP-2, HSF-82 and AOX transcript abundance (log
2
fold change) in the leaves from the 3 h
cold and heat treated (as indicated) seedlings compared to the control seedlings using microarrays and QRT-PCR.
0
0.2
0.4
0.6
0.8
1
1.2
Coefficient of variance (CV)
B
C
D
GAPDH
Actin
Arabino galactan protein
SKP1-like p rotein 1A
Elon gation factor 1-delta
Actin1
Alph a-tubulin
end o-1,4-beta-glucanase
RNA-binding protein
Tumo r protein homolog
AP-2 complex subunit
UBQ
Tran slation factor SUI1
Membrane protein
FtsH protease
Nucleo tide tract binding protein
Eukaryo tic initiation factor 5C
Elongation factor 1
Protein kinase
Splicing factor U2af
Polyubiquitin
Exp ressed protein
TIP41-like
Exp ressed protein
Exp ressed protein
Nucleic acid binding protein
0
0.2
0.4
0.6
0.8
1
1.2
GAPDH
Actin
Arabinogalactan protein
SKP1-like protein 1A
Elongation factor 1-delta
Actin1
Alpha -tubulin
endo -1,4 - beta- glucanase
RNA - binding p rotein
Tumor protein homolog
AP-2 complex subunit
UBQ
Translation factor SUI1
Membrane protein
FtsH protease
Nucleotide tract binding protein
Eukaryotic initiation factor 5C
Elongation factor 1
Protein kinase
Splicing factor U2af
Polyubiquitin
Expressed protein 3
TIP41-like
Expressed protein 2
Expressed protein 1
Nucleic acid binding protein
Reference genes in this study
Other reference genes
-2
0
4
8
12
16
0369
-2
0
4
8
12
16
Time after cold treatment (hours)
0369
Time after heat treatment (hours)
Relative expression level (log2)
AOX
AP-2
H S F-82
AP-2 HSF-82 AOX
0
4
8
12
16
AP-2
(cold)
HSF-82
(heat)
AOX
(heat)
Microarrays
qRT-PCR
Relative expression level (log2)
0
0.2
0.4
0.6
0.8
1
1.2
SKP1-like protein 1A
RNA-binding protein
Tumor protein h omolog
Membrane protein
Translation factor SUI1
Eukaryotic initiation factor 5C
Expressed protein
Splicing factor U2af
Nucleic acid bin ding protein
Expressed p rotein 1
Expressed p rotein 2, 3
0
0.2
0.4
0.6
0.8
1
1.2
Coefficient of variance (CV)
Average expression stability (M)
Average expression stability (M)
i)
ii)
Reference genes
A
Control vs. treated - Log2 fold change
Narsai et al. BMC Plant Biology 2010, 10:56
/>Page 9 of 13
malisation [13], revealed that 2 or even one gene is stable
enough for accurate normalisation, however 2 genes is
recommended for more robust normalisation (V < 0.15;
Additional file 2, Figure S1) [13]. Using QRT-PCR analy-
sis, we also compared the expression of these 12 reference
genes to 3 heat or cold responsive genes including, an
Apetala type transcription factor (AP2), a heat shock
responsive factor (HSF-82) and alternative oxidase (AOX)
over time under i) cold or ii) heat conditions respectively
(Figure 3C). It can be observed that under cold treatment,
all 12 reference genes show very stable expression over
time (Figure 3Ci). Similarly, despite slight variation of
some genes under heat conditions, it is evidenced that
overall, these genes are also stably expressed over time
following heat treatment (Figure 3Cii). In addition, the
observed induction of AP2 and HSF-82 under cold and
heat treatment, confirmed the success of the respective
treatments (Figure 3C). Furthermore, comparison of this
induction (at 3 h) to the induction observed from the
analogous microarray data, showed that normalisation of
the QRT-PCR data using the reference genes defined in
this study resulted in comparable increases to those seen
using the microarray data (Figure 3C).
Comparison to previous studies and other expression
platforms
A large-scale study of reference genes in Arabidopsis
revealed superior reference genes using Affymetrix
microarray data [10]. Using the Inparanoid orthologue
output [23] for Arabidopsis and rice, it was seen that only
15 rice orthologues of the 30 novel Arabidopsis reference
genes were also expressed across all the microarrays in
this study and 3 of these were randomly selected for fur-
ther analysis by QRT-PCR (Genes 24-26; Table 2). Nota-
bly, only 1 gene (LOC_Os03g05290.1) encoding an
aquaporin TIP protein, was seen to be stably expressed
i.e. one of the 151 stably expressed in this study (red
asterisk only; Figure 2A). It may be noted that the overall
CV values are higher in this study compared to the CV
values calculated in the Arabidopsis study [10]. The main
reason for this is likely to be due to significant differences
in the variability of the input data from both studies. That
is, the Arabidopsis reference gene study used microarray
data generated from only 7 studies using a large number
of microarrays each e.g. 237 microarrays in the single
developmental study [10], whilst this study involved anal-
ysis of microarrays from 20 studies carried out in differ-
ent laboratories, using between 4 and 60 microarrays in
each.
Previous studies in rice have examined reference genes
using QRT-PCR analysis, however these only involved
analysis of a small number of commonly used reference
genes such as Actin, Actin1, alpha and beta tubulin, poly-
ubiquitin, ubiquitin, GAPDH and elongation factor 1 in
up to 25 samples, under a limited range of conditions
[7,20]. Analysis of these genes in the context of this study
(Genes 13-20; Table 2) revealed that some of these were
not detected as expressed in one or more tissue/stress
microarray experiments, notably, this included Actin1
(LOC_Os05g36290.1; Gene 14 in Table 2) which was not
expressed in all 3 biological replicates of the semi apical
meristem (GSE6901) (Figure 2C). Similarly, a recent study
in rice defined a set of 248 stably expressed genes across
40 developmental tissues that were analysed using Yale/
BGI oligonucleotide microarrays [22]. Only 61 of these
genes were found to be expressed across all the microar-
rays analysed in this study, nevertheless 3 of these were
randomly selected for further analysis by QRT-PCR
(Genes 21-23; Table 2). Notably, one of the 61 genes
(LOC_Os07g02340.1) encoding an "expressed protein"
was also found to fulfil all the criteria outlined in Figure 1,
and showed stable expression across all the samples anal-
ysed in the present study (Gene 8 in Table 2; denoted by
red and blue asterisk in Figure 2A and 2B).
In order to test the robustness of expression stability for
the 12 reference genes identified in this study, two differ-
ent approaches were undertaken. Firstly the expression
patterns of these 12 genes were examined on other
expression platforms, specifically the BGI/Yale oligonu-
cleotide and Agilent microarray platforms. Overall a sta-
ble expression pattern was observed for all genes
examined, with the most stable expression particularly
evidenced for LOC_Os11g43900.1, LOC_Os03g46770.1
and LOC_Os07g02340.1 using the Yale oligonucleotide
microarrays (Figure 4A). Notably, the latter gene was also
grouped within the 248 stably expressed genes defined
previously identified [22], thus complementing the iden-
tification of this gene in the presented study. Similarly,
the 12 reference genes identified in this study were also
examined for changes in expression following infection
with hemibiotrophic fungus Magnaporthe oryzae [24]. In
this study, Agilent Arrays (G4138A) were used for global
transcriptomic analysis following infection [24]. The
expression of all 12 genes were not found to significantly
differ (Students t-test, p < 0.01) following infection (Fig-
ure 4B). However, given that this experiment involved
stress treatment; AP-2, HSF-82 and AOX expression were
also examined following infection and it was observed
that AOX was significantly up-regulated (p < 0.01) fol-
lowing infection (Figure 4B). AOX is a known stress
responsive gene [25]. Thus the reference genes defined
are stable even under biotic stress stimulation, in addition
to the abiotic treatments carried out as described above.
Conclusion
The use of the large datasets of rice microarray data has
provided identification of sets of genes that are stably
Narsai et al. BMC Plant Biology 2010, 10:56
/>Page 10 of 13
expressed under a wide variety of parameters. Although
microarray platforms were not designed to be quantita-
tive, direct comparison of over 1000 QRT-PCR assays
with microarray data has revealed a high degree of corre-
lation [26]. This is consistent with the use of microarray
data to define superior reference genes as outlined here,
and previously in Arabidopsis [10]. Based on these princi-
ples, we suggest the use of one or more of the novel refer-
ence genes presented in this study for the normalisation
of rice microarray or QRT-PCR data. However although
the reference genes identified in this study are stable
under a wide variety of parameters, such as developmen-
tal, tissue and various stresses, it is essential that each
study validate the stability of the selected reference
gene(s) to achieve the systematic validation of reference
genes that is required to compare different studies [2].
Methods
Analyses of all publically available rice microarrays
To compile the entire publically available Affymetrix rice
microarray (as at 1
st
August 2009), all experiments con-
taining CEL files were downloaded from the Gene
Expression Omnibus within the National Centre for Bio-
technology Information database or from the MIAME
ArrayExpress database />press/. The GSE or EXP numbers for the respective rice
studies are shown in Table 1. There was a total of 373
microarrays for which there was either MAS5.0 data
available, thus all of these were used for present/absent
determination in defining the list of 7,922 probesets
expressed in all microarrays. However of these 373
microarrays, 7 had no biological replicates and 35 did not
have available CEL files, thus the remaining 331 microar-
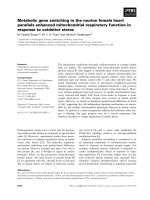
Figure 4 Expression of the proposed reference genes using other platforms. A) Transcript abundance levels for the 12 proposed references
genes based on data using the Rice Yale/BGI oligonucleotide microarray. The average intensity (using >2 replicates) were log2 transformed and visu-
alised across the tissues analysed in a previous study [22]. B) Change in transcript abundance for the 12 proposed reference genes (grey) and AP-2,
HSF and AOX (red box) following infection with hemibiotrophic fungus Magnaporthe oryzae [24]. Absolute fold-change values are shown (+/- standard
error). Significant changes (t-test, p < 0.01) are indicated by a red asterisk.
A
B
0
5
10
15
20
25
Scutellum (0hr)
Scutellum (12hr)
Scutellum (24hr)
Co leo ptile (0hr)
C o leo ptile (1 2h r)
C o leo ptile (2 4h r)
Plumule (0h r)
Plumule (12h r)
Plumule (24h r)
Epiblast (0hr)
Epiblast (12hr)
Epiblast (24hr)
Radicle (0hr)
Rad icle (12hr)
Rad icle (24hr)
Axillary primordium
Axillary meristem
Apical meristem
P1
P2
P3
Seedlin g blade bulliform
Seedlin g blade stomata
Seedlin g blade long cell
Seedlin g blade mesophyll
Seedlin g blade bundle sheath
Seedlin g blade vein
Lateral roo t cap
Root tip cortex
Ro o t tip vascular bun dle
Root tip metaxylem
Elon gation ep idermis
Elon gation co rtex
Elon gation en dodermis
Elon g. vascular bundle
Elon gation metaxylem
Maturation epidermis
Maturation cortex
Maturation endodermis
Matur. vascular bundle
W ho le root
W ho le leaf (fresh)
LOC_Os06g11170.1 (G1)
LOC_Os06g48970.1 (G2)
LOC_Os11g43900.1 (G3)
LOC_Os06g47230.1 (G4)
LOC_Os03g46770.1 (G5)
LOC_Os11g21990.1 (G6)
LOC_Os07g02340.1 (G8)
LOC_Os11g26910.1 (G9)
LOC_Os05g48960.1 (G11)
LOC_Os06g43650.1 (G12)
Average intensity (log2)
Fold induction in response to infection
-
4
-
2
0
2
4
6
8
LOC_Os06g11170.1
LOC_Os06g11170.1
LOC_Os06g48970.1
LOC_Os11g43900.1
LOC_Os06g47230.1
LOC_Os11g21990.1
LOC_Os07g34589.1
LOC_Os07g02340.1
LOC_Os05g48960.1
LOC_Os06g43650.1
LOC_Os09g28440.1
LOC_Os04g01740.1
LOC_Os04g51150.1
*
Narsai et al. BMC Plant Biology 2010, 10:56
/>Page 11 of 13
rays were used to carry out further normalisation (GC-
RMA) and calculation of mean, standard deviation and
coefficient of variance (CV). This allowed analysis of 117
tissues/conditions, with a minimum of 2 biological repli-
cates. The 117 included 41 organ/developmental tissues,
65 samples within abiotic and biotic stress experiments
and 11 samples within hormone treatment experiments.
All raw intensity CEL files were imported into Avadis
4.3 (Strand Genomics) and the standard MAS5.0 normal-
isation was first carried out in order to determine pres-
ent/absent/marginal calls for each probeset. For all 331
microarrays with available CEL files (and carried out for
biological replicates), GC-RMA normalisation was car-
ried out. The mean expression, SD and CV (=SD/mean)
was then calculated for each of the 7,922 probesets across
the developmental set, stress set and entire dataset
(which included the hormone experiments). On the basis
of CV cut-offs, the list of 151 probesets was generated
(Figure 1). The averaged log GC-RMA normalised values
for these 151 probesets, across the developmental tissues,
stress and hormone treatment experiments were hierar-
chically clustered using average linkage on Euclidean dis-
tance. The clustering analysis and heatmap generation
was carried out using Partek Genomics Suite, version 6.3
(Partek). For the Agilent microarray comparison, data
was retrieved under the accession GSE8518 from the
Gene Expression Omnibus within the National Centre for
Biotechnology Information database.
Analysis of orthologues
The InParanoid: Eukaryotic Orthologue Groups database
(version 7.0) was used to analyse all orthologues between
rice and Arabidopsis [23]. The orthologous group file was
downloaded for the whole-genome comparison of rice
versus Arabidopsis. This produced information for
orthologues identified by TIGR identifiers for rice and
AGIs for Arabidopsis.
Stress treatments, tissue collection and RNA isolation
In order to analyse the expression of all the genes in Table
2, a selection of tissues were collected across different
developmental stages/tissues and under different stress
conditions in wild type rice, cv. Amaroo. In order to anal-
yse different developmental tissues; embryos were
extracted from dry seed, seeds imbibed for 24 h with oxy-
gen gas (24 h A), seeds imbibed for 24 h in the absence of
oxygen gas i.e. in the presence of nitrogen gas (24 h N),
seeds imbibed for 24 h under nitrogen gas and switched
to oxygen gas for 3 h (27 NA), leaf and root tissues from
2-week old seedlings and 3 month old plants. Further-
more, to examine the effects of abiotic stress, 2-week old
seedlings were transferred to 4°C and 42°C for cold and
heat treatment respectively over a 9 h time course, whilst
the controls remained at a constant temperature of 30°C.
All 15 tissue samples were analysed using three biological
replicates, the RNA was isolated using the Qiagen
RNeasy Plant RNA isolation kit and DNase treated using
both the Qiagen on-column DNase digestion as well as
the Ambion Turbo DNase treatment exactly as carried
out in Howell et al., 2009 [27].
QRT-PCR analysis
Details of the primer sequences and amplicon lengths for
each of the genes are shown in Additional file 1, Table S1.
The transcript abundance for each gene was analysed
using the SYBR green I master (Roche, Sydney) with the
Roche LC480. Each sample was analysed in biological
triplicate, using individual plants and treatments to test
for reproducibility. Following RNA isolation each of the
samples was quantitated using a Nanodrop spectropho-
tometer. This provided the following information for
each sample: concentration (ng/μl), the absorbance (A) in
nm at 230, 260 and 280, the A
230
/A
260
and A
260
/A
280
ratios. Using this information the RNA yield and purity
was calculated to ensure that they all had no significant
impurities between samples that may affect reverse tran-
scription and/or amplification during QRT-PCR. 1 μg of
total RNA was reverse transcribed using the Bio-Rad
®
(Sydney) iScript reverse transcription kit, according man-
ufacturer's instructions. In parallel for each sample,
another 1 μg of RNA was used for the same reverse tran-
scription reaction, with the exception of the addition of
the reverse transcriptase enzyme (no RT samples). Fol-
lowing this, the Qiagen
®
PCR purification kit was used
according to manufacturer's instructions on all samples
(RT and "no RT" samples). This purified cDNA was
diluted 1 in 10 with nuclease-free water and 1 μl was used
for QRT-PCR analysis. For the no RT samples, no dilu-
tion was carried out and 1 μl was used in the same man-
ner as the diluted cDNA for QRT-PCR analysis, this
enables the detection of any genomic DNA contamina-
tion.
Additional material
Abbreviations
QRT-PCR: quantitative RT-PCR; SD: standard deviation; CV: coefficient of vari-
ance; MPSS: rice massively parallel signature sequencing; EF1d: elongation fac-
tor 1 delta; GAPDH: glyceraldehyde-3-phosphate dehydrogenase; HSF: heat
shock factor; AOX: alternative oxidase; AP2: Apetela 2.
Authors' contributions
RN carried out all the data analysis. RN, AI and SN carried out the experimental
procedures. JW gave advice on the analysis, experimental procedures design
and implementation. RN and JW drafted the manuscript. All authors read and
approved final manuscript.
Additional file 1 Table S1. List of genes analysed by QRT-PCR, primer
sequences (5' to 3') and amplicon lengths (bp) are shown for each gene.
Additional file 2 Figure S1. geNORM output using QRT-PCR data show-
ing optimal number of reference genes required for accurate normalisation.
Narsai et al. BMC Plant Biology 2010, 10:56
/>Page 12 of 13
Acknowledgements
This work was supported by an Australian Research Council Centre of Excel-
lence Grant CEO561495.
Author Details
ARC Centre of Excellence in Plant Energy Biology, MCS Building M316
University of Western Australia, 35 Stirling Highway, Crawley 6009, Western
Australia, Australia
References
1. Guenin S, Mauriat M, Pelloux J, Van Wuytswinkel O, Bellini C, Gutierrez L:
Normalization of qRT-PCR data: the necessity of adopting a systematic,
experimental conditions-specific, validation of references. J Exp Bot
2009, 60(2):487-493.
2. Gutierrez L, Mauriat M, Guenin S, Pelloux J, Lefebvre JF, Louvet R,
Rusterucci C, Moritz T, Guerineau F, Bellini C, Van Wuytswinkel O: The lack
of a systematic validation of reference genes: a serious pitfall
undervalued in reverse transcription-polymerase chain reaction (RT-
PCR) analysis in plants. Plant Biotechnol J 2008, 6(6):609-618.
3. Nettleton D: A discussion of statistical methods for design and analysis
of microarray experiments for plant scientists. Plant Cell 2006,
18(9):2112-2121.
4. Quackenbush J: Microarray data normalization and transformation. Nat
Genet 2002, 32(Suppl):496-501.
5. Zimmermann P, Hirsch-Hoffmann M, Hennig L, Gruissem W:
GENEVESTIGATOR. Arabidopsis microarray database and analysis
toolbox. Plant Physiol 2004, 136(1):2621-2632.
6. Toufighi K, Brady SM, Austin R, Ly E, Provart NJ: The Botany Array
Resource: e-Northerns, Expression Angling, and promoter analyses.
Plant J 2005, 43(1):153-163.
7. Caldana C, Scheible WR, Mueller-Roeber B, Ruzicic S: A quantitative RT-
PCR platform for high-throughput expression profiling of 2500 rice
transcription factors. Plant Methods 2007, 3:7.
8. Czechowski T, Bari RP, Stitt M, Scheible WR, Udvardi MK: Real-time RT-PCR
profiling of over 1400 Arabidopsis transcription factors:
unprecedented sensitivity reveals novel root- and shoot-specific
genes. Plant J 2004, 38(2):366-379.
9. Kakar K, Wandrey M, Czechowski T, Gaertner T, Scheible WR, Stitt M,
Torres-Jerez I, Xiao Y, Redman JC, Wu HC, Cheung F, Town CD, Udvardi MK:
A community resource for high-throughput quantitative RT-PCR
analysis of transcription factor gene expression in Medicago
truncatula. Plant Methods 2008, 4:18.
10. Czechowski T, Stitt M, Altmann T, Udvardi MK, Scheible WR: Genome-
wide identification and testing of superior reference genes for
transcript normalization in Arabidopsis. Plant Physiol 2005, 139(1):5-17.
11. Pfaffl MW, Tichopad A, Prgomet C, Neuvians TP: Determination of stable
housekeeping genes, differentially regulated target genes and sample
integrity: BestKeeper Excel-based tool using pair-wise correlations.
Biotechnol Lett 2004, 26(6):509-515.
12. Andersen CL, Jensen JL, Orntoft TF: Normalization of real-time
quantitative reverse transcription-PCR data: a model-based variance
estimation approach to identify genes suited for normalization,
applied to bladder and colon cancer data sets. Cancer Res 2004,
64(15):5245-5250.
13. Vandesompele J, De Preter K, Pattyn F, Poppe B, Van Roy N, De Paepe A,
Speleman F: Accurate normalization of real-time quantitative RT-PCR
data by geometric averaging of multiple internal control genes.
Genome Biol 2002, 3(7):RESEARCH0034.
14. Barsalobres-Cavallari CF, Severino FE, Maluf MP, Maia IG: Identification of
suitable internal control genes for expression studies in Coffea arabica
under different experimental conditions. BMC Mol Biol 2009, 10:1.
15. Exposito-Rodriguez M, Borges AA, Borges-Perez A, Perez JA: Selection of
internal control genes for quantitative real-time RT-PCR studies during
tomato development process. BMC Plant Biol 2008, 8:131.
16. Hu R, Fan C, Li H, Zhang Q, Fu YF: Evaluation of putative reference genes
for gene expression normalization in soybean by quantitative real-time
RT-PCR. BMC Mol Biol 2009, 10:93.
17. Reid KE, Olsson N, Schlosser J, Oenq F, Lund ST: An optimized grapevine
RNA isolation procedure and statistical determination of reference
genes for real-time RT-PCR during berry development. BMC Plant Biol
2006, 6:27-37.
18. Flavell R: Role of model plant species. Methods Mol Biol 2009, 513:1-18.
19. Fitzgerald MA, McCouch SR, Hall RD: Not just a grain of rice: the quest for
quality. Trends Plant Sci 2009, 14(3):133-139.
20. Jain M, Nijhawan A, Tyagi AK, Khurana JP: Validation of housekeeping
genes as internal control for studying gene expression in rice by
quantitative real-time PCR. Biochem Biophys Res Commun 2006,
345(2):646-651.
21. Narsai R, Howell KA, Carroll A, Ivanova A, Millar AH, Whelan J: Defining
core metabolic and transcriptomic responses to oxygen availability in
rice embryos and young seedlings. Plant Physiol 2009, 151(1):306-322.
22. Jiao Y, Tausta SL, Gandotra N, Sun N, Liu T, Clay NK, Ceserani T, Chen M, Ma
L, Holford M, Zhang HY, Zhao H, Deng XW, Nelson T: A transcriptome
atlas of rice cell types uncovers cellular, functional and developmental
hierarchies. Nat Genet 2009, 41(2):258-263.
23. Remm M, Storm CE, Sonnhammer EL: Automatic clustering of orthologs
and in-paralogs from pairwise species comparisons. J Mol Biol 2001,
314(5):1041-1052.
24. Mosquera G, Giraldo MC, Khang CH, Coughlan S, Valent B: Interaction
transcriptome analysis identifies Magnaporthe oryzae BAS1-4 as
Biotrophy-associated secreted proteins in rice blast disease. Plant Cell
2009, 21(4):1273-1290.
25. Van Aken O, Zhang B, Carrie C, Uggalla V, Paynter E, Giraud E, Whelan J:
Defining the Mitochondrial Stress Response in Arabidopsis thaliana.
Mol Plant 2009, 2(6):1310-1324.
26. Canales RD, Luo Y, Willey JC, Austermiller B, Barbacioru CC, Boysen C,
Hunkapiller K, Jensen RV, Knight CR, Lee KY, Ma Y, Maqsodi B, Papallo A,
Peters EH, Poulter K, Ruppel PL, Samaha RR, Shi L, Yang W, Zhang L,
Goodsaid FM: Evaluation of DNA microarray results with quantitative
gene expression platforms. Nat Biotechnol 2006, 24(9):1115-1122.
27. Howell KA, Narsai R, Carroll A, Ivanova A, Lohse M, Usadel B, Millar AH,
Whelan J: Mapping metabolic and transcript temporal switches during
germination in rice highlights specific transcription factors and the
role of RNA instability in the germination process. Plant Physiol 2009,
149(2):961-980.
28. Lasanthi-Kudahettige R, Magneschi L, Loreti E, Gonzali S, Licausi F, Novi G,
Beretta O, Vitulli F, Alpi A, Perata P: Transcript profiling of the anoxic rice
coleoptile. Plant Physiol 2007, 144(1):218-231.
29. Xue LJ, Zhang JJ, Xue HW: Characterization and expression profiles of
miRNAs in rice seeds. Nucleic Acids Res 2009, 37(3):916-930.
30. Li M, Xu W, Yang W, Kong Z, Xue Y: Genome-wide gene expression
profiling reveals conserved and novel molecular functions of the
stigma in rice. Plant Physiol 2007, 144(4):1797-1812.
31. Jain M, Nijhawan A, Arora R, Agarwal P, Ray S, Sharma P, Kapoor S, Tyagi
AK, Khurana JP: F-box proteins in rice. Genome-wide analysis,
classification, temporal and spatial gene expression during panicle and
seed development, and regulation by light and abiotic stress. Plant
Physiol 2007, 143(4):1467-1483.
32. Hu W, Hu G, Han B: Genome-wide survey and expression profiling of
heat shock proteins and heat shock factors revealed overlapped and
stress specific response under abiotic stresses in rice. Plant Science
2009, 176:583-590.
33. Walia H, Wilson C, Condamine P, Liu X, Ismail AM, Zeng L, Wanamaker SI,
Mandal J, Xu J, Cui X, Close TJ: Comparative transcriptional profiling of
two contrasting rice genotypes under salinity stress during the
vegetative growth stage. Plant Physiol 2005, 139(2):822-835.
34. Walia H, Wilson C, Zeng L, Ismail AM, Condamine P, Close TJ: Genome-
wide transcriptional analysis of salinity stressed japonica and indica
rice genotypes during panicle initiation stage. Plant Mol Biol 2007,
63(5):609-623.
35. Zheng L, Huang F, Narsai R, Wu J, Giraud E, He F, Cheng L, Wang F, Wu P,
Whelan J, Shou H: Physiological and transcriptome analysis of iron and
phosphorus interaction in rice seedlings. Plant Physiol 2009,
151(1):262-74.
36. Norton GJ, Lou-Hing DE, Meharg AA, Price AH: Rice-arsenate interactions
in hydroponics: whole genome transcriptional analysis. J Exp Bot 2008,
59(8):2267-2276.
37. Swarbrick PJ, Huang K, Liu G, Slate J, Press MC, Scholes JD: Global patterns
of gene expression in rice cultivars undergoing a susceptible or
resistant interaction with the parasitic plant Striga hermonthica. New
Phytol 2008, 179(2):515-529.
Received: 19 November 2009 Accepted: 31 March 2010
Published: 31 March 2010
This article is available from: 2010 Narsai et al; licensee BioMed Central Ltd. This is an Open Access article distributed under the terms of the Creative Commons Attribution License ( ), which permits unrestricted use, distribution, and reproduction in any medium, provided the original work is properly cited.BMC Plant Biology 201 0, 10:56
Narsai et al. BMC Plant Biology 2010, 10:56
/>Page 13 of 13
38. Ribot C, Hirsch J, Balzergue S, Tharreau D, Notteghem JL, Lebrun MH,
Morel JB: Susceptibility of rice to the blast fungus, Magnaporthe grisea.
J Plant Physiol 2008, 165(1):114-124.
39. Hirose N, Makita N, Kojima M, Kamada-Nobusada T, Sakakibara H:
Overexpression of a type-A response regulator alters rice morphology
and cytokinin metabolism. Plant Cell Physiol 2007, 48(3):523-539.
40. Jain M, Khurana JP: Transcript profiling reveals diverse roles of auxin-
responsive genes during reproductive development and abiotic stress
in rice. Febs J 2009, 276(11):3148-3162.
doi: 10.1186/1471-2229-10-56
Cite this article as: Narsai et al., Defining reference genes in Oryza sativa
using organ, development, biotic and abiotic transcriptome datasets BMC
Plant Biology 2010, 10:56