báo cáo khoa học: " Transcriptional responses to polycyclic aromatic hydrocarbon-induced stress in Arabidopsis thaliana reveal the involvement of hormone and defense signaling pathways" pdf
Bạn đang xem bản rút gọn của tài liệu. Xem và tải ngay bản đầy đủ của tài liệu tại đây (1.27 MB, 13 trang )
Weisman et al. BMC Plant Biology 2010, 10:59
/>Open Access
RESEARCH ARTICLE
BioMed Central
© 2010 Weisman et al; licensee BioMed Central Ltd. This is an Open Access article distributed under the terms of the Creative Commons
Attribution License ( which permits unrestricted use, distribution, and reproduction in
any medium, provided the original work is properly cited.
Research article
Transcriptional responses to polycyclic aromatic
hydrocarbon-induced stress in
Arabidopsis thaliana
reveal the involvement of hormone and defense
signaling pathways
David Weisman
†1
, Merianne Alkio
†2
and Adán Colón-Carmona*
1
Abstract
Background: Polycyclic aromatic hydrocarbons (PAHs) are toxic, widely-distributed, environmentally persistent, and
carcinogenic byproducts of carbon-based fuel combustion. Previously, plant studies have shown that PAHs induce
oxidative stress, reduce growth, and cause leaf deformation as well as tissue necrosis. To understand the transcriptional
changes that occur during these processes, we performed microarray experiments on Arabidopsis thaliana L. under
phenanthrene treatment, and compared the results to published Arabidopsis microarray data representing a variety of
stress and hormone treatments. In addition, to probe hormonal aspects of PAH stress, we assayed transgenic ethylene-
inducible reporter plants as well as ethylene pathway mutants under phenanthrene treatment.
Results: Microarray results revealed numerous perturbations in signaling and metabolic pathways that regulate
reactive oxygen species (ROS) and responses related to pathogen defense. A number of glutathione S-transferases that
may tag xenobiotics for transport to the vacuole were upregulated. Comparative microarray analyses indicated that the
phenanthrene response was closely related to other ROS conditions, including pathogen defense conditions. The
ethylene-inducible transgenic reporters were activated by phenanthrene. Mutant experiments showed that PAH
inhibits growth through an ethylene-independent pathway, as PAH-treated ethylene-insensitive etr1-4 mutants
exhibited a greater growth reduction than WT. Further, phenanthrene-treated, constitutive ethylene signaling mutants
had longer roots than the untreated control plants, indicating that the PAH inhibits parts of the ethylene signaling
pathway.
Conclusions: This study identified major physiological systems that participate in the PAH-induced stress response in
Arabidopsis. At the transcriptional level, the results identify specific gene targets that will be valuable in finding lead
compounds and engineering increased tolerance. Collectively, the results open a number of new avenues for
researching and improving plant resilience and PAH phytoremediation.
Background
Polycyclic aromatic hydrocarbons (PAH) are a family of
persistent, hydrophobic environmental toxins that origi-
nate from the incomplete combustion of carbon-based
fuels as well as from the release of petroleum into the
environment [1,2]. As PAHs are potent carcinogens in
humans [3,4], remediation of PAH contamination is an
ongoing endeavor. Traditionally, removal of pollutants
from soil is a disruptive and costly physical process; con-
sequently, there is strong interest in applying phytoreme-
diation, the use of plants to sequester, volatilize, or
degrade pollutants [5,6].
An idealized plant used for PAH removal would uptake
large amounts of the pollutant into the root system,
transport the molecules to cellular compartments,
metabolize the pollutant, and utilize or volatilize the non-
toxic byproducts. In practice, these processes are rate- or
capacity-limited, thereby limiting the net removal of PAH
* Correspondence:
1
Department of Biology, University of Massachusetts Boston, 100 Morrissey
Blvd, Boston, MA 02125, USA
†
Contributed equally
Full list of author information is available at the end of the article
Weisman et al. BMC Plant Biology 2010, 10:59
/>Page 2 of 13
from soil. Over time, stress from pollutants and their
byproducts can cause cumulative plant damage, further
reducing pollutant flux through the system. With the
goals of identifying and relaxing these constraints, theo-
retical and applied research is ongoing. As an example of
enhanced arsenic phytoremediation, a series of experi-
ments identified limiting processes and introduced trans-
genic constructs into Arabidopsis, resulting in greatly
increased uptake and tolerance of the pollutant [7-9].
Unlike in arsenic phytoremediation, where plant hyper-
accumulation followed by harvesting is the goal, phytore-
mediation of PAHs could ultimately lead to complete
degradation of the organic compounds.
Following PAH treatment, plants exhibit a variety of
stresses. Previous studies have shown that PAHs cause
trichome and leaf deformations, accumulation of H
2
O
2
,
oxidative stress, cell death, upregulation of antioxidant
systems, and reduced plant growth [1,10-14]. In many
regards, these symptoms broadly resemble the patho-
genic hypersensitive response (HR) [14]. While there is
substantial evidence of oxidative stress, the signaling and
biochemical changes leading to the complex PAH symp-
toms are unknown.
The phytohormone ethylene has long been known to
play central roles in oxidative stress responses and cell
death [15], in plant growth inhibition [16], and in abiotic
as well as pathogen responses [17,18]. These broad paral-
lels, as well as the observation that the ethylene-respon-
sive gene GSTF2 is upregulated in PAH-treated
Arabidopsis [14,19], suggest that ethylene signaling may
play a role in the PAH stress response. To better under-
stand these areas, this study performed DNA microarray
experiments to measure global transcriptional changes in
Arabidopsis when treated with the three-ringed PAH
phenanthrene. In addition, possible roles of ethylene sig-
naling were investigated using ethylene-responsive
reporter plants, ethylene production mutants, ethylene
signaling mutants, and exogenous application of an ethyl-
ene precursor.
Results
Transcriptional responses to phenanthrene
To assess differential transcript levels of PAH-treated
Arabidopsis, microarray experiments were performed on
wild type (WT) whole plants grown for 21 days on sterile
medium containing 0 mM or 0.25 mM phenanthrene.
The PAH treatment level is comparable to levels found in
polluted land and water sites [10]. A statistically signifi-
cant set of transcripts was selected using a Benjamini and
Hochberg false discovery rate (FDR) of 0.05. Of these,
high-stringency biological relevance was defined as the
genes with greater than two-fold change in either direc-
tion, resulting in 1031 phenanthrene-responsive tran-
scripts that were analyzed further. The full microarray
dataset is available in Additional File 1, and the differen-
tially-expressed subset is available in Additional File 2.
To elucidate classes of transcripts affected by phenan-
threne, gene ontology (GO) analyses were performed on
the 1031 differentially-expressed genes. A summary of
this analysis is available in Additional File 3. Comple-
menting the GO analysis, MapMan figures (Additional
File 4) were produced to visualize phenanthrene-induced
changes in cellular processes. Additional File 5 highlights
relevant transcriptional changes related to stress, hor-
mone signaling, and other selected processes.
A striking feature is the downregulation of photosyn-
thesis-related mRNA levels (Additional File 3, Additional
File 4a,b). In concert with the reduced photosynthesis,
chlorophyll and carotenoid biosynthesis as well as protein
targeting to the chloroplasts were reduced (Additional
File 3, Additional File 4c,d). Downregulated processes
further included protein biosynthesis and gluconeogene-
sis (Additional File 3).
Of the differentially-expressed transcripts, there is a
strong overrepresentation of genes involved in biotic and
abiotic stresses, oxidative stress, wounding, immunity,
and defense responses (Additional File 3, Additional File
4e). For instance, the genes coding for the ethylene-
inducible defense response proteins PDF1.2a and
PDF1.2b [20] were strongly upregulated on the microar-
ray (Additional File 5). The pathogenesis related (PR)
gene PR-1, which is the marker gene for systemic
acquired resistance (SAR) was upregulated over 200-fold.
PR-1 is induced by salicylic acid (SA) but does not require
ethylene or jasmonate [21]. Transcript levels of PR-2, -3
(B-CHI, basic chitinase), -4, and -5 were also increased by
phenanthrene (Additional File 1, Additional File 5, and
Additional File 6).
A variety of antioxidant and detoxification systems
were affected (Additional File 3 and Additional File 4f).
The transcript level of the arginine decarboxylase ADC2,
a key enzyme in polyamine synthesis, was increased on
the PAH microarray (Additional File 2). Twelve microar-
ray probes representing glutathione transferases (GST),
enzymes that tag xenobiotics with glutathione for trans-
port into the vacuole [22,23], reported significant
increases (Additional File 2 and Additional File 5). For
instance, the GST AtGSTU24 was upregulated on
phenanthrene. Additionally, the microarray probe that
recognized AtGSTF2 (At4g02520) and AtGSTF3
(At2g02930) indicated a 3.7-fold increase of the tran-
scripts on phenanthrene. Similarly, the probe that binds
the GSTs At1g02920 and At1g02930 indicated 12-fold
upregulation of these genes. Among the phenanthrene
responsive GSTs, AtGSTU24 has previously been shown
to be sharply and rapidly induced by the herbicides ace-
tochlor and metolachlor, as well as the explosives 2,4,6-
trinitrotoluene and hexahydro-1,3,5-trinitro-1,3,5-triaz-
Weisman et al. BMC Plant Biology 2010, 10:59
/>Page 3 of 13
ine [24]. Along similar lines, UDP-glucoronosyl and
UDP-glucosyl transferase UGT74F2 (At2g43820, Addi-
tional File 5) was strongly upregulated by phenanthrene.
This gene was constitutively upregulated in antioxidant
loss-of-function mutants [25], which is consistent with
upregulation in response to reactive oxygen species
(ROS). Activation of the secretory system is further indi-
cated by upregulation of protein targeting through the ER
and the Golgi apparatus (Additional File 4d). Inversely,
mRNA levels of several antioxidant genes were dimin-
ished (Additional File 4e). Downregulated mRNAs
include the catalases (Additional File 1) CAT1, CAT3, as
well as CAT2 which is consistent with previous RT-PCR
data [10]. The ascorbate peroxidases APX4 (Additional
File 5) and TAPX (Additional File 2) as well as the super-
oxide-dismutase FSD1 (Additional File 5) were also
downregulated on phenanthrene.
Expression levels of many hormone-responsive genes
were changed: Generally, jasmonic acid (JA), SA, or
abscisic acid responsive genes were induced, whereas gib-
berellic acid, brassinolide or auxin responsive genes were
repressed (Additional File 3, Additional File 4f, Addi-
tional File 5). Expression of many typical ethylene-induc-
ible genes was induced, including defensins, HEL, GSTs
and basic chitinase (Additional File 5). However, other
typical ethylene-responsive genes, such as HLS1, were
unaffected. Two genes of the ethylene biosynthesis path-
way were downregulated: ACS6, an aminocyclopropane-
1-carboxylic acid (ACC) synthase, and ACO2, an 1-amin-
ocyclopropane-1-carboxylic acid (ACC) oxidase. Of the
145 putative ethylene-regulated AP2/EREBP transcrip-
tion factor genes [26], 126 are represented on the
microarray (Additional File 1), and mRNA levels of ten of
these were more than two-fold affected by phenanthrene.
Interestingly, the ethylene response factor ERF1-1, which
integrates ethylene and JA signals [27], was significantly
upregulated in the PAH dataset (Additional File 1). An
overview of the transcriptional changes in hormonal and
other regulatory processes is given in Additional File 3
and Additional File 4f.
Comparison between phenanthrene and other stress and
hormone treatments
The gene ontology and MapMan analyses (Additional File
3 and Additional File 4e) of the transcriptional profile
indicate that the PAH response shares commonality with
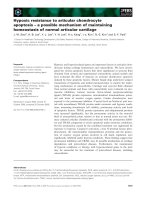
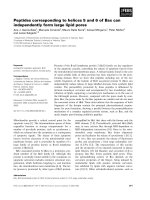
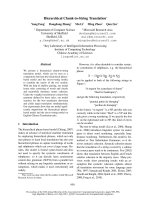
biotic stress responses. Illustrating this relationship, Fig-
ure 1 compares the phenanthrene dataset to the treat-
ment with the pathogenic fungus Botrytis cinerea, and
indicates a strong correlation (ρ = 0.72) between the two
treatments. In Figure 1, Quadrants I and III contain the
transcripts that were jointly up- or downregulated on
both treatments. The vast majority of the phenanthrene
responsive transcripts fall into these categories. For
instance, the cell wall expansins AtEXP1, AtEXP8 [14],
and AtEXP11 were downregulated on both treatments
(Quadrant III). Quadrant II contains transcripts that were
downregulated by phenanthrene but upregulated by the
B. cinerea fungal attack, and includes the ethylene bio-
synthesis gene ACS6. Inversely, Quadrant IV contains
transcripts that are highly expressed on phenanthrene
and diminished by the pathogen, including the cell wall
expansin AtEXP4, AtNAP2 (POP1), which encodes a
NAP-type ABC transporter, and At1g47400 of unknown
function.
To further compare the PAH response with other
experimental conditions, the phenanthrene dataset was
clustered with a variety of published microarray datasets
measuring responses to biotic, abiotic, chemical, and
physical stresses as well as hormone and hormone inhibi-
tor treatments. Table 1 shows correlations between the
phenanthrene microarray and other experimental condi-
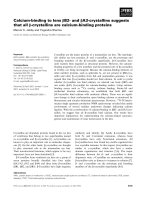
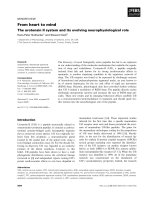
tions. The heatmap in Figure 2 shows the results from
clustering genes and experimental conditions. The com-
plete dataset of the heatmap is available in Additional File
6. The manifest clusters in the heatmap show strong sim-
ilarity with various strains of Pseudomonas syringae, as
well as the fungi B. cinerea and Erysiphe orontii. Ozone,
osmotic, and oxidative stresses, as well as senescence,
also correlated with the phenanthrene response.
Figure 1 Comparison of transcriptional responses to phenan-
threne and Botrytis cinerea. Scatter plot of 1031 differentially-ex-
pressed transcripts from microarray data of 21-day old phenanthrene-
treated Arabidopsis plants, compared to B. cinerea treatment. Counts
represent the number of transcripts up (+) or down (-) regulated in
each condition. Roman numerals identify the quadrants described in
the text.
−5 0 5 10
−5 0 5 10
log
2
Phenanthrene treated ÷ untreated
log
2
Botrytis cinerea treated ÷untreated
●
●
●
●
●
●
●
●
●
●
●
●
●
●
●
●
●
●
●
●
●
●
●
●
●
●
●
●
●
●
●
●
●
●
●
●
●
●
●
●
●
●
●
●
●
●
●
●
●
●
●
●
●
●
●
●
●
●
●
●
●
●
●
●
●
●
●
●
●
●
●
●
●
●
●
●
●
●
●
●
●
●
●
●
●
●
●
●
●
●
●
●
●
●
●
●
●
●
●
●
●
●
●
●
●
●
●
●
●
●
●
●
●
●
●
●
●
●
●
●
●
●
●
●
●
●
●
●
●
●
●
●
●
●
●
●
●
●
●
●
●
●
●
●
●
●
●
●
●
●
●
●
●
●
●
●
●
●
●
●
●
●
●
●
●
●
●
●
●
●
●
●
●
●
●
●
●
●
●
●
●
●
●
●
●
●
●
●
●
●
●
●
●
●
●
●
●
●
●
●
●
●
●
●
●
●
●
●
●
●
●
●
●
●
●
●
●
●
●
●
●
●
●
●
●
●
●
●
●
●
●
●
●
●
●
●
●
●
●
●
●
●
●
●
●
●
●
●
●
●
●
●
●
●
●
●
●
●
●
●
●
●
●
●
●
●
●
●
●
●
●
●
●
●
●
●
●
●
●
●
●
●
●
●
●
●
●
●
●
●
●
●
●
●
●
●
●
●
●
●
●
●
●
●
●
●
●
●
●
●
●
●
●
●
●
●
●
●
●
●
●
●
●
●
●
●
●
●
●
●
●
●
●
●
●
●
●
●
●
●
●
●
●
●
●
●
●
●
●
●
●
●
●
●
●
●
●
●
●
●
●
●
●
●
●
●
●
●
●
●
●
●
●
●
●
●
●
●
●
●
●
●
●
●
●
●
●
●
●
●
●
●
●
●
●
●
●
●
●
●
●
●
●
●
●
●
●
●
●
●
●
●
●
●
●
●
●
●
●
●
●
●
●
●
●
●
●
●
●
●
●
●
●
●
●
●
●
●
●
●
●
●
●
●
●
●
●
●
●
●
●
●
●
●
●
●
●
●
●
●
●
●
●
●
●
●
●
●
●
●
●
●
●
●
●
●
●
●
●
●
●
●
●
●
●
●
●
●
●
●
●
●
●
●
●
●
●
●
●
●
●
●
●
●
●
●
●
●
●
●
●
●
●
●
●
●
●
●
●
●
●
●
●
●
●
●
●
●
●
●
●
●
●
●
●
●
●
●
●
●
●
●
●
●
●
●
●
●
●
●
●
●
●
●
●
●
●
●
●
●
●
●
●
●
●
●
●
●
●
●
●
●
●
●
●
●
●
●
●
●
●
●
●
●
●
●
●
●
●
●
●
●
●
●
●
●
●
●
●
●
●
●
●
●
●
●
●
●
●
●
●
●
●
●
●
●
●
●
●
●
●
●
●
●
●
●
●
●
●
●
●
●
●
●
●
●
●
●
●
●
●
●
●
●
●
●
●
●
●
●
●
●
●
●
●
●
●
●
●
●
●
●
●
●
●
●
●
●
●
●
●
●
●
●
●
●
●
●
●
●
●
●
●
●
●
●
●
●
●
●
●
●
●
●
●
●
●
●
●
●
●
●
●
●
●
●
●
●
●
●
●
●
●
●
●
●
●
●
●
●
●
●
●
●
●
●
●
●
●
●
●
●
●
●
●
●
●
●
●
●
●
●
●
●
●
●
●
●
●
●
●
●
●
●
●
●
●
●
●
●
●
●
●
●
●
●
●
●
●
●
●
●
●
●
●
●
●
●
●
●
●
●
●
●
●
●
●
●
●
●
●
●
●
●
●
●
●
●
●
●
●
●
●
●
●
●
●
●
●
●
●
●
●
●
●
●
●
●
●
●
●
●
●
●
●
●
●
●
●
●
●
●
●
●
●
●
●
●
●
●
●
●
●
●
●
●
●
●
●
●
●
●
●
●
●
●
●
●
●
●
●
●
●
●
●
●
●
●
●
●
●
●
●
●
●
●
●
●
●
●
●
●
●
●
●
●
●
●
●
●
●
●
●
●
●
●
●
●
●
●
●
●
●
●
●
●
●
●
●
●
●
●
●
●
●
●
●
●
●
●
●
●
●
●
●
●
●
●
●
●
●
●
●
●
●●
●
●
●
●
●
●
●
●
●
●
●
●
●
●
●
●
●
●
●
●
●
●
●
●
●
●
●
●
●
●
●
●
●
●
●
●
●
●
●
●
●
●
●
●
●
●
●
●
●
●
●
●
●
●
●
●
●
●
●
●
●
●
●
●
●
●●
●
●
●
●
●
●
●
●
●
●
●
●
●
●
●
●
●
●
●
●
●
●
●
●
●
●
●
●
Comparison of transcriptional responses
to phenanthrene and Botrytis cinerea
Counts:
PHE
bot − +
+ 40 344
− 595 52
Spearman
correlation
= 0.72
III
III
IV
Weisman et al. BMC Plant Biology 2010, 10:59
/>Page 4 of 13
In contrast with the phenanthrene-induced downregu-
lation of ACS6, the transcript was upregulated by B.
cinerea attack and in other biotic stresses, oxidative
stress, O3, SA, genotoxicity, indoleacetic acid (IAA),
TIBA (inhibitor of polar auxin transport) and AgNO3
(inhibitor of ethylene signaling) treatments. WRKY40, a
member of a transcription factor family that frequently
plays critical roles in stress responses [28], followed a
similar pattern. bHLH101, a basic helix-loop-helix tran-
scription factor, was sharply upregulated on the phenan-
threne, O3, and genotoxicity microarrays, but little
affected by the bacterial infections. AtOPT3, an oligopep-
tide transporter was similarly regulated.
Among the hormone treatment microarrays, the SA
dataset had the strongest correlation with the phenan-
threne data (Spearman correlation ρ = 0.55, Table 1). In
addition to PR-1 and other pathogen resistance (PR)
genes, the phenanthrene microarray identified additional
transcripts that indicate SA involvement. First, ICS1, an
isochorismate synthase involved in SA biosynthesis, is
normally induced by pathogen infection [29] and was
upregulated on phenanthrene (Additional File 1). Second,
the transcript of EDS5 (SID1), a MATE transporter nec-
Table 1: Transcriptional correlations between phenanthrene and other treatments.
Code Treatment Correlation NASC
PHE Phenanthrene (3 w, 3 w) 1.00
bot Botrytis cinerea (4 w, 48 h) 0.72 167
pst P. syringae patovar tomato (5 w, 24 h) 0.71 330
o3 Ozone (2 w, 6 h) 0.67 26
avr P. syringae avrRpm1 (5 w, 24 h) 0.66 120
pha P. syringae phaseolicola (5 w, 24 h) 0.64 120
oss Osmotic stress (2 w, 24 h; shoot) 0.64 139
ps1 P. syringae DC3000 (5 w, 24 h) 0.63 120
sen None; senescence (mid flowering; leaves) 0.62 52
pvi P. syringae ES4326 (4 w, 48 h) 0.60 168
sa Salicylic acid (1 w, 3 h) 0.55 192
eoi Erysiphe orontii (5 w, 5 d) 0.52 169
oxs Oxidative stress (2 w, 24 h; shoot) 0.51 139
ag3 AgNO
3
(1 w, 3 h) 0.48 188
gts Genotoxicity (2 w, 24 h; shoot) 0.46 142
uvs UV radiation (2 w, 24 h; shoot) 0.42 144
tib 2,3,5-triiodobenzoic acid (TIBA; 1 w, 3 h) 0.36 186
pav P. syringae ES4326 avrRpt2 (4 w, 48 h) 0.32 168
iaa Indoleacetic acid (IAA; 1 w, 3 h) 0.27 175
mja Methyl jasmonate (1 w, 3 h) 0.26 174
ga3 Gibberellic aid (1 w, 3 h) 0.20 177
aba Abscisic acid (1 w, 3 h) 0.19 176
ctk Cytokinin (3 w, 3 h) 0.18 181
acc 1-aminocycloprop. 1-carbox. acid (1 w, 3 h) 0.18 172
pac Paclobutrazol (1 w, 12 h) -0.01 185
avg Aminoethoxyvinylglycine (1 w, 3 h) -0.01 188
bra Brassinolide (1 w, 3 h) -0.03 178
css Caesium-137 (shoot; 3 w, 2 w) -0.07 324
Correlations between microarray profiles of 1031 phenanthrene-responsive genes under phenanthrene treatment and 27 other stress and
hormone treatments. Plant age in weeks and duration of treatment are given in parenthesis; whole plant tissue was analyzed if not otherwise
indicated. Correlation represents Spearman correlation (ρ) with the phenanthrene treatment. NASC is the Nottingham Arabidopsis Stock
Centre microarray reference number.
Weisman et al. BMC Plant Biology 2010, 10:59
/>Page 5 of 13
essary for SA signaling, was also upregulated by the PAH
(Additional File 1), and is also induced in the O
3
, ultravio-
let, and some biotic stress datasets. Finally, several SA
early-response transcripts were induced on the phenan-
threne and SA microarrays, including the UDP-glycosyl
transferase UGT1 and GST25.
Low correlations with the phenanthrene treatment
were found for treatments with abscisic acid, the auxin
transport inhibitor triiodobenzoic acid (TIBA), brassino-
lide, cytokinin, the auxin indoleacetic acid, the gibberellic
acid biosynthesis inhibitor paclobutrazol (PAC), the eth-
ylene precursor ACC, and the inhibitor of ethylene bio-
synthesis, aminoethoxyvinylglycine (AVG) (Table 1).
Figure 2 Gene and experiment clustering of phenanthrene microarray dataset. Hierarchical clusterings of genes and experiments, created from
phenanthrene and published Arabidopsis microarray datasets. Values in the Color Key are log
2
(treated/control) microarray intensity values. Experi-
ment codes are listed in Table 1, and the heatmap is detailed further in Additional File 6.
ctk
ga3
bra
avg
css
aba
pac
pav
eoi
oss
pvi
avr
pha
sen
ps1
bot
PHE
pst
uvs
gts
oxs
acc
iaa
mja
ag3
o3
tib
sa
262072_at
50
266993_at
100
246858_at
150
248879_at
200
246214_at
250
258880_at
300
263137_at
350
245011_at
400
254038_at
450
252711_at
500
266551_at
550
258055_at
600
261422_at
650
252181_at
700
254669_at
750
245195_at
800
267247_at
850
252965_at
900
263831_at
950
259992_at
1000
258181_at
−10 0 5
Value
Color Key
Weisman et al. BMC Plant Biology 2010, 10:59
/>Page 6 of 13
However, treatment with AgNO
3
, which inhibits ethylene
signaling [30], correlated noticeably with phenanthrene
(ρ = 0.48). The inconsistency of the two ethylene inhibi-
tors could be due to non-ethylene side-effects of AgNO
3
or AVG. Analyzing the full set of ~23 × 10
3
probes on the
microarray, these two treatments produced a paradoxi-
cally low Spearman correlation coefficient of ρ = 0.21,
thereby supporting a side-effect hypothesis. Furthermore,
the correlation between the AgNO
3
and O
3
microarray
datasets was ρ = 0.60, hinting that silver nitrate induced
oxidative stress. Taken together, these data indicate that
the similarities between phenanthrene and AgNO
3
induced stress responses are not related to perturbed eth-
ylene signaling.
Analyses of transgenic ethylene-responsive GUS-reporter
plants
Ethylene is commonly known as a stress hormone. The
microarray results clearly indicated involvement of ethyl-
ene-regulated genes in the phenanthrene response, but
the downregulated ethylene biosynthesis transcripts
ACO2 and ACS6 suggested that the PAH reduced ethyl-
ene production. At the same time, comparisons of the
phenanthrene data with ethylene inhibition and precur-
sor spike-in datasets (AVG, AgNO
3
, and ACC in Table 1
and Figure 2) suggested that ethylene involvement was
more nuanced than a global up- or down-regulation of
ethylene signaling. To better understand this relationship,
we analysed the role of ethylene under phenanthrene
treatment more closely.
First, to observe localized effects of phenanthrene on
ethylene signaling targets, we used the transgenic
reporter plants CH5B::GUS and AtGSTF2::GUS, which
indicate GUS expression driven by ethylene-inducible
promoters from the bean basic chitinase [31] and
AtGSTF2 genes [19], respectively. Activation of transcrip-
tion from the CH5B promoter in Arabidopsis leaves
requires ethylene signaling through the ethylene receptor
ETR1 [31]. In contrast, while being responsive to ethyl-
ene, the AtGSTF promoter can also be activated through
an ETR1-independent mechanism after treatment with
glutathione, paraquat, copper, and naphthalene acetic
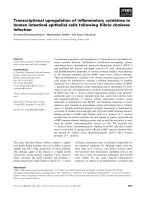
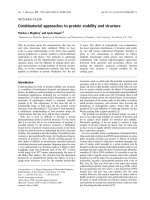
acid (NAA) [19]. Figure 3 shows reporter gene expression
in both lines when grown in long days in the presence of
phenanthrene. In both lines, the reporter expression
occurred in scattered patches on the leaf blades. These
spatial patterns are similar to the patterns of necrotic
lesions induced by phenanthrene [14]. To dissect the con-
tributions of phenanthrene and ethylene in activating
these promoters, the two reporter lines were grown in the
dark for 4 d while treated with combinations of phenan-
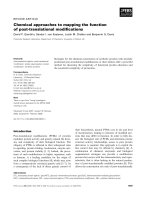
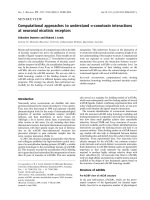
threne and ACC. Figure 4 shows that in both lines, com-
pared to the untreated controls (Figure 4A and 4E), PAH
treatment upregulated GUS expression (Figure 4C and
4G). The treatments with ACC alone (Figure 4B and 4F)
or in combination with phenanthrene (Figure 4D and 4H)
produced similar GUS expression patterns.
Although the histological GUS-assay is not quantita-
tive, the relative intensity of staining can provide mean-
Figure 3 Ethylene reporter gene expression in plants treated
with phenanthrene and grown in long day light. Histochemical
staining of GUS activity in CH5B::GUS (A, B), AtGSTF2::GUS (C, D) trans-
genic Arabidopsis plants in absence (A, C) or presence (B, D) of
phenanthrene. Plants were grown in long days for 14 d. Seedlings were
stained for 15 h for GUS activity in staining buffer containing 2 mM 5-
bromo-4-chloro-3-indolyl-b-D-glucuronide. Scale bars 1 mm.
B
D
AC
Figure 4 Ethylene reporter gene expression in plants treated
with phenanthrene and ACC, and grown in the dark. Histochemi-
cal staining of GUS activity in CH5B::GUS (A-D) and AtGSTF2::GUS (E-H)
transgenic Arabidopsis plants grown for 4 d in the dark. A and E, 0 mM
phenanthrene, 0 μM ACC; B and F, 0 mM phenanthrene, 20 μM ACC; C
and G, 0.25 mM phenanthrene and 0 μM ACC; D and H, 0.25 mM
phenanthrene, 20 μM ACC. Seedlings were stained for 15 h for GUS ac-
tivity in staining buffer containing 2 mM 5-bromo-4-chloro-3-indolyl-
b-D-glucuronide. Scale bars 1 mm.
A
B
C
D
E
F
H
G
A
B
C
D
E
F
H
G
Weisman et al. BMC Plant Biology 2010, 10:59
/>Page 7 of 13
ingful information. When treated with phenanthrene,
GUS expression was generally stronger in AtGSTF2::GUS
plants than in the CH5B::GUS plants (Figure 3 and Figure
4). The strongest GUS activity in CH5B::GUS was due to
ACC treatment (Figure 4B). In contrast, in
AtGSTF2::GUS GUS activity was strongest in plants
exposed to both ACC and phenanthrene (Figure 4H).
Responses of ethylene mutants to phenanthrene treatment
To further determine whether PAH stress involves ethyl-
ene signaling, we compared the phenotypes of several
ethylene mutants to WT Arabidopsis grown on phenan-
threne-containing media. The classic triple response of
dark-grown seedlings grown in the presence of ethylene
produces an exaggerated apical hook, a thickened, short
hypocotyl, and a short root. Utilizing this behavior, ethyl-
ene signaling mutants and WT were grown in the dark to
examine how the mutations affected phenanthrene-
induced growth responses in seedlings. The mutants
included the ethylene overproducer eto3 [32]; the ethyl-
ene-insensitive gain-of-function receptor mutant etr1-4
[33]; the mutant etr1-7 [34,35] which exhibits slightly
enhanced ethylene sensitivity, and the etr1-6;etr2-3;ein4-
4 [34] triple ethylene receptor mutant which exhibits
constitutive ethylene signaling. Because the WT and eth-
ylene signaling mutants differ in root and shoot lengths
even under control conditions, absolute length compari-
sons under phenanthrene treatment are not meaningful
between genotypes. To facilitate comparison, the relative
length change within each genotype was defined as the
ratio (%) of phenanthrene-treated length to non-treated
length. These response ratios were then compared
between the genotypes.
Figure 5 shows phenanthrene-induced hypocotyl
growth responses in dark-grown seedlings. Phenanthrene
treatment reduced hypocotyl elongation in all plants
except in eto3, in which hypocotyl length was unaffected.
As a baseline, the hypocotyls of WT were 12.0 ± 0.2 mm
long on control medium, and 7.9 ± 0.1 mm long on 0.5
mM phenanthrene, giving a response ratio of 66 ± 1.3%.
In the ethylene-overproduction mutant eto3, the length-
reducing effect of phenanthrene was mitigated, produc-
ing hypocotyls as long as in the untreated control. Con-
versely, etr1-4, the ethylene-insensitive mutant grew to
only 40 ± 4.8% of the length of the untreated mutant. The
genotypes etr1-7 (response 60 ± 7.6%) and etr1-6;etr2-
3;ein4-4 (response 67 ± 2.2%) did not differ significantly
from WT in their hypocotyl responses to phenanthrene.
Root growth of phenanthrene-treated mutants differed
markedly from the hypocotyl responses (Figure 6). Con-
trasting with the hypocotyl, root elongation of dark-
grown WT was only marginally affected by phenan-
threne, and the etr1-7 mutant was unaffected. Surpris-
ingly, eto3 (response 174 ± 12%) and the triple mutant
etr1-6;etr2-3;ein4-4 (response 187 ± 7.4%) grew even lon-
ger roots on phenanthrene than on control medium. In
contrast, etr1-4 roots were significantly shorter on
phenanthrene than on control medium (response 44 ±
4.7%).
Discussion
Broadly, the response of Arabidopsis to phenanthrene is a
complex perturbation of multiple systems, with a domi-
nant theme of oxidative stress and similarities to patho-
genic responses.
Phenanthrene induces oxidative stress and a metabolic
shift from anabolism to catabolism
Consistent with physiological studies that associated
PAH treatment with oxidative stress [10-12,14], tran-
scripts related to oxidative stress were overrepresented
among the phenanthrene responsive genes (Additional
Figure 5 Hypocotyl lengths of ethylene mutants treated with
phenanthrene. Hypocotyl length of 4 d old Arabidopsis seedlings
grown in absence or presence of phenanthrene in the dark. Top: Mean
root lengths with standard error bars. Bottom: Response (%) is the ratio
of root length on phenanthrene to root length without phenanthrene
treatment. Bars represent mean ± error (see Methods section for calcu-
lation). Horizontal, dashed lines mark the error range for Columbia WT.
At least ten seedlings were measured for each treatment and geno-
type.
0
2
4
6
8
10
12
14
16
Length (mm)
20
40
60
80
100
Response (%)
0 mM phen
0.5 mM phen
col eto3 etr1-4 etr1-7 etr1-6x
etr2-3x
ein4-4
Weisman et al. BMC Plant Biology 2010, 10:59
/>Page 8 of 13
File 3 and Additional File 4e). In addition, polyamine lev-
els and ADC enzyme activity were reported to increase in
the aquatic plant Riccia fluitans when treated with
phenanthrene [12], which is consistent with the present
data that indicate an upregulation of ADC2 mRNA.
At the systemic level, the microarray results bear strong
resemblance to the transcriptional responses induced by
fungal, bacterial pathogen, ozone or osmotic shock treat-
ments (Figure 1, Figure 2, Table 1, and Additional File 4e).
As the phenanthrene-treated plants were grown in sterile
conditions, it is unlikely that the similarities to pathogen
treatments were caused by confounding microbial effects.
More likely, the unifying theme of these treatments is the
production of ROS [15,36-40]. Following the initial oxida-
tive burst, PAH-treated plants activate mechanisms simi-
lar to a pathogen defense including HR-like cell death
[14] and induction of a battery of defense genes.
Similar responses have been described in ozone-treated
plants, which also generate ROS and erroneously activate
pathogen defense programs [15]. However, while oxida-
tive stress was occurring under phenanthrene treatment,
several antioxidant genes were downregulated. This sce-
nario can occur when plants invoke a positive feedback
loop that amplifies ROS to serve as signaling molecules
[28,41]. An early perturbation of the redox network is
clear as downregulation of catalase mRNA [10], as well as
increased H
2
O
2
levels and cell death [14], were detected
within 12 h of PAH treatment. Along similar lines, prior
work in Arabidopsis found CAT2 downregulated within
three hours of O
3
treatment [42]. Supporting the notion
of ROS positive feedback activation, the respiratory burst
oxidase AtRbohD was upregulated in phenanthrene-
treated plants (Additional File 5), and was similarly
upregulated by O
3
and pathogenic attack conditions. Sim-
ilarly, the tobacco ortholog NtrbohD was induced during
an oxidative burst under O
3
treatment [15]. The wide-
spread destruction of chloroplast and mitochondrial
membranes [10] may have injected additional ROS into
the system.
PAH treatment caused downregulation of genes
involved in photosynthesis and protein biosynthesis
(Additional File 3 and Additional File 4a), which agrees
with previous studies reporting overall diminished plant
size and reduced chlorophyll levels [10,14]. Up-regulation
of glycolysis and the citric acid cycle (Additional File 3
and Additional File 4a), as well as the similarity to the
senescence microarray data (Table 1, Figure 2), further
reveal a major metabolic shift from anabolism to catabo-
lism. In addition, growth inhibition and the breakdown of
the photosynthetic machinery are commonly observed
ethylene effects [16].
Phenanthrene interferes with hormone signaling networks
Results presented here suggest that the complex physio-
logical PAH stress symptoms likely involve multiple hor-
mone pathways, including SA, ethylene, JA, and abscisic
acid (ABA). Furthermore, the GUS expression patterns in
phenanthrene-treated CH5B::GUS and AtGSTF2::GUS
lines suggest that ethylene and SA levels are locally ele-
vated in PAH-stressed plant tissues (Figure 3 and Figure
4). The spatial patterns in leaves resemble previous obser-
vations of phenanthrene-induced, localized cell death and
H
2
O
2
accumulation [14], supporting the hypothesis that,
in addition to SA, ethylene is involved in the development
of the PAH symptoms. Interestingly, reporter activity was
consistently more pronounced in PAH-treated
AtGSTF2::GUS than in the CH5B::GUS transgenic plants
(Figure 3 and Figure 4). This difference in GUS expression
may be caused by a differential ethylene sensitivity of the
two promoters. This explanation is plausible as the CH5B
promoter in transgenic Arabidopsis leaves is approxi-
mately an order of magnitude less sensitive to ethylene
than the endogenous basic chitinase promoter [31]. A
further explanation for the differential reporter levels is
that the two transcriptional programs involve other sig-
Figure 6 Root lengths of ethylene mutants treated with phenan-
threne. Root length of 4-day old Arabidopsis seedlings grown in ab-
sence or presence of phenanthrene in the dark. For further
explanations, see Figure 5 legend.
0
4
8
12
16
20
Length (mm)
0
40
80
120
160
Response (%)
0 mM phen
0.5 mM phen
col eto3 etr1-4 etr1-7 etr1-6x
etr2-3x
ein4-4
Weisman et al. BMC Plant Biology 2010, 10:59
/>Page 9 of 13
nals in addition to ethylene [19,31]. Indeed, SA signaling
is necessary for strong AtGSTF2 induction by ethylene
[43].
Analyses of quantitative growth responses of dark-
grown ethylene mutants exposed to phenanthrene
revealed further interesting interactions between
phenanthrene and ethylene signaling. Without PAH, the
ethylene overproducer eto3 and the constitutively-signal-
ing triple mutant grew short hypocotyls and roots, con-
sistent with the standard model of ethylene-induced
growth reduction. However, when treated with phenan-
threne, these two lines grew longer roots than on control
medium, suggesting that the treatment inhibits ethylene
signal transduction. This hypothesis is supported by the
observations that the exaggerated apical hook, which is
typical in ACC-treated dark-grown plants (Figure 4B and
4F), was absent in PAH-treated plants (Figure 4D and
4H). This phenotype was frequently observed in WT
plants treated with both ACC and phenanthrene (not
shown). The observation that typical triple-response
symptoms were attenuated under phenanthrene treat-
ment suggests that the PAH negatively interferes with the
ethylene signal transduction pathway or with ethylene
biosynthesis in conditions of elevated ethylene levels or
signaling. It has been proposed that ethylene can exhibit
inhibiting or stimulating effect on growth, depending on
the ethylene concentration [16]. Furthermore, the ethyl-
ene-insensitive etr1-4 mutant responded to the PAH with
significantly stronger growth inhibition than the WT.
This result clearly shows that the phenanthrene-induced
growth reduction does not require ethylene signaling
through the ETR1 receptor. Taken together, the mutant
experiments suggest that ethylene is not required for the
development of some of the PAH stress symptoms, and,
phenanthrene inhibits some ethylene responses under
conditions of elevated ethylene levels.
Integrated model of PAH response in Arabidopsis
With these and previous results taken in total, we pro-
pose a model of the PAH response in plants. Shortly fol-
lowing uptake, the PAH molecules may be oxidized by
mono- or dioxygenases into reactive compounds. An
analogous biochemical process occurs in animals, cata-
lyzed by cytochrome P450s [44,45], producing toxic and
mutagenic electrophiles. ROS deriving from PAH oxida-
tion would increase the overall ROS level, and thereby
contribute towards activation of ROS-dependent signal-
ing pathways. Alternatively, the PAH molecule may be
directly recognized by a receptor such as a PAS-domain
protein, a large and widely-distributed class of environ-
mental sensors that includes the vertebrate aryl hydrocar-
bon receptor [46,47]. The strong similarities to biotic
stress also suggest that the PAH could be cross-reacting
with a pathogen recognition system. Regardless of the ini-
tial mechanism of action, the hormones SA, ethylene, and
JA appear to be involved in the response, and other
unidentified signals also are likely relevant. Finally, the
oxidized intermediates can be conjugated with a sugar or
glutathione, and sequestered into the vacuole or cell wall.
The initial PAH or its downstream products have been
shown to accumulate in trichomes and other epidermal
cells [14], although the recognition and transport mecha-
nisms remain unknown.
Additional studies will help elucidate causality in the
complex PAH stress response. It would be instructive to
perform high-resolution time-series experiments to mea-
sure transcripts implicated in the earliest modes of
action, as well as direct measurement of hormone levels.
In addition, it would be valuable to perform tissue-spe-
cific molecular and enzyme assays, particularly of the
zones implicated by the positive GUS results and necrotic
areas. Furthermore, in addition to the ethylene mutants,
the PAH response in other signaling mutants should be
analysed.
Even though many remaining questions surround PAH
stress, the microarray data provide a number of leads for
improving PAH phytoremediation. Relaxing the rate- and
capacity-limiting bottlenecks in the PAH detoxification
pathway would reduce the cytoplasmic concentration of
PAHs, thereby decreasing the effective toxicity to the
plant and allowing increased uptake of the pollutant. For
example, further increasing GST and UGT protein levels,
or artificially up-regulating vacuolar transporters of con-
jugated xenobiotics, may produce plants with improved
phytoremediation capabilities. The present results, as
well as the suggested follow-on research, will be of great
value in breeding and engineering plants for phytoreme-
diation of polycyclic aromatic hydrocarbons.
Conclusions
The microarray experiments and comparative analyses
show that phenanthrene treatment of Arabidopsis
induces oxidative stress networks, closely resembling
pathogen defense programs. A battery of altered tran-
scripts revealed perturbations of the ROS, HR, and SAR
systems. The present data support the hypothesis that the
hormones SA, ethylene, and JA are involved in PAH
response. In total, the results provide a large number of
new pathway targets for researching and engineering
plants for PAH phytoremediation.
Methods
Plants and Growth Conditions
Seeds of the Arabidopsis ecotype Colombia were
obtained from Arabidopsis Research Centre and used as
the WT control in all experiments. Seeds of the mutants
eto3, etr1-7, etr1-4, and etr1-6;etr2-3;ein4-4 were a gift
from Eric Schaller or were obtained from ABRC. Seeds of
Weisman et al. BMC Plant Biology 2010, 10:59
/>Page 10 of 13
AtGSTF2::GUS fusion plants [19] were a gift from Peter
Goldsbrough. Seeds of bean basic chitinase CH5B::GUS
fusion plants [31] were a gift from Sara Patterson.
Seeds were surface-sterilized, stratified, and placed in
Petri dishes containing half-strength Murashige and
Skoog medium, supplemented with sucrose and 0, 0.25 or
0.5 mM of phenanthrene, as described previously [14].
ACC was added to the growth medium in appropriate
amounts before autoclaving. Plants were grown at 23 ±
1°C either in the dark or under long-day conditions (16/8
h photoperiod at approximately 130 μmol photons m
-2
s
-1
)
for 4-21 d as indicated in the text. Before plates were put
in darkness, they were exposed to white light for 10-12 h
to achieve uniform germination. When root or hypocotyl
lengths were to be measured, plates were kept in vertical
orientation. Each plate contained seeds of the WT
Columbia and at least of one mutant. Plants were
observed under a Zeiss 2000-C dissection microscope
equipped with an Olympus 340 digital camera.
All experiments were conducted at least twice with
each mutant, with at least ten plants of each genotype per
treatment.
DNA Microarray Analysis
PAH treated (0.25 mM phenanthrene) and control plants
(0 mM phenanthrene) were grown under long days and
harvested at 21 d, and at least 20 plants were pooled and
stored at -80°C. 500 mg tissue was removed from each
pool and RNA was isolated using TRIzol (Molecular
Research Center) per the manufacturer's instructions.
Resulting samples were treated with DNase I (Invitrogen)
and purified with RNeasy Mini Cleanup (Qiagen) per the
manufacturers' instructions. Labeling was performed
with the Affymetrix Enzo kit and processed on a Affyme-
trix Fluidics Station Model 450. Hybridized chips were
read on a model M10 scanner.
Two rounds of biological replication were analyzed. In
the first replicate, treated and control samples were each
run on one Affymetrix ATH1-121501 microarray. In the
second biological replicate, the treated sample was
applied to one microarray, and the control sample was
applied to two microarrays as a technical replicate. See
Additional File 7, Additional File 8, and Additional File 9
for further technical details on the microarray experi-
ment.
Validating the microarray data, previous RT-PCR anal-
ysis of actin-7, eif4a, PR-1, PDF1.2b, and AtEXP8 [14]
(and unpublished data) are consistent with the present
results. In addition, using RT-qPCR with four replicates
per reaction and actin-7 as a reference, we validated that
the differential responses for GSTF6 and PR-1 are consis-
tent with the microarray dataset (data not shown).
Bioinformatic Analyses
Data analysis was performed in R version 2.9.2 [48] and
Bioconductor version 2.4.1 [49] installed on x86 hard-
ware running Debian Linux Version 5.0. All of the proce-
dures below were scripted in R and Python software
written for this project.
To determine differential expression of the phenan-
threne microarray dataset, the Affymetrix .CEL files were
normalized by the Bioconductor just.gcrma algo-
rithm using default parameters [50]. To reduce the false
discovery rate, nonspecific prefiltering was performed
using the Bioconductor genefilter package, eliminating
probes with raw signal intensity less than 100 on all
microarrays, and eliminating probes with an interquartile
intensity ratio of less than 1.41 across the microarrays.
The prefiltered set was then tested for statistical signifi-
cance by a linear model using Limma [51], corrected for
multiple comparisons with a Benjamini and Hochberg
false discovery rate limit of 0.05. To identify genes with
putative biological significance, probes with differential
expression ratios greater than 2-fold up or 2-fold down
were preserved, and these remaining probes were defined
as the set of 1031 differentially-expressed, phenanthrene
responsive genes used in subsequent analysis. The
Affymetrix probe identifiers were mapped to Arabidopsis
Genome Identifiers (AGIs), symbols, and annotations
using the ath1121501.db metadata in Bioconductor.
To compare the phenanthrene microarray data with
published microarray data, Affymetrix ATH1 .CEL files
were obtained from the AffyWatch service of the Not-
tingham Arabidopsis Stock Centre -
bidopsis.info. The published .CEL files and our
phenanthrene .CEL files were normalized together using
just.gcrma as described above. To perform the hierar-
chical clustering shown by the heatmap, Kendall tau cor-
relation matrices between genes and experiments were
computed, and complete linkage clustering was com-
puted by the R hclust function. The resulting cluster-
ing was visualized by the R heatmap.2 algorithm.
Gene ontology analysis for overrepresented biological
process (BP) terms was performed with the GOstats
package of Bioconductor [52]. The set of 1031 differen-
tially-expressed probes was partitioned into up-regulated
and down-regulated subsets, and their Affymetrix probe
identifiers were mapped to Arabidopsis Genome Identifi-
ers (AGI). These AGI sets were tested against the uni-
verse of probed AGIs using the hyperGTest function,
using a p-value cutoff of 0.05 and with the conditional
scoring algorithm enabled.
MapMan [53] maps were produced to visualize cellular
processes affected by the phenanthrene treatment. log
2
-
transformed mean differences between transcript signals
Weisman et al. BMC Plant Biology 2010, 10:59
/>Page 11 of 13
in phenanthrene-treated and control microarrays served
as input to MapMan.
Root and Shoot Measurements
Root and shoot lengths were measured on digital photo-
graphs using NIH ImageJ v 1.3.1_13 software [54]. In
each experiment phenanthrene response percentage (R)
of a genotype was calculated as R = 100 × (AV E
p
/AV E
c
),
where AV E
p
is the mean organ length in phenanthrene
treatment and AV E
c
is the mean organ length in control
(i.e., in absence of phenanthrene). Error of R (RE) was cal-
culated as , where
δ
c
and δ
p
are standard deviations of organ length in con-
trol and phenanthrene treatment, respectively; n
c
and n
p
are numbers of roots or hypocotyls measured in control
and phenanthrene treatment, respectively. In the root
and hypocotyl length assay mutant's response to phenan-
threne R
m
was considered significantly different from the
WT response (R [wt]), if the intervals [R
wt
- RE
wt
, R
wt
+
RE
wt
] for the WT, and [R
m
- RE
m
, R
m
+ RE
m
] for the
mutant, did not overlap.
Histochemistry
GUS-staining was performed as described by [55]. To
facilitate relative comparisons of reporter activity, identi-
cal GUS staining conditions were used in all experiments.
For all histochemical methods whole plants or shoots
were photographed under a Zeiss 2000-C dissecting
microscope equipped with an Olympus 340 digital cam-
era before and after staining. Images representative of at
least ten plants per treatment and experiment are shown
in Figure 3 and Figure 4.
Additional material
Authors' contributions
DW performed the microarray experiments and bioinformatics analyses. MA
performed the mutant growth and histochemistry experiments. DW and MA
contributed equally to this work. ACC conceived of the studies and contrib-
uted to the planning and oversight of the experiments. All authors contributed
to the data analysis and composition of the manuscript.
Acknowledgements
This work was supported by the University of Massachusetts Boston, and by a
Joint Interagency Program on Phytoremediation Research grant from the
National Science Foundation (grant no. IBN-0343856) to ACC. We thank Roder-
ick Jensen for helpful discussions and his laboratory at University of Massachu-
setts Boston for carrying out the labeling, hybridization and scanning
procedures of the microarray experiment.
Author Details
1
Department of Biology, University of Massachusetts Boston, 100 Morrissey
Blvd, Boston, MA 02125, USA and
2
Institute of Biological Production Systems,
Fruit Science Section, Leibniz University Hannover, Herrenhäuser Str 2, D-30419
Hannover, Germany
References
1. Meudec A, Poupart N, Dussauze J, Deslandes E: Relationship between
heavy fuel oil phytotoxicity and polycyclic aromatic hydrocarbon
contamination in Salicornia fragilis. Sci Total Environ 2007, 381:146-156.
2. Oros DR, Ross JRM, Spies RB, Mumley T: Polycyclic aromatic hydrocarbon
(PAH) contamination in San Francisco Bay: a 10-year retrospective of
monitoring in an urbanized estuary. Environ Res 2007, 105:101-118.
Additional file 1 Full microarray dataset. This .csv file contains the full,
non-prefiltered microarray experiment dataset. All values were log
2
trans-
formed before calculations. Ratio, replicate means, and p-values were com-
puted by the Bioconductor limma package.
Additional file 2 Differentially-expressed transcripts. This .csv file con-
tains the set of 1031 differentially-expressed transcripts, computed as
described in the Methods section. Ratio values are log
2
transformed.
Additional file 3 Gene Ontology Summary. This .html file describes the
results of the gene ontology analysis, performed separately on the sets of
differentially-expressed upregulated and downregulated transcripts. The
diffExpr column represents the log
2
transformed values.
RE R
c
n
c
AVE
c
p
n
p
AVE
p
=× +
⎛
⎝
⎜
⎜
⎞
⎠
⎟
⎟
⎛
⎝
⎜
⎜
⎞
⎠
⎟
⎟
d
d
/
/
2
2
Additional file 4 MapMan illustrations of phenanthrene-responsive
cellular processes and pathways. Phenanthrene responsive cellular pro-
cesses and pathways in Arabidopsis. MapMan illustrations of transcripts in
plants grown on 0.25 mM phenanthrene for 21 d as compared to transcript
levels in untreated control plants. Figure a: Overview of metabolism; Figure
b: Overview of photosynthesis; Figure c: Overview of carotenoid biosynthe-
sis; Figure d: Overview of protein targeting; Figure e: Overview of cellular
responses; Figure f: Overview of gene regulation. Signal colors: Red down-
regulated, blue, upregulated transcripts in phenanthrene-treated plants.
Scale values represent the differences between the mean log
2
-transformed
values of the treated and untreated microarray sets.
Additional file 5 Phenanthrene induced changes in gene expression.
Arabidopsis seedlings were grown in absence (CTR) or presence (PHE) of
0.25 mM phenanthrene for 21 days and total RNA was extracted. Microarray
analysis was carried out as described in the Methods section. Columns CTR
(mean microarray signal from control plants), PHE (mean microarray signal
from phenanthrene-treated plants), and Fold-change (PHE/CTR) are log
2
transformed.
Additional file 6 Heatmap gene details. This .html file details the con-
tents of Figure 2. Prior to clustering, the full set of microarrays was batch-
normalized as described in the Methods section; consequently, the
phenanthrene experiment microarray values in this file differ slightly from
the values elsewhere in this report.
Additional file 7 Microarray quality control analysis. This file contains a
quality control analysis of the raw microarray data used in this study. The
analysis was produced using the Bioconductor package arrayQualityMet-
rics. Jun04 no phe.cel Jun04 phe.cel represent the untreated control and
phenanthrene-treated samples, respectively, of the first replicate experi-
ment. From the second replicate experiment, Aug04_no_phe_A.cel and
Aug04_no_phe_C.cel represent the control, and Aug04_phe_B.cel repre-
sents the treated sample.
Additional file 8 Microarray volcano plot. The volcano plot represents
the dataset from the five microarray chips after gcRMA normalization and
linear model processing by the Bioconductor limma package.
Additional file 9 Minimum information about a microarray experi-
ment (MIAME) checklist. The minimum information about a microarray
experiment (MIAME) data is supplied in Additional File 9.
Received: 2 October 2009 Accepted: 7 April 2010
Published: 7 April 2010
This article is available from: 2010 Weisman et al; licensee BioMed Central Ltd. This is an Open Access article distributed under the terms of the Creative Commons Attribution License ( which permits unrestricted use, distribution, and reproduction in any medium, provided the original work is properly cited.BMC Plant Biolog y 2010, 10:59
Weisman et al. BMC Plant Biology 2010, 10:59
/>Page 12 of 13
3. Luch A: Nature and nurture - Lessons from chemical carcinogenesis.
Nat Rev Cancer 2005, 5:113-125.
4. US Dept of Health and Human Services, Public Health Service, National
Toxicology Program: Report on carcinogens. 2005 [http://
ntp.niehs.nih.gov/ntp/roc/eleventh/profiles/s150pah.pdf].
5. Pilon-Smits E: Phytoremediation. Annu Rev Plant Biol 2005, 56:15-39.
6. Harvey PJ, Campanella BF, Castro PML, Harms H, Lichtfouse E, Schäffner
AR, Smrcek S, Werck-Reichhart D: Phytoremediation of polyaromatic
hydrocarbons, anilines and phenols. Environ Sci Pollut Res Int 2002,
9:29-47.
7. Dhankher OP, Li Y, Rosen BP, Shi J, Salt D, Senecoff JF, Sashti NA, Meagher
RB: Engineering tolerance and hyperaccumulation of arsenic in plants
by combining arsenate reductase and gamma-glutamylcysteine
synthetase expression. Nat Biotechnol 2002, 20:1140-1145.
8. Li Y, Dankher OP, Carreira L, Smith AP, Meagher RB: The shoot-specific
expression of gamma-glutamylcysteine synthetase directs the long-
distance transport of thiol-peptides to roots conferring tolerance to
mercury and arsenic. Plant Physiol 2006, 141:288-298.
9. Dhankher OP, Rosen BP, McKinney EC, Meagher RB: Hyperaccumulation
of arsenic in the shoots of Arabidopsis silenced for arsenate reductase
(ACR2). Proc Natl Acad Sci USA 2006, 103:5413-5418.
10. Liu H, Weisman D, Ye Y, Cui B, Huang Y, Wang Z: An oxidative stress
response to polycyclic aromatic hydrocarbon exposure is rapid and
complex in Arabidopsis thaliana. Plant Sci 2009, 176:375-382.
11. Paskova V, Hilscherova K, Feldmannova M, Blaha L: Toxic effects and
oxidative stress in higher plants exposed to polycyclic aromatic
hydrocarbons and their N-heterocyclic derivatives. Environ Toxicol
Chem 2006, 25:3238-3245.
12. Burritt DJ: The polycyclic aromatic hydrocarbon phenanthrene causes
oxidative stress and alters polyamine metabolism in the aquatic
liverwort Riccia fluitans L. Plant Cell Environ 2008, 31:1416-1431.
13. Gao Y, Zhu L: Plant uptake, accumulation and translocation of
phenanthrene and pyrene in soils. Chemosphere 2004, 55:1169-1178.
14. Alkio M, Tabuchi TM, Wang XC, Colon-Carmona A: Stress responses to
polycyclic aromatic hydrocarbons in Arabidopsis include growth
inhibition and hypersensitive response-like symptoms. J Exp Bot 2005,
56:2983-2994.
15. Langebartels C, Wohlgemuth H, Kschieschan S, Grün S, Sandermann H:
Oxidative burst and cell death in ozone-exposed plants. Plant Physiol
Biochem 2002, 40:567-575.
16. Pierik R, Tholen D, Poorter H, Visser EJW, Voesenek LACJ: The Janus face of
ethylene: growth inhibition and stimulation. Trends Plant Sci 2006,
11:176-183.
17. Broekaert WF, Delauré SL, Bolle MFCD, Cammue BPA: The role of ethylene
in host-pathogen interactions. Annu Rev Phytopathol 2006, 44:393-416.
18. Lin Z, Zhong S, Grierson D: Recent advances in ethylene research. J Exp
Bot 2009, 60:3311-3336.
19. Smith AP, Nourizadeh SD, Peer WA, Xu JH, Bandyopadhyay A, Murphy AS,
Goldsbrough PB: Arabidopsis AtGSTF2 is regulated by ethylene and
auxin, and encodes a glutathione S-transferase that interacts with
flavonoids. Plant J 2003, 36:433-442.
20. Potter S, Uknes S, Lawton K, Winter AM, Chandler D, Dimaio J, Novitzky R,
Ward E, Ryals J: Regulation of a hevein-like gene in Arabidopsis. Mol
Plant Microbe Interact 1993, 6:680-685.
21. Penninckx I, Eggermont K, Terras FRG, Thomma B, DeSamblanx GW,
Buchala A, Metraux JP, Manners JM, Broekaert WF: Pathogen-induced
systemic activation of a plant defensin gene in Arabidopsis follows a
salicylic acid-independent pathway. Plant Cell 1996, 8:2309-2323.
22. Marrs KA: The functions and regulation of glutathione S-transferases in
plants. Annu Rev Plant Physiol Plant Mol Biol 1996, 47:127-158.
23. Wagner U, Edwards R, Dixon DP, Mauch F: Probing the diversity of the
Arabidopsis glutathione S-transferase gene family. Plant Mol Biol 2002,
49:515-532.
24. Mezzari MP, Walters K, Jelínkova M, Shih MC, Just CL, Schnoor JL: Gene
expression and microscopic analysis of Arabidopsis exposed to
chloroacetanilide herbicides and explosive compounds. A
phytoremediation approach. Plant Physiol 2005, 138:858-869.
25. Gadjev I, Vanderauwera S, Gechev TS, Laloi C, Minkov IN, Shulaev V, Apel K,
Inzé D, Mittler R, Breusegem FV: Transcriptomic footprints disclose
specificity of reactive oxygen species signaling in Arabidopsis. Plant
Physiol 2006, 141:436-445.
26. Iida K, Seki M, Sakurai T, Satou M, Akiyama K, Toyoda T, Konagaya A,
Shinozaki K: RARTF: Database and tools for complete sets of
Arabidopsis transcription factors. DNA Res 2005, 12:247-256.
27. Lorenzo O, Piqueras R, Sanchez-Serrano JJ, Solano R: Ethylene response
factor 1 integrates signals from ethylene and jasmonate pathways in
plant defense. Plant Cell 2003, 15:165-178.
28. Miller G, Shulaev V, Mittler R: Reactive oxygen signaling and abiotic
stress. Physiol Plant 2008, 133:481-489.
29. Durrant WE, Dong X: Systemic acquired resistance. Annu Rev
Phytopathol 2004, 42:185-209.
30. Rodríguez FI, Esch JJ, Hall AE, Binder BM, Schaller GE, Bleecker AB: A
copper cofactor for the ethylene receptor ETR1 from Arabidopsis.
Science 1999, 283:996-998.
31. Chen QHG, Bleecker AB: Analysis of ethylene signal-transduction
kinetics associated with seedling-growth response and chitinase
induction in wild-type and mutant Arabidopsis. Plant Physiol 1995,
108:597-607.
32. Woeste KE, Ye C, Kieber JJ: Two Arabidopsis mutants that overproduce
ethylene are affected in the posttranscriptional regulation of 1-
aminocyclopropane-1-carboxylic acid synthase. Plant Physiol 1999,
119:521-530.
33. Hall AE, Grace Chen Q, Findell JL, Eric Schaller G, Bleecker AB: The
relationship between ethylene binding and dominant insensitivity
conferred by mutant forms of the etr1 ethylene receptor. Plant Physiol
1999, 121:291-300.
34. Hua J, Meyerowitz EM: Ethylene responses are negatively regulated by a
receptor gene family in Arabidopsis thaliana. Cell 1998, 94:261-271.
35. Cancel JD, Larsen PB: Loss-of-function mutations in the ethylene
receptor ETR1 cause enhanced sensitivity and exaggerated response
to ethylene in Arabidopsis. Plant Physiol 2002, 129:1557-1567.
36. Tosti N, Pasqualini S, Borgogni A, Ederli L, Falistocco E, Crispi S, Paolocci F:
Gene expression profiles of O3-treated Arabidopsis plants. Plant Cell
Environ 2006, 29:1686-1702.
37. Wohlgemuth H, Mittelstrass K, Kschieschan S, Bender J, Weigel H,
Overmyer K, Kangasjärvi J, Sandermann H, Langebartels C: Activation of
an oxidative burst is a general feature of sensitive plants exposed to
the air pollutant ozone. Plant Cell Environ 2002, 25:717-726.
38. Xiong L, Zhu JK: Molecular and genetic aspects of plant responses to
osmotic stress. Plant Cell Environ 2002, 25:131-139.
39. Mahalingam R, Fedoroff N: Stress response, cell death and signalling:
the many faces of reactive oxygen species. Physiol Plant 2003,
119:56-68.
40. Kotchoni SO, Gachomo EW: The reactive oxygen species network
pathways:an essential prerequisite for perception of pathogen attack
and the acquired disease resistance in plants. J Biosci 2006, 31:389-404.
41. Overmyer K, Brosché M, Kangasjärvi J: Reactive oxygen species and
hormonal control of cell death. Trends Plant Sci 2003, 8:335-342.
42. Ludwikow A, Gallois P, Sadowski J: Ozone-induced oxidative stress
response in Arabidopsis: transcription profiling by microarray
approach. Cell Mol Biol Lett 2004, 9:829-842.
43. Lieberherr D, Wagner U, Dubuis PH, Métraux JP, Mauch F: The rapid
induction of glutathione S-transferases AtGSTF2 and AtGSTF6 by
avirulent Pseudomonas syringae is the result of combined salicylic acid
and ethylene signaling. Plant Cell Physiol 2003, 44:750-757.
44. Nota B, Bosse M, Ylstra B, van Straalen NM, Roelofs D: Transcriptomics
reveals extensive inducible biotransformation in the soil-dwelling
invertebrate Folsomia candida exposed to phenanthrene. BMC
Genomics 2009, 10:236.
45. Baird WM, Hooven LA, Mahadevan B: Carcinogenic polycyclic aromatic
hydrocarbon-DNA adducts and mechanism of action. Environ Mol
Mutagen 2005, 45:106-114.
46. Hefti MH, Francoijs KJ, de Vries SC, Dixon R, Vervoort J: The PAS fold. A
redefinition of the PAS domain based upon structural prediction. Eur J
Biochem 2004, 271:1198-1208.
47. Gu YZ, Hogenesch JB, Bradfield CA: The PAS superfamily: sensors of
environmental and developmental signals. Annu Rev Pharmacol Toxicol
2000, 40:519-561.
48. R Development Core Team: R: A Language and Environment for Statistical
Computing 2009 []. R Foundation for Statistical
Computing, Vienna, Austria [ISBN 3-900051-07-0].
49. Gentleman RC, Carey VJ, Bates DM, Bolstad B, Dettling M, Dudoit S, Ellis B,
Gautier L, Ge Y, Gentry J, Hornik K, Hothorn T, Huber W, Iacus S, Irizarry R,
Weisman et al. BMC Plant Biology 2010, 10:59
/>Page 13 of 13
Leisch F, Li C, Maechler M, Rossini AJ, Sawitzki G, Smith C, Smyth G, Tierney
L, Yang JY, Zhang J: Bioconductor: open software development for
computational biology and bioinformatics. Genome Biol 2004, 5:R80.
50. Wu Z, Irizarry RA, Gentleman R, Martinez-Murillo F, Spencer F: A model-
based background adjustment for oligonucleotide expression arrays. J
Am Stat Assoc 2004, 99:909-917.
51. Smyth GK: Linear models and empirical bayes methods for assessing
differential expression in microarray experiments. Stat Appl Genet Mol
Biol 2004, 3:Article3.
52. Falcon S, Gentleman R: Using GOstats to test gene lists for GO term
association. Bioinformatics 2007, 23:257-258.
53. Thimm O, Bläsing O, Gibon Y, Nagel A, Meyer S, Krüger P, Selbig J, Müller
LA, Rhee SY, Stitt M: MAPMAN: a user-driven tool to display genomics
data sets onto diagrams of metabolic pathways and other biological
processes. Plant J 2004, 37:914-939.
54. Rasband W: ImageJ: Image Processing and Analysis in Java. 2004 [http:/
/rsb.info.nih.gov/ij/]. National Institutes of Health, Bethesda, Maryland,
USA
55. Jefferson RA, Kavanagh TA, Bevan MW: Gus fusions - beta-glucuronidase
as a sensitive and versatile gene fusion marker in higher-plants. Embo
Journal 1987, 6:3901-3907.
doi: 10.1186/1471-2229-10-59
Cite this article as: Weisman et al., Transcriptional responses to polycyclic
aromatic hydrocarbon-induced stress in Arabidopsis thaliana reveal the
involvement of hormone and defense signaling pathways BMC Plant Biology
2010, 10:59