Báo cáo y học: " Influenza A viral loads in respiratory samples collected from patients infected with pandemic H1N1, seasonal H1N1 and H3N2 viruses" pdf
Bạn đang xem bản rút gọn của tài liệu. Xem và tải ngay bản đầy đủ của tài liệu tại đây (972.95 KB, 7 trang )
Ngaosuwankul et al. Virology Journal 2010, 7:75
/>Open Access
RESEARCH
BioMed Central
© 2010 Ngaosuwankul et al; licensee BioMed Central Ltd. This is an Open Access article distributed under the terms of the Creative Com-
mons Attribution License ( which permits unrestricted use, distribution, and reproduc-
tion in any medium, provided the original work is properly cited.
Research
Influenza A viral loads in respiratory samples
collected from patients infected with pandemic
H1N1, seasonal H1N1 and H3N2 viruses
Nathamon Ngaosuwankul
1
, Pirom Noisumdaeng
1
, Pisut Komolsiri
1
, Phisanu Pooruk
1
, Kulkanya Chokephaibulkit
2
,
Tawee Chotpitayasunondh
3
, Chariya Sangsajja
4
, Charoen Chuchottaworn
5
, Jeremy Farrar
6
and
Pilaipan Puthavathana*
1
Abstract
Background: Nasopharyngeal aspirate (NPA), nasal swab (NS), and throat swab (TS) are common specimens used for
diagnosis of respiratory virus infections based on the detection of viral genomes, viral antigens and viral isolation.
However, there is no documented data regarding the type of specimen that yields the best result of viral detection. In
this study, quantitative real time RT-PCR specific for M gene was used to determine influenza A viral loads present in NS,
NPA and TS samples collected from patients infected with the 2009 pandemic H1N1, seasonal H1N1 and H3N2 viruses.
Various copy numbers of RNA transcripts derived from recombinant plasmids containing complete M gene insert of
each virus strain were assayed by RT-PCR. A standard curve for viral RNA quantification was constructed by plotting
each Ct value against the log quantity of each standard RNA copy number.
Results: Copy numbers of M gene were obtained through the extrapolation of Ct values of the test samples against
the corresponding standard curve. Among a total of 29 patients with severe influenza enrolled in this study (12 cases of
the 2009 pandemic influenza, 5 cases of seasonal H1N1 and 12 cases of seasonal H3N2 virus), NPA was found to contain
significantly highest amount of viral loads and followed in order by NS and TS specimen. Viral loads among patients
infected with those viruses were comparable regarding type of specimen analyzed.
Conclusion: Based on M gene copy numbers, we conclude that NPA is the best specimen for detection of influenza A
viruses, and followed in order by NS and TS.
Background
Influenza A viruses are classified into 16 hemagglutinin
(H) and 9 neuraminidase (N) subtypes [1]. Since the
emergence of Russian influenza A (H1N1) in 1977 [2] to
the emergence of pandemic influenza A (H1N1) in April
2009, only A/H1N1, A/H3N2 and influenza B viruses
have been recognized as human or seasonal influenza.
Influenza virus spreads via respiratory secretion. After an
incubation period of about 1-3 days, the viruses are shed
from various kinds of respiratory samples. Upper respira-
tory tract specimens, such as nasopharyngeal wash
(NPW) or nasopharyngeal aspirate (NPA), nasal swab
(NS), throat swab (TS), endothracheal swab, bronchoal-
veolar lavage and tissues, are recommended for virus
detection in patients with respiratory tract infection.
These specimens could be used for viral antigen detec-
tion, virus isolation and molecular methods for genome
detection. Nevertheless, there is no documented data
which addresses the type of specimen that gives the best
yield for the disease diagnosis [3].
Genomes of influenza A and B viruses are composed of
8 negative sense, single-stranded RNA segments encoded
for 10-11 proteins essential for infection and replication
[1]. The genomic RNA has been used as targets for ampli-
fication by conventional and real time reverse transcrip-
tion-polymerase chain reaction (RT-PCR). The highly
conserved M gene-derived primers are usually utilized
for diagnosis of all influenza A subtypes, whereas specific
subtype identification targets H or H and N genes. In this
* Correspondence:
1
Department of Microbiology, Faculty of Medicine Siriraj Hospital, Mahidol
University, Bangkok 10700, Thailand
Full list of author information is available at the end of the article
Ngaosuwankul et al. Virology Journal 2010, 7:75
/>Page 2 of 7
study, the protocol established by the U.S., Center for Dis-
ease Control (CDC) for detection of M gene [4] in
adjunct with the standard curves of known copies of M
RNA transcripts derived either from H1N1, H3N2 or the
2009 pandemic A (H1N1) viruses was used to quantify
the viral loads in specimens collected from patients with
severe influenza prior to receiving anti-viral drug. Our
study provided the information on the clinical specimens
that yielded the best diagnostic result; and the viral loads
in patients infected with different influenza subtypes and
strains were also compared.
Methods
Subjects and Specimen Collection
This study was approved by the Institutional Review
Boards of the Committee on Ethics, Faculty of Medicine
Siriraj Hospital, Mahidol University and the Ministry of
Public Health, Thailand. NPA, NS and TS samples were
collected in viral transport medium (MicroTest™ Multi-
Microbe Media; Remel, Lenexa, KS) from patients with
severe influenza. The collection of NPA was performed
by flushing through a nasopharyngeal tube with 2 ml of
sterile normal saline using a sterile NG-tube or sterile
butterfly needle tube, inserted through the floor of nose.
The NPA yield at approximately 0.5 ml volume was then
added with VTM and the 3.5 ml final volume was
obtained. The nose and throat swabbing were performed
right after the NPA collection from nostrils and throat,
respectively, using MicroTest™ kit with 3 ml of VTM.
Quantitative Real time Reverse Transcription-Polymerase
Chain Reaction
Real time RT-PCR protocols established by CDC as well
as viral antigen detection by QuickVue (Quidel Corpora-
tion, San Diego, CA), virus isolation in MDCK cell cul-
ture and serodiagnosis, were used to diagnose influenza
virus infection in these patients. Positive results from at
least two diagnostic tests were obtained for each case. A
total of 29 patients enrolled in this study comprised 12
cases of pandemic influenza A/2009 (H1N1), 5 cases of
A/Brisbane/59/2007(H1N1) like- and 12 cases of A/Bris-
bane/10/2007 (H3N2) like-virus infection. All respiratory
specimens were kept at -70°C until tested.
In the preparation of standard M-RNA, viral RNA
extracted from A/Nonthaburi/102/2009 (H1N1), A/Bris-
bane/59/2007-like (H1N1) and A/Brisbane/10/2007-like
(H3N2) viruses were reverse transcribed into comple-
mentary DNA (cDNA) in a 20 μl reaction comprised 8 μl
of viral RNA, 1× RT buffer, 5 mM MgCl
2
, 10 mM DTT, 50
ng of random hexamers, 0.5 mM dNTPs, 40 units of
RNaseOUT
TM
(Invitrogen Corporation, Carlsbad, CA)
and 200 units of SuperScript
TM
III reverse transcriptase
(Invitrogen) following the manufacturer's instruction.
Thereafter, cDNA was subjected to PCR amplification in
a 50 μl reaction mixture containing 5 μl of cDNA target, 5
μl of 10× High Fidelity PCR buffer, 1 mM dNTP mixture,
2 mM MgSO
4
, 0.4 μM forward primer, 0.4 μM reverse
primer (universal M primers, Bm-M-1 and Bm-M-1027R
[5]; sequences as shown in Table 1) and 0.5 μl of High
Fidelity Platinum
®
Taq DNA polymerase (Invitrogen). The
PCR amplification cycle was set as 94°C for 2 min for ini-
tial denaturation, followed by 35 cycles of 94°C for 30 sec,
55°C for 30 sec, and 68°C for 90 sec, and followed by final
extension at 68°C for 10 min. The PCR product of com-
plete M segment of 1,056 base pairs in size was gel-puri-
fied and cloned into pGEM
®
T-Easy plasmid (Promega
Corporation, Madison, WI). Thereafter, M RNA was in
vitro-transcribed from the recombinant plasmid using
Riboprobe
®
combination system-SP6/T7 (Promega), fol-
lowed by step of RNase-free DNase (Promega) digestion
in order to remove out the recombinant plasmid DNA
Table 1: Sequences of primers and probes for PCR and real time RT-PCR.
Primer and probe Sequence (5'>3') Reference
Bm-M-1 TAT TCG TCT CAG GGA GCA AAA GCA GGT
AG
Hoffmann E et al.
Bm-M-1027R ATA TCG TCT CGT ATT AGT AGA AAC AAG
GTA GTT TTT
Hoffmann E et al.
FluA Forward GAC CRA TCC TGT CAC CTC TGA C CDC
FluA Reverse AGG GCA TTY TGG ACA AAK CGT CTA CDC
FluA Probe
1
TGC AGT CCT CGC TCA CTG GGC ACG CDC
RnaseP Forward AGA TTT GGA CCT GCG AGC G CDC
RnaseP Reverse GAG CGG CTG TCT CCA CAA GT CDC
RnaseP Probe
1
TTC TGA CCT GAA GGC TCT GCG CG CDC
1
TaqMan
®
probes are labeled at the 5'-end with the reporter molecule 6-carboxyfluorescein (FAM) and with the quencher, Blackhole
Quencher 1 (BHQ1) at the 3'-end.
Ngaosuwankul et al. Virology Journal 2010, 7:75
/>Page 3 of 7
templates. M transcripts obtained were kept at -70°C
until assayed.
To minimize the test variation, standard curves of M
RNA transcripts were constructed in parallel with the
detection of viral M RNA in clinical samples in the quan-
titative real time RT-PCR. The M RNA transcripts were
measured by Quant-iT™ RNA Assay Kit (Invitrogen) and
diluted to various copy numbers in a ten folded serial
dilution manner; and each known M RNA copy number
was assayed by real time RT-PCR according to that
described by the 2009 CDC protocol [4]. The sequences
of primer and probe sets used in this study are shown in
Table 1. A 25 μl reaction mixture of real time RT-PCR
comprised 5 μl of total RNA, 12.5 μl of 2× reaction mix,
0.5 μl of SuperScript
TM
III Platinum
®
Taq Mix (Invitro-
gen), each 0.8 μM of forward and reverse primers and 0.2
μM of labeled probe, and H
2
O was added to bring up the
final volume. The amplification was carried out in
DNAEngine
®
Peltier Thermal Cycler with Chromo4™
Real-Time PCR Detector (Bio-Rad Laboratories, Inc.,
Hercules, CA) using the amplification cycles of 50°C for
30 min for reverse transcription, 95°C for 2 min for Taq
polymerase activation, followed by 45 cycles of PCR
amplification (95°C for 15 sec and 55°C for 30 sec). Fluo-
rescence signal was obtained at 55°C. The results were
analyzed by MJ OpticonMonitor™ Analysis Software ver-
sion 3.1 (Bio-Rad). A standard curve was constructed by
plotting each cycle threshold (Ct) value against the log
quantity of standard RNA copy numbers. Total RNA was
extracted from the NPA, NS and TS specimens by
QIAamp
®
Viral RNA Mini Kit (QIAGEN Inc., Valencia,
CA) following the manufacturer's instruction. Real time
RT-PCR for detection of influenza A M gene and the
RnaseP (RNP) house keeping gene, was carried out. To
obtain amount of viral load present in each clinical sam-
ple, the test Ct value was extrapolated against the stan-
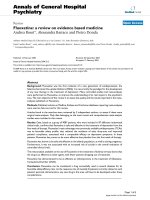
dard curve derived from each virus subtype or strain (Fig.
1). The sensitivity of the assay for all 3 subtypes and strain
was 100 copies of target M RNA/real time RT-PCR reac-
tion when the cut-off for positive result was set at 40
cycles.
Data Analysis
Statistical analysis was performed with SPSS program.
Pair t-test was used to compare the mean log
10
viral loads
among different types of specimens collected from the
same subjects and at the same time. Student t-test was
used to analyze the mean log
10
viral copy numbers in con-
temporary specimens from patients infected with differ-
ent virus subtypes and strain.
Results and Discussion
Real time RT-PCR protocol was analyzed for its applica-
bility to amplify M genes derived from H1N1, H3N2 and
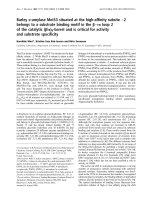
Figure 1 M transcript standard curve for quantitative detections
of the pandemic A/H1N1 (A), seasonal A/H1N1 (B) and seasonal
A/H3N2 viruses (C). The standard curve of M RNA copy numbers was
generated by plotting the Ct value (X-axis) against log
10
copy numbers
of M transcripts (Y-axis). The amount of M copy number in clinical spec-
imens was obtained by extrapolation of the Ct of the test sample
against the standard curve.
Ngaosuwankul et al. Virology Journal 2010, 7:75
/>Page 4 of 7
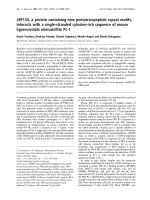
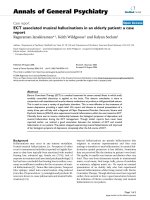
the 2009 pandemic viruses by aligning the primers and
probe nucleotide sequences against those M genes of var-
ious influenza subtypes and strains using BioEdit
Sequence Alignment Editor (Fig. 2, Table 2). The forward
and reverse primers bound to those M genes with higher
than 90% identity, while the probe bound with 100% iden-
tity. This suggested that the CDC primers/probe set can
be universally used for detection of M segments or viral
loads of the novel influenza A/2009 (H1N1), seasonal
H1N1 and seasonal H3N2 viruses.
Three standard curves of M RNA transcripts were con-
structed with the R
2
of 0.996, 0.993 and 0.996 for pan-
demic A/2009 (H1N1), seasonal H1N1 and seasonal
H3N2, respectively (Fig 1). The M copy numbers per ml
of VTM from patients infected with pandemic H1N1 or
H3N2 viruses were significantly highest in NPA samples
(pair t-test; P ≤ 0.05) (Table 3). However, number of
patients infected with seasonal H1N1 virus was too small
for data analysis. Additionally, viral load levels in patients
infected with either subtype or strain was comparable
(student t-test, P > 0.05). M RNAs were detected in all
NPA and NS, but not in all TS samples collected from
patients infected with any one of the virus subtypes/
strain. The detection rate was shown in Table 4.
RT-PCR for diagnosis of influenza viruses is generally
more sensitive than viral isolation method. The technique
detected the viral genome present in dead and alive
viruses including excess viral RNA present in the infected
cells; however, virus isolation detected only live virus par-
ticles. RT-PCR is a high through-put and less time con-
suming method. In addition, only RT-PCR can
differentiate type, subtype and strain of influenza viruses.
Sensitivity of RT-PCR to diagnose the disease not only
depends on the protocol, but also the type of clinical sam-
ple used in the diagnosis. Our study has two advantages
that are not commonly conducted in previous reports.
Firstly, we had an opportunity to investigate 3 types of
clinical specimens collected from the same individuals at
the same time, e.g., NPA, NS and TS. Secondly, we had
employed full length M RNA transcripts derived from A/
H1N1, A/H3N2 and the 2009 pandemic viruses to con-
struct 3 standard curves for quantifying viral RNA copy
numbers of the contemporary subtype and strain present
in the test specimens, with the assumption that the full
length in vitro M RNA transcripts closely mimics the
native structure of the viral M genomic segments.
Regardless of viral subtypes and strains (H1N1, H3N2
and 2009 pandemic H1N1 virus), we found that all NPA
and NS specimens were positive for viral genome detec-
tion, while the positive rate was lower in TS specimens.
Previous investigators reported that viral RNA concen-
tration in respiratory samples and long duration of virus
shedding were correlated with influenza disease severity
[6]. Amount and duration of viral shedding are important
in the disease treatment and control of virus spread. Dif-
ferent type of specimens contained different amount of
viral RNA concentration; therefore, using different type
of clinical specimens may yield different information. In
addition, there is no reference method for viral load assay.
Peiris et al. [7] reported that viral load in NPA samples of
Figure 2 Alignment of M gene fragment from the pandemic A/H1N1, seasonal A/H1N1 and seasonal A/H3N2 viruses against CDC real time
RT-PCR primers and probe sequences. BioEdit Sequence Alignment Editor was used to locate the region of real time RT-PCR primers and probe
binding site within M gene of various subtypes of influenza A viruses.
Ngaosuwankul et al. Virology Journal 2010, 7:75
/>Page 5 of 7
H5N1 patients was lower than those of H3N2 patients.
The finding was further extended by Ward et al. [8] that
viral load in throat swab samples of H5N1 patients in
1997 and 2004 was 10-fold lower than that observed in
H3N2 patients, i.e., 1.5 × 10
6
TCID
50
/ml versus 1.6 × 10
5
TCID
50
/ml (t-test, P < 0.05). On the other hand, de Jong
et al. [9] found that viral load in TS from H5N1 patients
was significantly higher than that from H3/H1 patients;
and, additionally, TS contained significantly higher H5N1
viral load than nasal swab samples; meanwhile, viral load
in TS and nasal swab samples from H1/H3 patients was
not statistically different. The difference in results
obtained from different groups of investigators might
reflect process of specimen collection and also the differ-
ent protocols for viral load measurement.
It has been reported that the 2009 pandemic virus pref-
erentially binds sialic acid receptor with α 2, 6 linkage to
galactose (SA α 2,6 Gal), the same as human influenza
H1N1 and H3N2 viruses [10]. Fatality rate in patients
infected with the novel virus is less than 1%, except in
that which occurs in patients with underlying conditions,
e.g., cardiovascular disease, hypertension, asthma and
diabetes, etc. [11,12]. However, the study in a mammalian
model demonstrated that the 2009 pandemic H1N1 virus
was more pathogenic than the seasonal H1N1 virus [13].
Our study, therefore, explored the viral load in respira-
tory secretions collected prior to anti-viral treatment,
and found that the level of viral RNA in cases infected
with the 2009 pandemic H1N1 virus was not statistically
different from those infected with seasonal H1N1 and
Table 2: Percentages of identity of primers and probe with the M sequences derived from different virus subtypes and
strain.
% Identity with
Virus Forward primer Reverse primer Probe
Pandemic A/H1N1/2009 95.45 91.67 100
A/H1N1 100 91.67 100
A/H3N2 95.45 91.67-95.83 100
Table 3: Influenza viral loads in various types of clinical specimens collected from patients infected with different virus
subtypes.
Log10 M RNA copy number in
Virus Number of
cases
Statistics Age Days after
onset
NPA NS TS
Pandemic
A/H1N1/
2009
12 Mean 12 5 7.5
a, b
6.5
a, c
4.1
b, c
Median 8 5 7.5 6.9 4.9
Range 3-53 2-10 5.8-8.9 2.7-8.7 Und 6.9
A/H1N1 5 Mean 5 5 7.8 7.2 7.4
Median 4 4 8.5 6.4 7.7
Range 1-12 2-10 4.7-8.9 5.5-9.3 5.8-8.7
A/H3N2 12 Mean 17 5 8.0
a, b
6.6
a
5.6
b
Median 4 5 8.1 7.2 6.8
Range 1-69 2-6 5.8-9.2 3.5-8.3 Und 7.7
The viral loads are reported as log
10
of M segment copy number/1 ml of VTM. Pair t-test was used to compare the mean log
10
viral loads in
different types of specimens collected from the same subjects and at the same time.
a
indicates a significant difference of the viral loads in NPA and NS,
b
in NPA and TS and
c
in NS and TS (Pair t-test, P < 0.05).
Und., below detection limit; NPA, Nasopharyngeal aspirate; NS, Nasal swab; TS, Throat swab.
Ngaosuwankul et al. Virology Journal 2010, 7:75
/>Page 6 of 7
H3N2 viruses. Mean log
10
copies/ml of viral RNA of 7.5-
8.0 in NPA, 6.5-7.2 in NS and 4.1-7.4 in TS samples were
found in our study. It is to be kept in mind that all of our
patients had severe influenza at time of specimen collec-
tion, and most of them were pediatric patients (24 chil-
dren and 5 adults). Duration of viral shedding of the
seasonal influenza as reported by the other groups of
investigators was 4-5 days in average [6,14]. A recent
report by To et al. [15], showed that the level of the 2009
pandemic viral load of 8 log
10
copies/ml was found in
respiratory specimens collected before oseltamivir treat-
ment; and the viral shedding peaked at the day of onset of
symptom with median duration of 4 days [15]. On the
other hand, when using plasmid containing amplification
target to construct the standard curve together with
using pool of throat and nasal swab as the test samples,
the other study demonstrated that the H1/H3 viral loads
of 5.06 ± 1.85 log
10
copies/ml were found in patients with
major co-morbidities and 3.62 ± 2.13 log
10
copies/ml in
patients without co-morbidities [6].
Conclusions
Our study suggested that when complete facilities are
accessible, such as in clinics and hospitals, NPA will be
the best specimen of choice; and in field investigation, NS
will be the second choice, followed by TS specimen.
Using the appropriate specimen will provide the highest
diagnostic rate and the precise strategy for disease treat-
ment and prevention control.
Competing interests
The authors declare that they have no competing interests.
Authors' contributions
PP designed the research study; NN, PN, PK and PhP performed research; NN,
PN and PK analyzed data; NN and PP wrote the manuscript. KK, TC, CS, CC and
JF provided specimens. All authors read and approved the final manuscript.
Acknowledgements
This study is supported by the Thailand Research Fund for Senior Research
Scholar and the South East Asia Infectious Disease Clinical Research Network
(SEAICRN), supported by the US National Institute of Health. NN is supported
by Postdoctoral Fellowship Scholarship, Mahidol University, Thailand. We thank
Mrs. Caroline Fukuda and Dr. Steve Wignall, SEAICRN for their kind coordina-
tion.
Author Details
1
Department of Microbiology, Faculty of Medicine Siriraj Hospital, Mahidol
University, Bangkok 10700, Thailand,
2
Pediatrics, Faculty of Medicine Siriraj
Hospital, Mahidol University, Bangkok 10700, Thailand,
3
Queen Sirikit National
Institute of Child Health, Bangkok 10400, Thailand,
4
Bamrasnaradura Infectious
Disease Institute, Nonthaburi 11000, Thailand,
5
Chest Disease Institute,
Nonthaburi 11000, Thailand and
6
Hospital for Tropical Diseases, Wellcome
Trust Major Overseas Programme, Oxford University Clinical Research Unit, Ho
Chi Minh City, Vietnam
References
1. Maines TR, Szretter KJ, Perrone L, Belser JA, Bright RA, Zeng H, Tumpey TM,
Katz JM: Pathogenesis of emerging avian influenza viruses in mammals
and the host innate immune response. Immunol Rev 2008, 225:68-84.
2. Tognotti E: Influenza pandemics: a historical retrospect. J Infect Dev
Ctries 2009, 3:331-334.
3. WHO information for laboratory diagnosis of pandemic (H1N1) 2009
virus in humans-update [ />publications/swineflu/en/]
4. CDC protocol of realtime RTPCR for influenza A (H1N1) [http://
www.who.int/csr/resources/publications/swineflu/en/]
5. Hoffmann E, Stech J, Guan Y, Webster RG, Perez DR: Universal primer set
for the full-length amplification of all influenza A viruses. Arch Virol
2001, 146:2275-2289.
6. Lee N, Chan PK, Hui DS, Rainer TH, Wong E, Choi KW, Lui GC, Wong BC,
Wong RY, Lam WY, Chu IM, Lai RW, Cockram CS, Sung JJ: Viral loads and
duration of viral shedding in adult patients hospitalized with influenza.
J Infect Dis 2009, 200:492-500.
7. Peiris JS, Yu WC, Leung CW, Cheung CY, Ng WF, Nicholls JM, Ng TK, Chan
KH, Lai ST, Lim WL, Yuen KY, Guan Y: Re-emergence of fatal human
influenza A subtype H5N1 disease. Lancet 2004, 363:617-619.
8. Ward CL, Dempsey MH, Ring CJ, Kempson RE, Zhang L, Gor D, Snowden
BW, Tisdale M: Design and performance testing of quantitative real
time PCR assays for influenza A and B viral load measurement. J Clin
Virol 2004, 29:179-188.
9. de Jong MD, Simmons CP, Thanh TT, Hien VM, Smith GJ, Chau TN, Hoang
DM, Chau NV, Khanh TH, Dong VC, Qui PT, Cam BV, Ha do Q, Guan Y, Peiris
JS, Chinh NT, Hien TT, Farrar J: Fatal outcome of human influenza A
(H5N1) is associated with high viral load and hypercytokinemia. Nat
Med 2006, 12:1203-1207.
10. Neumann G, Noda T, Kawaoka Y: Emergence and pandemic potential of
swine-origin H1N1 influenza virus. Nature 2009, 459:931-939.
11. WHO, Pandemic (H1N1) 2009 - update 58, Laboratory-confirmed cases
of pandemic (H1N1) 2009 as officially reported to WHO by States
Parties to the International Health Regulations (2005) [http://
www.who.int/csr/don/2009_07_06/en/]
12. WHO, Assessing the severity of an influenza pandemic [http://
www.who.int/csr/disease/swineflu/assess/
disease_swineflu_assess_20090511/]
13. Itoh Y, Shinya K, Kiso M, Watanabe T, Sakoda Y, Hatta M, Muramoto Y,
Tamura D, Sakai-Tagawa Y, Noda T, Sakabe S, Imai M, Hatta Y, Watanabe S,
Li C, Yamada S, Fujii K, Murakami S, Imai H, Kakugawa S, Ito M, Takano R,
Received: 28 January 2010 Accepted: 20 April 2010
Published: 20 April 2010
This artic le is available fro m: http://www.v irologyj.com/co ntent/7/1/75© 2010 Ngaosuwankul et al; licensee BioMed Central Ltd. This is an Open Access article distributed under the terms of the Creative Commons Attribution License ( which permits unrestricted use, distribution, and reproduction in any medium, provided the original work is properly cited.Virology Journal 2010, 7:75
Table 4: Genome detection rate by type of clinical specimens.
Number of positive cases
Virus NPA NS TS
Pandemic A/H1N/2009 12 (100%) 12 (100%) 9 (75%)
A/H1N1 5 (100%) 5 (100%) 5 (100%)
A/H3N2 12 (100%) 12 (100%) 11 (91.67%)
NPA, Nasopharyngeal aspirate; NS, Nasal swab; TS, Throat swab.
Ngaosuwankul et al. Virology Journal 2010, 7:75
/>Page 7 of 7
Iwatsuki-Horimoto K, Shimojima M, Horimoto T, Goto H, Takahashi K,
Makino A, Ishigaki H, Nakayama M, Okamatsu M, Takahashi K, Warshauer
D, Shult PA, Saito R, Suzuki H, Furuta Y, Yamashita M, Mitamura K, Nakano
K, Nakamura M, Brockman-Schneider R, Mitamura H, Yamazaki M, Sugaya
N, Suresh M, Ozawa M, Neumann G, Gern J, Kida H, Ogasawara K, Kawaoka
Y: In vitro and in vivo characterization of new swine-origin H1N1
influenza viruses. Nature 2009, 460:1021-1025.
14. Ison MG: Influenza in hospitalized adults: gaining insight into a
significant problem. J Infect Dis 2009, 200:485-488.
15. To KK, Chan KH, Li IW, Tsang TY, Tse H, Chan JF, Hung IF, Lai ST, Leung CW,
Kwan YW, Lau YL, Ng TK, Cheng VC, Peiris JS, Yuen KY: Viral load in
patients infected with pandemic H1N1 2009 influenza A virus. J Med
Virol 2010, 82:1-7.
doi: 10.1186/1743-422X-7-75
Cite this article as: Ngaosuwankul et al., Influenza A viral loads in respiratory
samples collected from patients infected with pandemic H1N1, seasonal
H1N1 and H3N2 viruses Virology Journal 2010, 7:75