Báo cáo khoa học: " Development of a fluorescent quantitative real-time polymerase chain reaction assay for the detection of Goose parvovirus in vivo" ppsx
Bạn đang xem bản rút gọn của tài liệu. Xem và tải ngay bản đầy đủ của tài liệu tại đây (317.33 KB, 7 trang )
BioMed Central
Page 1 of 7
(page number not for citation purposes)
Virology Journal
Open Access
Research
Development of a fluorescent quantitative real-time polymerase
chain reaction assay for the detection of Goose parvovirus in vivo
Jin-Long Yang
1,2
, An-Chun Cheng*
2,3
, Ming-Shu Wang
2,3
, Kang-
Cheng Pan
2,3
, Min Li
2
, Yu-Fei Guo
2
, Chuan-Feng Li
2
, De-Kang Zhu
2,3
and
Xiao-Yue Chen
2,3
Address:
1
Chongqing Academy of Animal Science, Chongqing 402460, Chongqing, China,
2
Avian Diseases Research Center, College of Veterinary
Medicine of Sichuan Agricultural University, Yaan 625014, Sichuan, China and
3
Key Laboratory of Animal Diseases and Human Health of Sichuan
Province, Yaan 625014, Sichuan Province, China
Email: Jin-Long Yang - ; An-Chun Cheng* - ; Ming-Shu Wang - ;
Kang-Cheng Pan - ; Min Li - ; Yu-Fei Guo - ;
Chuan-Feng Li - ; De-Kang Zhu - ; Xiao-Yue Chen -
* Corresponding author
Abstract
Background: Goose parvovirus (GPV) is a Dependovirus associated with latent infection and
mortality in geese. Currently, it severely affects geese production worldwide. The objective of this
study was to develop a fluorescent quantitative real-time polymerase chain reaction (PCR) (FQ-
PCR) assay for fast and accurate quantification of GPV DNA in infected goslings, which can aid in
the understanding of the regular distribution pattern and the nosogenesis of GPV in vivo.
Results: The detection limit of the assay was 2.8 × 10
1
standard DNA copies, with a sensitivity of
3 logs higher than that of the conventional gel-based PCR assay targeting the same gene. The real-
time PCR was reproducible, as shown by satisfactory low intraassay and interassay coefficients of
variation.
Conclusion: The high sensitivity, specificity, simplicity, and reproducibility of the GPV fluorogenic
PCR assay, combined with a high throughput, make this method suitable for a broad spectrum of
GPV etiology-related applications.
Background
Goose parvovirus (GPV) is the causative agent of Gosling
plague (GP), an acute, contagious, and fatal disease,
which is also known as Derzsy's disease [1]. GPV has been
formally classified as a member of the genus Dependovirus
in family Parvoviridae [2]. It was first described as a clinical
entity by Fang [3]. It causes considerable economic losses,
especially in countries with an industrialized goose pro-
duction system, because the virus infection spreads rap-
idly worldwide causing high rate of morbidity and
mortality [1,4-6].
Regular methods for identifying GPV include agar-gel dif-
fusion precipitin test, virus neutralization (VN) assay, and
enzyme-linked immunosorbent assay (ELISA) [5]. How-
ever, these methods have certain limitations; they are tedi-
Published: 15 September 2009
Virology Journal 2009, 6:142 doi:10.1186/1743-422X-6-142
Received: 7 July 2009
Accepted: 15 September 2009
This article is available from: />© 2009 Yang et al; licensee BioMed Central Ltd.
This is an Open Access article distributed under the terms of the Creative Commons Attribution License ( />),
which permits unrestricted use, distribution, and reproduction in any medium, provided the original work is properly cited.
Virology Journal 2009, 6:142 />Page 2 of 7
(page number not for citation purposes)
ous and are not always reliable because of the
requirement of specific-pathogen-free (SPF) gosling
embryos and standard positive anti-GPV serum [7,8].
Recently, the highly conserved VP3 region of the GPV
gene was cloned and sequenced and analyzed by qualita-
tive polymerase chain reaction (PCR) assays [9-12].
Although qualitative PCR was useful for the diagnosis of
GPV infection, it had some problems: it involved the elec-
trophoresis and staining processes, which made the proce-
dure lengthy, increased the risk of contamination, or
rendered the method unsuitable for large-scale investiga-
tions [13-15]. Moreover, determination of the amount of
virus in different tissues and cells was very useful for inves-
tigating the nosogenesis, virus replication, host-virus
interactions, tropism, and effective for screening anti-viral
drugs; all these factors could not be assessed by qualitative
PCR [16,17].
In recent years, a method based on PCR with an automatic
confirmation phase has been developed. This method,
which is known as the fluorescent quantitative real-time
PCR (FQ-PCR), has been used widely to quantify the
number of genomic copies of pathogenic microorganisms
[18,19].
GPV detection by real-time PCR has only been reported by
Bi [20]; in that study, the method was not optimized and
a FQ-PCR standard curve was not generated. In this study,
we reported the optimization of a FQ-PCR assay to quan-
tify GPV DNA in vivo after experimental infection. The
results of this study provide some interesting data that
may be beneficial to understand the regular distribution
pattern and nosogenesis of GPV in vivo in goslings.
Results
Concentration of standard pVP3 plasmid DNA
The concentration of standard pVP3 plasmid DNA was 2
μg/μL, and the A260/A280 (ratio) was 1.84; the copy
numbers of pVP3 plasmid DNA were 2.76 × 10
11
copies/
μL.
Development and optimization of FQ-PCR and
conventional PCR
After the optimization of FQ-PCR, we selected the final
concentrations of each primer as 0.2 μmol/L and that of
probe as 0.16 μmol/L. The MgCl
2
concentration was
adjusted to 10 mM to obtain optimal FQ-PCR assay con-
ditions. Therefore, the optimized 25-μL FQ-PCR reaction
system for GPV detection was as follows: 1× PCR buffer,
10 mmol/L MgCl
2
, 0.2 mmol/L dNTPs, 0.2 μmol/L of
each primer, 0.16 μmol/L of probe, 1 U Taq, and 1 μL
DNA template.
The optimized conventional PCR reaction system used in
this study was as described by Huang et al. [12]: 1× PCR
buffer, 1.5 mmol/L MgCl
2
, 0.2 mmol/L dNTPs, 1.0 pmol/
L of each primer, 2.5 U Taq, and 1 μL DNA template. The
optimized annealing temperature was 52°C.
Establishment of FQ -PCR standard curve
The FQ-PCR amplification curves and the corresponding
FQ-PCR standard curve (Figure 1) were generated by
employing the successively diluted known copy numbers
of pVP3 for real-time PCR reaction under the optimized
conditions. On the basis of the results of correlation coef-
ficient (0.999) and PCR efficiency (98.7%), it was con-
firmed that the standard curve and the established FQ-
PCR protocol were extremely effective. By using the fol-
lowing formula, we were able to quantify the amount of
unknown samples: Y = -3.353X + 51.142 (Y = threshold
cycle, X = log starting quantity).
Sensitivity, specificity, reproducibility and dynamic range
analysis of the established FQ-PCR
Ten-fold dilutions of the pVP3 plasmid DNA were tested
by the established FQ-PCR assay to evaluate the sensitivity
of the system, and the detection limit was found to be 2.8
× 10
1
copies/reaction. Comparisons were made between
the conventional PCR method and our established FQ-
PCR method using dilution series of pVP3 plasmid DNA
to calculate the end-point sensitivity of each assay. The
results indicated that the established FQ-PCR is approxi-
mately 1000-times more sensitive than the conventional
PCR method; the former method can detect pVP3 copies
down to dilutions of 2.8 × 10
1
copies/reaction and the lat-
ter one that can detect copies up to the dilutions of 2.8 ×
10
4
copies/reaction.
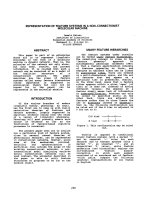
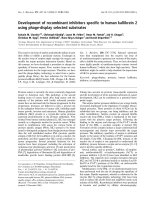
The test was performed using DNA from pVP3, GPV-CHv
and several other bacteria and viruses as templates to
examine its specificity; the result of this analysis showed
that none of the bacteria or viruses (other than GPV-CHv
and pVP3) yielded any amplification signal, suggesting
that the established FQ-PCR assay was highly specific (Fig-
ure 2).
The intraassay and interassay CV of this established FQ-
PCR was in the range of 0.8-3% for most of the dynamic
range (from 2.8 × 10
11
to 2.8 × 10
1
pVP3 plasmid copies/
μL). The results demonstrated that the established FQ-
PCR method was characterized by a wide dynamic range
(11 logarithmic decades) of detection from 2.8 × 10
11
to
2.8 × 10
1
pVP3 plasmid copies/μL with high precision.
Therefore the dynamic range of the method was between
2.8 × 10
11
to 2.8 × 10
1
pVP3 plasmid copies/μL, which is
relatively broad.
Dynamic distribution of in vivo GPV test by using the
established FQ-PCR assay
Viral load quantification using the established FQ-PCR
demonstrated that the GPV DNA copy number of each
Virology Journal 2009, 6:142 />Page 3 of 7
(page number not for citation purposes)
sample could be calculated using the cycle threshold (Ct)
value determined from the standard curve. The dynamic
distribution of GPV within the tissues after oral infection
with GPV was intermittently determined by means of the
FQ-PCR in separate segments of tissues over a 9-day
period. Results of this analysis revealed that the blood,
heart, liver, spleen, kidney, Bursa of Fabricius (BF), thy-
mus, and Harder's glands were positive at 4-h postinocu-
lation (PI), with about 10
4.93
-10
7.57
copies/g. GPV was
consistently detected in all the segments of the organs at
8-h PI. The copy numbers of GPV in each tissue reached a
peak at 48-72-h PI. Numbers of GPV DNA decreased at 6
days, and by 9 days, the level of GPV DNA decreased
remarkably. Importantly, the level of GPV DNA was com-
parable to that in the other organs at 3-days PI; the liver,
spleen, thymus, Harder's glands, and BF had significantly
higher numbers of GPV DNA than the rest of the tissues,
with >10
10
copies/g in the former tissues compared to
<10
8
copies/g in the rest of the tissues. In addition, the
control group did not show any positive results at any
time point or in any tissue (Table 1)
Discussion
Here, we describe a real-time PCR assay for the quantifica-
tion of GPV genome coupes in goslings. We confirmed
that this assay was highly sensitive, specific, and reproduc-
ible.
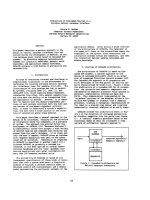
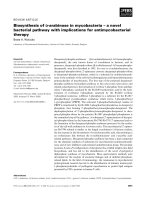
Establishment of the fluorescent quantitative real-time PCR (FQ-PCR) standard curveFigure 1
Establishment of the fluorescent quantitative real-time PCR (FQ-PCR) standard curve. Ten-fold dilutions of
standard DNA ranging from 2.8 × 10
8
to 2.8 × 10
4
copies/μL were used, as indicated on the x-axis, whereas the corresponding
cycle threshold (Ct) values are presented on the y-axis. Each dot represents the result of triplicate amplifications of each dilu-
tion. The correlation coefficient and slope value of the regression curve were calculated and are indicated. (1:2.8 × 10
8
, Ct =
12.7; 2: 2.8 × 10
7
, Ct = 16.2; 3: 2.8 × 10
6
, Ct = 19.4; 4: 2.8 × 10
5
, Ct = 22.9; 5: 2.8 × 10
4
, Ct = 25.9)
Virology Journal 2009, 6:142 />Page 4 of 7
(page number not for citation purposes)
Real-time PCR has become a potentially powerful alterna-
tive in microbiological diagnostics because of its simplic-
ity, rapidity, reproducibility, and high sensitivity
compared to other diagnostic methods [21-23]. In this
study, we clearly established the applicability of real-time
PCR for the quantification of GPV because of its remarka-
ble sensitivity and high-throughput potential, which is
beyond the scope of other diagnostic methods.
The real-time PCR assay permits the simultaneous detec-
tion and quantification of DNA. It is useful for under-
standing the pathogenesis of the disease and the
mechanisms of virus transmission by enabling the inves-
tigation of viral dynamics [21]. The assay can be used to
determine the amount of viral DNA in different tissues at
various times after infection; this infection data could be
interesting and useful for expanding the understanding on
viruses. Quantification of the viral load makes it possible
to study the kinetics and tropism of GPV in different birds,
tissues, and cells. Our study is different from other studies
that examined the distribution of viruses and the charac-
teristics of the lesions induced in experimentally infected
geese and Muscovy ducts by performing comparative
pathological studies or other assays [24,25].
Previous studies have examined the distribution of GPV in
infected Muscovy ducks by qualitative PCR [9], including
a study that used quantitative PCR [20]. However, Bi et al.
did not optimize the FQ-PCR assay for future application.
Limn et al. found that GPV could be first detected at 2-d
PI in the liver and other organs. Because the real-time PCR
method was more sensitive than regular qualitative PCR
methods [26], we could first detect GPV at 4-h PI in the
liver and other tissues, which was less than 40 h compared
to the time required by regular qualitative PCR methods.
This finding is important because the prevention and
early detection are presently the most logical strategies for
virus control [27].
Islam et al. reported that in orally infected ducks, duck
plague virus (DPV) first invaded the epithelial cells of the
intestinal tract, following which it was transported to other
immune organs, such as BF, thymus, and spleen, from where
it finally invaded to all the other host tissues via blood circu-
The specificity of FQ-PCRFigure 2
The specificity of FQ-PCR. 1. pVP3; 2. GPV-CHv; 3. Aleu-
tian disease virus (ADV); 4. Canine Parvovirus (CPV); 5. Por-
cine parvovirus (PPV); 6. Newcastle disease viruses (NDV);
7. Pasteurella multocida (5:A); 8. Salmonella enteritidis (No.
50338); 9. Escherichia coli (O78)
Table 1: The distribution and quantity of GPV
A
at different time points
B
within the different segments of the tissue samples after the
goslings were experimentally infected with GPV
sample 4 hr 8 hr 12 hr 24 hr 2 days 3 days 6 days 9 days
Blood 4.93 ± 0.11 5.71 ± 0.10 6.35 ± 0.04 6.81 ± 0.21 7.76 ± 0.10 6.78 ± 0.09 6.51 ± 0.14 4.50 ± 0.23
Heart 5.07 ± 0.04 5.20 ± 0.07 6.18 ± 0.01 7.17 ± 0.07 8.32 ± 0.06 9.07 ± 0.33 8.18 ± 0.05 6.78 ± 0.11
Liver 6.87 ± 0.09 7.66 ± 0.08 8.63 ± 0.17 9.21 ± 0.07 10.39 ± 0.08 11.08 ± 0.10 9.96 ± 0.21 8.08 ± 0.23
Spleen 7.45 ± 0.06 8.71 ± 0.10 9.17 ± 0.07 10.20 ± 0.12 11.16 ± 0.14 11.99 ± 0.07 10.14 ± 0.23 8.97 ± 0.19
Lung 0 5.90 ± 0.19 6.11 ± 0.14 7.75 ± 0.11 7.94 ± 0.21 7.51 ± 0.14 6.00 ± 0.16 4.97 ± 0.02
Kidney 6.98 ± 0.08 7.86 ± 0.11 8.27 ± 0.07 9.15 ± 0.16 9.94 ± 0.14 10.87 ± 0.05 9.34 ± 0.19 7.56 ± 0.16
BF
C
7.57 ± 0.09 8.25 ± 0.16 8.42 ± 0.14 9.07 ± 0.07 9.85 ± 0.14 10.95 ± 0.14 9.68 ± 0.18 8.84 ± 0.05
Thymus 7.12 ± 0.03 8.27 ± 0.19 8.94 ± 0.13 9.76 ± 0.18 10.39 ± 0.21 11.10 ± 0.07 9.97 ± 0.09 7.97 ± 0.12
Esophagus 0 6.35 ± 0.13 7.97 ± 0.19 8.31 ± 0.16 9.77 ± 0.15 8.48 ± 0.14 8.04 ± 0.14 7.85 ± 0.19
Trachea 0 6.24 ± 0.05 7.61 ± 0.19 8.03 ± 0.05 8.95 ± 0.19 8.11 ± 0.07 6.74 ± 0.18 6.21 ± 0.21
Brain 0 6.62 ± 0.07 7.88 ± 0.05 8.18 ± 0.23 8.97 ± 0.05 9.28 ± 0.21 8.84 ± 0.18 8.27 ± 0.09
HG
D
7.07 ± 0.16 8.41 ± 0.13 8.96 ± 0.16 9.58 ± 0.16 10.69 ± 0.05 11.20 ± 0.21 10.20 ± 0.18 10.11 ± 0.16
Duodenum 0 7.35 ± 0.18 8.27 ± 0.14 8.37 ± 0.18 8.85 ± 0.09 9.56 ± 0.21 8.72 ± 0.23 7.90 ± 0.23
Jejunum 0 7.29 ± 0.12 7.56 ± 0.21 7.74 ± 0.21 7.83 ± 0.07 8.88 ± 0.15 8.16 ± 0.14 7.64 ± 0.21
Ileum 0 7.76 ± 0.18 7.90 ± 0.18 8.18 ± 0.23 8.78 ± 0.14 9.45 ± 0.21 8.61 ± 0.23 7.87 ± 0.15
Cecum 0 6.41 ± 0.12 6.86 ± 0.14 7.10 ± 0.21 7.43 ± 0.05 8.04 ± 0.12 7.10 ± 0.21 6.87 ± 0.09
Rectum 0 6.17 ± 0.16 6.33 ± 0.12 6.71 ± 0.19 7.28 ± 0.12 7.95 ± 0.19 7.45 ± 0.16 6.67 ± 0.21
A GPV = Goose parvovirus
B Units: log10 copies/ml for blood and log10 copies/g for others
C BF = Bursa of Fabricius
D HG = Harder's glands
Virology Journal 2009, 6:142 />Page 5 of 7
(page number not for citation purposes)
lation [28]. Similarly, our study showed that GPV was dis-
tributed in the blood, heart, liver, spleen, kidney, BF,
thymus, and Harder's glands at 4-h PI. Subsequently, GPV
was consistently distributed in all the segments of the organs
at 8-h PI. The copy numbers of GPV in the liver, spleen, thy-
mus, Harder's glands, and BF was significantly higher than
that in the other regions. Therefore, these immune organs
could be considered as the primary sites of invasion in nor-
mal goslings after GPV infection.
Live GPV vaccine is widely used to immunize adult geese
to prevent GPV infection [12]. Real-time PCR and qualita-
tive PCR assays [10-12] can amplify the highly conserved
VP3 region of the GPV gene, which is distributed in the
high-virulence strain and live-vaccine strain of GPV. The-
oretically, these methods would not be able to differenti-
ate the GPV vaccine strain from the high-virulence strain;
nonetheless, we could perform the study on the dynamic
distribution of GPV in vivo using these methods, because
the animals were certificated as GPV-free by qualitative
PCR assay before being infected with the high-virulence
strain. For standardization, the VP3 gene was cloned into
a plasmid. The available live vaccine could have been used
as the standard.
Conclusion
In conclusion, the established real-time PCR assay was
rapid, sensitive, and specific for the detection and quanti-
fication of GPV DNA. In addition, our results provide sig-
nificant data for clarifying that the immune organs were
the primary sites of GPV invasion in infected goslings.
Methods
Virus and PCR template DNA preparation
GPV CH
V
strain, a high-virulence strain of GPV, was
obtained from Key Laboratory of Animal Diseases and
Human Health of Sichuan Province.
Aleutian disease virus (ADV), canine parvovirus (CPV),
porcine parvovirus, (PPV), Newcastle disease virus
(NDV), Pasteurella multocida (5: A), Salmonella enteritidis
(No. 50338), and Escherichia coli (O78) were provided by
Key Laboratory of Animal Diseases and Human Health of
Sichuan Province.
Template DNA was extracted from the viral and bacterial
stock solutions using the High Pure PCR Template Prepa-
ration kit (Roche Diagnostics GmbH, Mannheim, Ger-
many) according to the manufacturer's instructions.
PCR primer and probe design
The FQ-PCR assay primers and probe (namely, GPV-F,
GPV-R, and CPV-FP) were designed on the basis of the
highly conserved VP3 region of GPV (GenBank Accession
No. U25749
). Primers and probe were designed by using
the Primer Premier software (version 5.0). The position
and sequence of the primers and probe are shown in Table
2. The product size was 60 bp. The fluorogenic probe was
labeled at the 5' position with 6-carboxyfluorescein
(FAM) dye as a reporter and at the 3' position with tetra-
methylcarboxyrhodamine (TAMRA) as a quencher and
with Minor Groove Binder (MGB™).
The sequences of the forward and reverse primers used for
the conventional PCR were as described by Huang et al.,
and this primer pair yielded a 441-bp amplicon [12].
All the probes and primers were synthesized by TakaRa
Biotech Co., Ltd. (Dalian, China) and purified by the cor-
responding high-performance liquid chromatography
(HPLC) system.
Preparation of standard plasmid DNA templates
The recombinant plasmid DNA (namely, pVP3) and
primer constructs (namely, VP3-1 and VP3-2) were
designed to amplify an expected 1658-bp PCR product
that included positions 3,008-4,665 bp of GPV (GenBank
Accession No. U25749
) (Table 2). Primers were designed
by using the Primer Premier software (version 5.0). The
product was ligated into the pGM-T vector (Tiangen
Corp., Beijing, China) and transformed into E. coli DH5α
competent cells [27]. The pVP3 was extracted using the
TIANprep plasmid extraction kit (Tiangen Corp., Beijing,
China). The pVP3 DNA concentration was determined by
measuring the absorbance at 260 nm using a Smartspec
3000 spectrophotometer (Bio-Rad Corp., Hercules, CA),
and the purity was confirmed using the 260/280 nm ratio.
On the basis of the molecular weight, we calculated the
pVP3 copy number using the equations described by Ke
[29].
Table 2: Oligonucleotide sequences of the primers and probes used in the GPV FQ-PCR method (Oligonucleotide positions have been
determined by referring to the gene sequence of U25749)
Name Sequence 5' to3' Position Amplicon size (bp)
GPV-F GTGCCGATGGAGTGGGTAAT 3084-3103 60
GPV-R ACTGTGTTTCCCATCCATTGG 3122-3143
GPV-FP 6FAM-FTCGCAATGCCA
ATTTCCCGAGGP TAMRA
3098-3120
VP3-1 AAGCTTTGAAATGGCAGAGGGAGGA 3008-3033 1658
VP3-2 GGATCCCGCCAGGAAGTGCTTTATTTGA 4637-4665
Virology Journal 2009, 6:142 />Page 6 of 7
(page number not for citation purposes)
Development and optimization of FQ-PCR
The FQ-PCR was performed using the ABI AmpliTaq Gold
DNA polymerase system with an icycler IQ Real-time PCR
Detection System (Bio-Rad Corp., Hercules, CA) according
to the manufacturer's instructions. The reaction, data acqui-
sition, and analysis were performed using iCycler IQ optical
system software. The FQ-PCR was performed in a 25-μL reac-
tion mixture containing 1× PCR buffer, 0.3 mmol/L dNTPs,
1.25 U Taq, and 1 μL DNA template according to the manu-
facturer's instructions. Autoclaved nanopure water was
added to make the final volume to 25 μL. Each run com-
prised an initial activation step of 30 s at 95°C, followed by
40 cycles of denaturation at 94°C for 10 s and annealing at
60°C for 30 s; the fluorescence was measured at the end of
the annealing/extension step. The tests were performed using
0.2-mL PCR tubes (ABgene, UK). FQ-PCR reactions were
optimized in triplicate based on the primer, probe, and
MgCl
2
concentration selection criteria, which was performed
according to 4 × 4 × 4 matrix of primer concentrations (0.10,
0.12, 0.16, and 0.20 μmol/L), probe concentrations (0.10,
0.12, 0.16, and 0.20 μmol/L), and MgCl
2
concentrations
(1.0, 5.0, 10.0, and 15.0 mmol/L). Conditions were selected
to ensure that both the fluorescence acquisition curves were
robust and Ct values were the lowest possible to the known
template DNA concentrations.
An internal positive control was introduced into the FQ-
PCR assay to verify that DNA was not lost during the
extraction step and PCR inhibitors were absent in the
DNA templates as described by Guo et al. [27].
Establishment of the FQ-PCR standard curve
The FQ-PCR standard curve was generated by successive
dilutions of pVP3 with known copy numbers. The purified
pVP3 plasmid DNA was serially diluted 10-fold in TE
buffer, pH 8.0, from 2.8 × 10
8
to 2.8 × 10
4
plasmid copies/
μL. These dilutions were tested in triplicate and used as
quantification standards to construct the standard curve by
plotting the plasmid copy number logarithm against the
measured Ct values. The Bio-Rad iCycler IQ detection soft-
ware was used to generate the standard curve and to calcu-
late the correlation coefficient (R2) of the standard curve
and the standard deviations of the triplicate samples.
FQ-PCR sensitivity, specificity, reproducibility, and
dynamic range analysis
The sensitivities of the conventional PCR and FQ-PCR
were each determined using triplicates of different con-
centrations of the recombinant plasmid pVP3. Template
DNA was prepared as follows: plasmids of pVP3 were seri-
ally diluted 10-fold from 2.8 × 10
6
copies/μL to 2.8 × 10
0
copies/μL using sterile ultra pure water. From each dilu-
tion, 1 μL was used as a template and subjected to the con-
ventional PCR and FQ-PCR protocol. The detection limit
of the conventional PCR was determined based on the
highest dilution that resulted in the presence of clear and
distinct amplified fragments (441 bp) on the agarose gel.
The detection limit of the FQ-PCR was determined based
on the highest dilution that resulted in the presence of Ct
value in real-time PCR detection.
DNA from pVP3, GPV-CHv and several other pathogens,
including ADV, CPV, PPV, NDV, Pasteurella multocida (5:
A), Salmonella enteritidis (No. 50338), and Escherichia coli
(O78) (kindly provided by Key Laboratory of Animal Dis-
eases and Human Health of Sichuan Province) were used
as templates in the triplicate analyses to confirm the spe-
cificity of the technique.
Within-run and between-run reproducibilities of the FQ-
PCR assay were assessed by multiple measurements of
pVP3 samples of different concentrations. The assay was
conducted by assessing the agreement between the repli-
cates in five replicates (within-run precision) and in five
separate experiments (between-run precision) of the seri-
ally diluted pVP3 plasmid samples through transforming
the raw data to their common logarithms and performing
analysis of the mean coefficient of variation (CV) values
of each pVP3 standard dilution [27].
Dilutions of pVP3 plasmid were used to determine the
dynamic ranges of the FQ-PCR assay. The lower and upper
limits of quantification were defined by the pVP3 recom-
binant standard plasmid sample concentrations possess-
ing reasonable precision [27].
Goslings and tissue preparation
GPV-free goslings (10-day-old) that were certificated with
qualitative PCR as described by Huang [12] were obtained
from the breeding facility of the Institute of Poultry Sci-
ences in Sichuan Agricultural University, China. Animals
were bred and maintained in an accredited facility at the
Institute of Poultry Sciences in Sichuan Agricultural Uni-
versity (Sichuan, China), and the experiments conducted
during this study conform to the principles outlined by
the Animal Welfare Act and the National Institutes of
Health guidelines for the care and use of animals in bio-
medical research.
Fifty goslings were randomly divided into 2 groups. In
brief, a group of 40 goslings were orally infected with GPV
CH
V
strain, using 0.1 mL of 10
3
LD
50
per gosling. Another
group of 10 goslings was treated with an equal volume of
physiologic saline and used as a control [20].
Three goslings from the infected group and 1 gosling from
the control group were killed at each time point. Blood,
heart, liver, spleen, lung, kidney, BF, thymus, esophagus,
trachea, brain, Harder's glands, duodenum, jejunum,
ileum, cecum, and rectum were analyzed by the real-time
Virology Journal 2009, 6:142 />Page 7 of 7
(page number not for citation purposes)
PCR at different postinoculation (PI) time points, at 30
min; 1, 2, 4, 8, 12, and 24 h; and 2, 3, 6, and 9 days. Tis-
sues were surgically removed from the goslings and frozen
at -80°C, weighed, and homogenized using an Omni PCR
Tissue Homogenizer (Omni). Normal tissue sample sizes
were 20 mg. For the assays, tissue samples were homoge-
nized in 1 mL of phosphate buffered saline (PBS, pH 7.4).
The homogenizer was washed multiple times between
each tissue homogenization. DNA was extracted from the
tissue samples by using the method described by Cheng
[30]. Using this assay, we could quantify the viral load. All
the samples were analyzed 3 times. The viral concentra-
tions were expressed as the mean log
10
virus genome copy
numbers per g or 1 mL of the tested tissue or blood.
Competing interests
The authors declare that they have no competing interests.
Authors' contributions
JY carried out most of the experiments and wrote the man-
uscript. AC and MW critically revised the manuscript and
the experiment design. KP, ML, YG, CL, DZ and XC helped
with the experiment. All of the authors read and approved
the final version of the manuscript.
Acknowledgements
This work was supported by the Changjiang Scholars and Innovative
Research Team in University (No. PCSIRT0848), the earmarked fund for
Modern Agro-industry Technology Research System (No. nycytx-45-12)
and Sichuan Province Basic Research Program (2008JY0100).
References
1. Gough D, Ceeraz V, Cox B: Isolation and identification of goose
parvovirus in the UK. Vet Rec 2005, 13:424.
2. Brown KE, Green SW, Young NS: Goose parvovirus-an autono-
mous member of the Dependovirus genus. Virol 1995,
210:283-291.
3. Fang DY: Recommendation of GPV. Veterinary Science in China
1962, 8:19-20. (in chinese).
4. Takehara K, Nishio T, Hayashi Y, Kanda J, Sasaki M, Abe N, Hiraizumi
M, Saito S, Yamada T, Haritani M: An outbreak of goose parvovi-
rus infection in Japan. J Vet Med Sci 1995, 4:777-779.
5. Richard E, Gough : Goose parvovirus infection. In Diseases of poul-
try 11th edition. Edited by: Saif YM, Barnes HJ, Fadly AM, Glisson JR,
McDougald LR, Swayne DE. Ames: Iowa State Press; 2003:367-374.
6. Holmes JP, Jones JR, Gough RE, Welchman Dde B, Wessels ME, Jones
EL: Goose parvovirus in England and Wales. Vet Rec 2004,
4:127.
7. Baxi M, McRae D, Baxi S, Greiser-Wilke I, Vilcek S, Amoako K,
Deregt D: A one-step multiplex real-time RT-PCR for detec-
tion and typing of bovine viral diarrhea viruses. Vet Microbiol
2006, 1-3:37-44.
8. Decaro N, Martella V, Elia G, Desario C, Campolo M, Lorusso E,
Colaianni ML, Lorusso A, Buonavoglia C: Tissue distribution of the
antigenic variants of canine parvovirus type 2 in dogs. Vet
Microbiol 2007, 1-2:39-44.
9. Limn CK, Yamada T, Nakamura M: Detection of goose parvovirus
genome by polymerase chain reaction: distribution of goose
parvovirus in muscovy ducklings. Virus Res 1996, 1:l67-172.
10. Takehara K, Saitoh M, Kiyono M, Nakamura M: Distribution of
attenuated goose parvoviruses in Muscovy goslinglings. J Vet
Medical Sci 1998, 3:341-344.
11. Chu CY, Pan MJ, Cheng JT: Genetic variation of the nucleocap-
sid genes of waterfowl parvovirus. J Vet Med Sci 2001,
11:1165-1170.
12. Huang C, Cheng AC, Wang MS, Liu F, Han XF, Wang G, Zhou WG,
Wen M, Jia RY, Guo YF, Chen XY, Zhou Y: Development and
application of PCR to detect goose parvovirus. Veterinary Sci-
ence in China 2004, 9:54-60. (in chinese, with English abstract).
13. Liu YK, Sun XQ, Huang J: The Diagnostic Method of PCR for
Lymphocystis Disease(LCD) of Cultured Paralichthys oli-
vaceus. High Technology Letters 2002, 11:87-89. (in chinese, with Eng-
lish abstract).
14. Royuela E, Negredo A, Sánchez-Fauquier A: Development of a one
step real-time RT-PCR method for sensitive detection of
human astrovirus. J Virol Meth 2006, 1:14-19.
15. Reid SM, King DP, Shaw A, Knowles NJ, Hutchings GH, Cooper EJ,
Smith AW, Ferris NP: Development of a real-time reverse tran-
scription polymerase chain reaction assay for detection of
marine caliciviruses (genus Vesivirus). J Virol Meth 2007, 1-
2:166-173.
16. Friedrichs C, Neyts J, Gaspar G, Clercq Ee, Wutzler P: Evaluation
of antiviral activity against human herpesvirus 8 (HHV-8)
and Epstein-Barr virus (EBV) by a quantitative real-time
PCR assay. Antivir Res 2004, 3:121-123.
17. Günther S, Asper M, Röser C, Luna LK, Drosten C, Becker-Ziaja B,
Borowski P, Chen HM, Hosmane RS: Application of real-time
PCR for testing antiviral compounds against Lassa virus,
SARS coronavirus and Ebola virus in vitro. Antivir Res 2004,
3:209-215.
18. Gurukumar KR, Priyadarshini D, Patil JA, Bhagat A, Singh A, Shah PS,
Cecilia D: Development of real time PCR for detection and
quantitation of Dengue Viruses. Virol J 2009, 6:10.
19. Mendy ME, Kaye S, Sande M van der, Rayco-Solon P, Waight PA, Ship-
ton D, Awi D, Snell P, Whittle H, McConkey SJ: Application of real-
time PCR to quantify hepatitis B virus DNA in chronic carri-
ers in The Gambia. Virol J 2006, 3:23.
20. Bi JM, Tian FL, Li YP, Zhu RL: Detection of goose parvovirus dis-
tribution in geese by fluorescence quantitative PCR assay.
Chinese Journal of Preventive Veterinary Medicine 2008, 30:64-67.
21. Mackay M, Arden KE, Nitsche A: Real-time PCR in virology.
Nucleic Acids Res 2002, 30:1292-1305.
22. Deng SX, Cheng AC, Wang MS, Cao P: Study on the gastrointes-
tinal tract distribution of Salmonella Enteritidis in orally
infected mice with a species specific fluorescent quantitative
PCR. World J Gastroentero 2007, 48:6568-6574.
23. Manna L, Reale S, Vitale F, Picillo E, Pavone LM, Gravino AE: Real-
time PCR assay in Leishmania-infected dogs treated with
meglumine antimoniate and allopurinol. Vet J 2008, 2:279-282.
24. Alexandrov M, Alexandrova R, Alexandrov I, Zacharieva S, Lasarova
S, Doumanova L, Peshev R, Donev T: Fluorescent and electron-
microscopy immunoassays employing polyclonal and mono-
clonal antibodies for detection of goose parvovirus infection.
J Virol Meth 1999, 79:21-32.
25. Glávits R, Zolnai A, Szabó E, Ivanics E, Zarka P, Mató T, Palya V:
Comparative pathological studies on domestic geese (Anser
anser domestica) and Muscovy ducks (Cairina moschata)
experimentally infected with parvovirus strains of goose and
Muscovy duck origin. Acta Vet Hung 2005, 53:73-89.
26. Pantchev A, Reinhard S, Rolf B, Judith T, Konrad S: New real-time
PCR tests for species-specific detection of Chlamydophila
psittaci and Chlamydophila abortus from tissue samples. Vet
J 2008. doi:10.1016/j.tvjl.2008.02.025
27. Guo Y, Cheng A, Wang M, Shen C, Jia R, Chen S, Zhang N: Devel-
opment of TaqMan MGB fluorescent real-time PCR assay for
the detection of anatid herpesvirus 1. Virol J 2009, 6:71.
28. Islam MR, Khan MAHNA: An Immunocytochemical study on
the sequential tissue distribution of duck plague virus. Avian
Pathol 1995, 24:189-194.
29. Ke GM, Cheng HL, Ke LY, Ji WT, Chulu JL, Liao MH, Chang TJ, Liu
HJ: Development of a quantitative Light Cycler real-time RT-
PCR for detection of avian reovirus. J Virol Meth 2006, 1:6-13.
30. Cheng AC, Wang MS, Xin HY, Zhu DK, Li XR, Chen HJ, Jia RY, Yang
M: Development and application of a reverse transcriptase-
polymerase chain reaction detect Chinese isolates of duck
hepatitisvirus type 1. J Microbiol Meth 2008.