Báo cáo khoa học: Schemes of flux control in a model of Saccharomyces cerevisiae glycolysis docx
Bạn đang xem bản rút gọn của tài liệu. Xem và tải ngay bản đầy đủ của tài liệu tại đây (479.3 KB, 11 trang )
Schemes of flux control in a model of
Saccharomyces cerevisiae
glycolysis
Leighton Pritchard and Douglas B. Kell
Institute of Biological Sciences, University of Wales, Aberystwyth, UK
We used parameter scanning to emulate changes to the
limiting rate for steps in a fitted model of glucose-derepressed
yeast glycolysis. Three flux-control regimes were observed,
two of which were under the dominant control of hexose
transport, in accordance with various experimental studies
and other model predictions. A third control regime in which
phosphofructokinase exerted dominant glycolytic flux con-
trol was also found, but it appeared to be physiologically
unreachable by this model, and all realistically obtainable
flux control regimes featured hexose transport as a step
involving high flux control.
Keywords: yeast; metabolic control analysis; glycolysis;
modelling; flux.
In vivo and in vitro investigations of metabolic pathways can
be complex and expensive. The need to focus efficiently both
monetary and physical effort necessitates that some path-
ways and organisms will be only partially explored by
experiment, while others will be neglected completely.
Bioinformatic and computational approaches offer a means
of obtaining full value from experimentally acquired data,
extending their interpretation, suggesting novel hypotheses
for future experiments and guiding the experimentalist
towards potentially rewarding investigations but away from
likely fruitless ones. In this paper, we use such an approach,
parameter scanning, to investigate the operation of a model
of glucose derepressed yeast glycolysis (fitted by evolution-
ary computing to experimental data) under a far wider
range of conditions than could be considered in vitro or
in vivo, which suggests opportunities for further experiment.
Glycolysis is perhaps the most important pathway in the
metabolism of many living cells, describing the conversion
of glucose (and sometimes other hexoses) to pyruvate and
thence, in some organisms, to ethanol. In this conversion
two molecules of ATP are consumed and four molecules of
ATP are generated, providing a major source of Ônegotiable
energyÕ for the cell. The glycolytic pathway, though crucial
to each, varies in detail between organisms [1]; for largely
economic reasons, greater effort has gone into the under-
standing of glycolysis in some organisms than in others.
Brewer’s yeast Saccharomyces cerevisiae, and in particular
its glycolytic pathway, is of great economic importance, not
least for the production of ethanol in the brewing and
distilling industries. The study of yeast glycolysis has thus
been the focus of scientific interest for over a century. In
pregenomic studies, the enzymes and metabolites that make
up the pathway were considered to have been elucidated
completely [2], but the solution of the S. cerevisiae genome
added further to this knowledge, and it is widely considered
that this organism currently possesses the best-investigated
and best-understood glycolytic pathway.
Much effort has already been invested in mathematical
modelling of the glycolytic pathway in yeast [3–8] and in
other organisms, such as Trypanosoma brucei, the parasite
that causes sleeping sickness [9–12]. The success and utility
of modelling in the study of T. brucei glycolysis has even led
to the coining of a new strategy for the investigation of
metabolism: computer experimentation [11]. This is inten-
ded to be a substitute for practical experimentation, and
must be based on precise kinetic knowledge of the system.
For yeast glycolysis, the most complete model to date was
constructed in order to test whether combining the
properties of the individual enzymes in isolation would
yield a proper description of the pathway as a whole [7].
This work provided a unique and highly valuable set of
in vitro kinetic and physical data obtained under a consistent
set of conditions (rare in the field [13]), and represented a
major step towards such computer experimentation in yeast.
In this paper, and in the spirit of computer experimen-
tation, we use the parameter scanning functions of
GEPASI
[14–16] to generate over 8000 models of glucose-derepressed
yeast glycolysis in order to test the flux-control character-
istics of the Teusink et al. model [7] under a wide range of
enzyme limiting rates. The limiting rates for 13 steps of the
model were scanned independently in all combinations by
an overall factor of four. In this way we explore the flux-
control behaviour of the model within the limits of its
Correspondence to D. B. Kell, Cledwyn Building,
Institute of Biological Sciences, University of Wales,
Aberystwyth, Wales, UK, SY23 3DD.
Fax: + 44 1970622354, Tel.: + 44 1970622334,
E-mail:
Abbreviations: PCA, principal components analysis; C
J
X
, flux control
coefficient for step X and flux J; FCC, flux control coefficient; Glyc,
glycogen branch; Succ, succinate branch; Treh, trehalose branch.
Enzymes: alcohol dehydrogenase (EC 1.1.1.1); adenylate kinase
(EC 2.7.4.2); aldolase (EC 4.1.2.13); enolase (EC 4.2.1.11);
glycerol-3-phosphate dehydrogenase (EC 1.1.99.5); glyceraldehyde-
3-phosphate dehydrogenase (EC 1.2.1.12); hexokinase (EC 2.7.1.1);
pyruvate decarboxylase (EC 4.1.1.1); phosphofructokinase
(EC 2.7.1.11); phosphoglucoisomerase (EC 5.3.1.9); phosphoglycerate
kinase (EC 2.7.2.3); phosphoglycerate mutase (EC 5.4.2.1); pyruvate
kinase (EC 2.7.1.40); triosephosphate isomerase (EC 5.3.1.1).
Note: a web site is available at
(Received 24 January 2002, revised 10 June 2002,
accepted 18 June 2002)
Eur. J. Biochem. 269, 3894–3904 (2002) Ó FEBS 2002 doi:10.1046/j.1432-1033.2002.03055.x
description of glucose-derepressed glycolysis and fixed
fluxes to glycogen and trehalose.
Although the in vitro kinetic data from [7] are rather
precise and quite complete, the generated model was unable
perfectly to describe the system’s in vivo behaviour. The
authors, however, were not aiming to give the best possible
description of the experimental system, but were instead
investigating whether the isolated, in vitro kinetics of the
glycolytic enzymes could describe the experimental system.
Nonetheless they attempted to fit individual steps to experi-
mental data, but restrained themselves from attempting to fit
simultaneously the whole model, and from presuming that
the intracellular concentration of enzyme was thesingle cause
of the discrepancy between in vitro and in vivo behaviour for
each individual step; they also considered the effects of
altered substrate/product affinities and equilibrium con-
stants. It was seen that, for most of the enzymes, only a small
change in the value of the limiting rate was required for
in silico kinetics to match each individual enzyme’s in vivo
performance closely. While modifications of V
max
alone to fit
in vivo performance could be calculated analytically for most
steps in glycolysis, this was not the case for all steps [7].
In this paper, we use a version of the model of glucose-
derepressed wild type yeast glycolysis described in [7] and
investigate characteristics of its operation close to the wild-
type state, and over a much wider range of operation than
that for which the model was originally intended. It has been
suggested [17] that inductive, multivariate and machine
learning approaches are appropriate for such problems, and
so we used the evolutionary programming algorithms
incorporated in the metabolic modelling package
GEPASI
[14–16] to estimate multiple sets of V
max
values for the
glycolytic enzymes that enable the model to describe in vivo
behaviour closely. Such an approach, although unlike
algebraic analysis in that it produces a range of possible
(although inexact) fits to the data, accounts for the effect of
simultaneously varying the kinetics of the other steps, and is
also expected to be a better qualitative measure of the
flexibility of the model itself in describing the experimental
data than is algebraically fitting isolated steps to their in vivo
performance. As a population operating approximately
equally close to the observed experimental state in [7], these
models may be considered to represent natural variability in
the yeast population, and we investigated the regions of
parameter and variable space described by them. Metabolic
control analysis [18–21] was performed on the fitted models,
and rank correlation analysis [22,23] used to investigate
patterns of flux control. The model with the best-fit V
max
parameters was used as the base model for parameter
scanning using routines contained in
GEPASI
.
METHODS
Model
A model of branched glycolysis, as described in [7] was
obtained in
SCAMP
format from one of its authors (a kind
gift from B. Teusink, TNO Prevention and Health, Leiden,
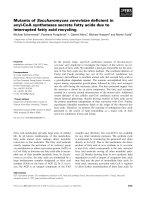
the Netherlands.) and is illustrated schematically in Fig. 1.
The ordinary differential equations describing the model are
Fig. 1. Schematic of the model yeast glycolytic pathway. The boxed
areas indicate the ÔperturbationÕ of including ATP/ADP conversion in
the succinate step which was present in [7], but not the provided
SCAMP
model. The ATP-ADP conversion is not included in the
GEPASI
model
described herein. AMP, adenosine monophosphate; EtOH, ethanol;
Fru1,6P
2
, fructose 1,6-biphosphate; Fru6P, fructose 6-phosphate;
GLCi, glucose (internal); GLCo, glucose (external); Gri3P, 3-phos-
phoglycerate; Gri3P, 2-phosphoglycerate; Gri1,3P
2
, 1,3-bisphospho-
glycerate; ADH, alcohol dehydrogenase; AK, adenylate kinase; ALD,
aldolase; ENO, enolase; Gro3PDH, glycerol-3-phosphate dehydro-
genase; Glc6P, glucose-6-phosphate; Gra3P,
D
-glyceraldehyde-
3-phosphate; Gra3PDH, glyceraldehyde-3-phosphate dehydrogenase;
HK, hexokinase; HXT, hexose transport; PDC, pyruvate decarboxy-
lase; PFK; phosphofructokinase; PGI, phosphoglucoisomerase; PGK,
phosphoglycerate kinase; PGM, phosphoglycerate mutase; PYK,
pyruvate kinase; TPI, triosephosphate isomerase.
Ó FEBS 2002 Flux control in yeast glycolysis (Eur. J. Biochem. 269) 3895
given in appendix 1. The
SCAMP
file was converted manually
to
GEPASI
[14] format, requiring minor modifications, and is
available to download from />models.shtml. Another version of the model may be run
via the internet at . The variant
of the model upon which we base our work contains small
deviations (described in Appendix 2) from that published in
[7], but with the exception of steady-state pyruvate concen-
tration, behaves identically to the published model.
Statistical methods and parameter fitting
Student’s t-tests and Spearman’s rank correlation analysis
were performed as described in [22,23] and using tables
therein. Principal components analysis (PCA) [24–26] was
performed using
HOBBES
, an in-house multivariate statistics
package [27,28]. Parameter fitting was performed on the
model using the evolutionary programming (genetic)
algorithm incorporated in
GEPASI
[16], with a population
of 50 models running for 300 generations. We fitted V
max
values for all steps (simultaneously constrained between 1
and 10
4
units) to the experimentally determined steady-
state mean metabolite concentrations using a sum of
squares difference cost function. Independent fitting runs
were performed on a number of generic PC clones under
WINDOWS
95/NT.
RESULTS
Comparison of fitted
V
max
values with those
obtained by experiment
Fitted V
max
values from 10 fitting runs of 300 generations
with a population of 50 models, and the corresponding
steady-state metabolite concentrations and fluxes, are
showninTables1and2.ThefittedV
max
values occupy
only a very small portion of the available parameter space,
close to those obtained experimentally in vitro in [7]. PCA
and two-tailed t-tests indicate that the fitted model values
cluster loosely together with the experimentally determined
V
max
values, and that only six of the 14 V
max
values are
significantly altered in fitting (P < 0.05). Altered V
max
values are found in two contiguous sections of the
pathway, one in upper glycolysis (PGI-PFK-ALD; see
Fig. 1 for definitions of metabolites and enzymes) and one
in lower glycolysis (ENO-PYK-PDC), and the required
adjustments correspond, not unexpectedly, to those deter-
minedin[7].
Thesteady-statemetaboliteconcentrationsfromthe
fitted models are much closer to the experimentally deter-
mined values than are those from the original model
(Table 2). Although fitting the glycolysis model to the
experimental data radically improves its performance, PCA
shows that the distribution of these modelled concentrations
is still not congruent with the in vivo values (Fig. 2B), but
that this variation is, however, negligible compared to the
difference between the original and fitted model values
(Table 3). The steady-state fluxes of the original model lie
well within the range covered by the steady-state fluxes of
the fitted models, which are distinct from the in vivo steady-
state fluxes (Fig. 2C).
Three replicate measurements of in vivo metabolite
concentration and pathway flux were made in [7], permitting
statistical comparison of the fitted and experimental steady-
state metabolite concentrations and pathway fluxes. Stu-
dent’s t-tests showed that three of 15 (Fru6P, glycerone
phosphate, phosphoenolpyruvate) metabolite concentration
and two HXTs, (lower glycolysis) of five flux value
populations differed significantly between the fitted and
experimental values (P < 0.05). Although the fitting
procedure improved the performance of the model mark-
edly in terms of its ability to predict individual metabolite
concentrations and fluxes, it did not produce an exact match
for the measured in vivo behaviour.
Flux-control coefficients are uniform across
all fitted models
Mean values for each flux control coefficient (FCC), the
corresponding sample standard deviations and coefficients
of variation (CoV) across all fitted models were calculated.
The standard deviations of the FCCs for steps with
Table 1. V
max
values for fitted models. Values of V
max
obtained for each fitted step of the glycolysis model in each of the 10 fitting runs, and the
means and standard deviations of this population for each step.
Run
Step R1 R2 R3 R4 R5 R6 R7 R8 R9 R10 Mean SD
HXT 97.24 96.82 94.78 81.05 114.5 96.02 98.23 93.28 98.39 98.75 96.91 8.08
HK 236.7 295.2 323.9 243.1 195.2 200.7 227.8 214.6 258.5 231.6 242.8 40.54
PGI 1056 656.9 705.9 362.7 1125 1318 334.3 313.1 1331 1560 876.3 461.3
PFK 110.0 122.1 119.0 112.6 129.4 108.0 154.6 154.9 114.5 110.8 123.6 17.62
ALD 94.69 95.66 92.56 80.36 103.8 88.00 92.76 87.46 93.32 92.19 92.08 6.10
Gra3PDH(f) 1152 1078 1162 1161 1168 1267 1167 1268 1221 1288 1193 65.91
Gra3PDH(r) 6719 6504 6481 5642 6551 6687 6437 6548 6294 6530 6439 304.6
Gro3PDH 47.11 69.66 64.29 9.83 109.4 42.22 62.02 33.10 72.84 57.92 56.84 26.56
PGK 1288 1178 1498 1600 1399 1344 1369 1256 1287 1161 1338 136.5
PGM 2585 2349 2410 2956 2131 2517 2645 1105 2478 2635 2381 497.4
ENO 201.6 209.4 204.7 182.5 222.3 198.1 206.7 221.5 203.9 205.9 205.7 11.34
PYK 1000 946.7 943.2 1053 1094 1068 884.2 1089 1114 1069 1026 77.89
PDC 857.8 867.8 864.2 710.0 897.5 833.3 827.2 814.0 634.9 878.1 818.5 82.77
ADH 209.5 737.6 824.9 781.5 824.1 742.3 826.8 770.6 849.4 371.7 693.9 219.1
3896 L. Pritchard and D. B. Kell (Eur. J. Biochem. 269) Ó FEBS 2002
significant flux control coefficients were uniformly close to
zero. Several CoVs approach a value of one, but only where
the flux control coefficient is negligibly small.
For steps in main-chain glycolysis, with few exceptions,
the only significant glycolytic flux control derives from the
hexose transport (C
J
HXT
% 1) and hexokinase (C
J
HK
% 0.15)
steps, though there is frequently small negative flux control
from ATPase and the glycogen/trehalose branching steps
(C
J
ATPase
% )0.08; C
J
Glyc
% )0.09; C
J
Treh
% )0.07). The
remaining steps of glycolysis exert only minimal, but
exclusively positive flux control over the main-chain glyc-
olytic steps, and the sum of glycolytic flux control
coefficients for these steps is approximately 0.1 for any
given flux.
Control over ATPase flux which, in this model, represents
generalized ATP use (or demand) in the organism, follows a
similar pattern to that for main-chain glycolysis, in that flux
control rests with the HXT (C
ATPase
HXT
% 1.4) and HK
(C
ATPase
HK
% 0.2) steps. Again, the branching steps also exert
some negative flux control and main-chain glycolytic
enzymes exert only slightly greater control over ATPase
than they do over the main glycolytic flux.
In our simulations, the fluxes through the glycogen and
trehalose branches are fixed, as we use the Teusink et al.
model [7], simulating only glucose derepressed glycolysis.
Only the Gro3PDH (leading to glycerol) and succinate
branches are subject to flux control by other steps, and the
FCCs are identical in each branch. These two branches, and
the subsections of metabolism that they represent, have
some autonomous control over their own steady-state flux
in this model. The major FCC is again that of hexose
transport (C
J
HXT
% 0.72), but there are also two large
positive FCCs from the Gro3PDH (C
Gro3PDH;succ
Gro3PDH
% 0.56)
and succinate (C
Gro3PDH;succ
Succ
% 0.33) branches themselves.
The hexokinase step also has a positive influence on
pathway flux (C
Gro3PDH;succ
HK
% 0.11), and the steps of lower
glycolysis exert significant negative flux control
(C
Gro3PDH;succ
Gra3PDH
% )0.19; C
Gro3PDH;succ
ADH
% )0.13). A precise
division between upper and lower glycolysis can be made, in
that upper glycolytic enzymes (HK-ALD) have positive
FCCs and lower glycolytic enzymes (steps Gra3PDH-
ADH) have negative FCCs for the succinate and glycerol
branching steps.
Correlation analysis of control coefficients
We used the nonparametric method of Spearman’s rank
correlation analysis [22,23], coded in-house, to detect
statistically significant correlations between the magnitudes
of the FCCs across the fitted glycolysis models and thus
identify patterns of distributed control in this system
(Fig. 3A–D). Overall, the correlation between the FCCs
C
J
x
and C
J
y
for all pairs of enzymes (x, y)overallstepsJisof
constant sign where the FCC and correlation are significant.
This implies strong linkage of the controlling behaviour of
groups of steps in glycolysis. Where FCCs for branching
steps are significantly correlated with each other, this
correlation is always positive, and where FCCs for the
main-chain of glycolysis (HK-ADH) are correlated with
each other, these, too are also positive. The FCCs for
branching steps are negatively correlated with those for
main-chain glycolysis, and there is also a negative correla-
tion between FCCs for HXT and the rest of main-chain
glycolysis.
Table 2. Steady-state metabolite concentrations and fluxes for fitted models. The values of steady-state metabolite concentrations (m
M
)andpathway
fluxes (m
M
Æmin
)1
) obtained in each of the 10 fitting runs, and similar values for the same model run using experimentally obtained V
max
parameters
from [7]. The sum of squares difference used as a cost function is also indicated, with an estimate made for the sum of squares difference between the
original model and experimental metabolite concentrations. Note that fitting does not significantly alter the fluxes. SSQ, sum of squares.
Fitting run
Teusink
ModelMetabolite R1 R2 R3 R4 R5 R6 R7 R8 R9 R10
[ATP] 2.48 2.54 2.56 2.52 2.63 2.61 2.58 2.65 2.58 2.56 2.51
[Glc6P] 2.44 2.53 2.52 2.45 2.50 2.46 2.62 2.61 2.44 2.44 1.07
[ADP] 1.31 1.27 1.26 1.28 1.22 1.23 1.25 1.21 1.25 1.26 1.29
[Fru6P] 0.57 0.51 0.53 0.41 0.58 0.60 0.37 0.37 0.59 0.61 0.11
[Fru1,6P
2
] 5.52 5.61 5.51 5.47 5.52 5.47 5.49 5.47 5.53 5.49 0.61
[AMP] 0.31 0.29 0.28 0.29 0.25 0.26 0.27 0.25 0.27 0.28 0.30
[glycerone phosphate] 0.97 0.94 0.86 1.03 0.89 0.82 0.86 0.86 0.82 0.81 0.74
[Gra3P] 0.04 0.04 0.04 0.05 0.04 0.04 0.04 0.04 0.04 0.04 0.03
[NAD] 1.50 1.55 1.54 1.42 1.56 1.53 1.54 1.52 1.55 1.53 1.55
[NADH] 0.09 0.04 0.05 0.17 0.03 0.06 0.05 0.07 0.04 0.06 0.04
[Gri3P] 0.84 0.87 0.90 0.77 0.91 0.88 0.90 0.92 0.89 0.83 0.36
[Gri2P] 0.12 0.12 0.13 0.12 0.12 0.13 0.13 0.09 0.13 0.12 0.04
[pyrauvate] 1.80 1.81 1.81 1.91 1.85 1.83 1.86 1.86 2.23 1.80 8.37
[acetaldehyde] 0.18 0.18 0.17 0.05 0.24 0.13 0.16 0.11 0.18 0.17 0.17
Flux
Glucose 88.27 90.08 88.83 75.23 97.58 85.59 88.83 84.44 90.34 89.42 88.15
Ethanol 128.56 131.33 131.14 121.83 138.28 130.59 131.68 130.83 132.48 131.37 129.23
CO2 136.10 139.07 138.26 123.84 148.36 136.01 138.65 135.53 140.08 138.76 136.50
Glycerol 18.85 19.35 17.80 5.02 25.20 13.56 17.42 11.75 19.00 18.49 18.19
Succinate 3.77 3.87 3.56 1.00 5.04 2.71 3.48 2.35 3.80 3.70 3.64
SSQ 0.031 0.038 0.036 0.035 0.040 0.033 0.043 0.042 0.041 0.033 >36
Ó FEBS 2002 Flux control in yeast glycolysis (Eur. J. Biochem. 269) 3897
Parameter scanning
The manner in which control of glycolytic flux changes
when expression levels of glycolytic enzymes are altered was
investigated by independently varying V
max
values for
HXT, HK, PGI, PFK, ALD, Gra3PDH (forward and
reverse) PGK, PGM, ENO, PYK, PDC, and ADH by an
overall factor of four (limiting rates were set to either V
max
/2
or 2V
max
in all combinations) using the parameter scanning
functions of
GEPASI
. Only around 50% of the simulations
reached steady state, and of those that did a single step was
usually seen to dominate flux control (Fig. 4A,B).
No steady state was reached in which a high limiting rate of
HXT (200 lmolÆmL
)1
Æmin
)1
) was accompanied by either a
low rate for HK(50 lmolÆmL
)1
Æmin
)1
) or a high one for PFK
(240 lmolÆmL
)1
Æmin
)1
). The ability of the scanned systems
to reach steady state could be described by two simple rules.
All systems were able to reach steady state with low HXT
limiting rate (50 lmolÆmL
)1
Æmin
)1
) unless HK, Gra3PDH
(forward) and ADH limiting rates were reduced (to 200, 1700
and 25 lmolÆmL
)1
Æmin
)1
, respectively). Conversely, those
systems with large HXT(V
max
) could only reach steady-state
if the limiting rates for HK, PFK and ALD were low (200, 60
and 50 lmolÆmL
)1
Æmin
)1
, respectively). 3584 systems with
high HXT limiting rate could not therefore reach steady-
state, compared to only 512 with low HXT(V
max
).
PCA of the FCCs for those simulations able to attain
steady state indicates that within the scanned parameter
range this model of derepressed glycolysis operates under
one of three major modes of control (Figs 4 and 5). In
regimes II and III, HXT is the step dominating glycolytic flux
control, and the only other step seen to dominate glycolytic
flux control is PFK in regime I. Dominant PFK flux control
is limited to a small region of parameter space in which
its limiting rate is halved, while HXT(V
max
) is doubled.
More detailed scanning (50 lmolÆmL
)1
Æmin
)1
<PFK,
HXT(V
max
)<200lmolÆmL
)1
Æmin
)1
in 15 lmolÆmL
)1
Æ
min
)1
steps) of this parameter region illustrates the boundary
between the two control regimes (Fig. 6). As the model
moves into the PFK flux control region internal concentra-
tions of G6P and Fru6P rapidly rise to pathological levels
(Fig. 6), suggesting that this state may not be physiologically
accessible under the conditions of this model, in which the
flux to glycogen and trehalose is fixed.
The regime occupied most frequently by our simulations
is regime II, wherein glycolytic flux control is almost
exclusively the province of hexose transport, with minor
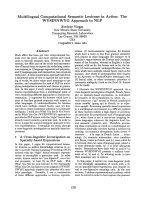
Fig. 2. PCA score plots for: (A) model V
max
values from fitting (dia-
monds) and experiment (squares), (B) steady-state metabolite concen-
tration values from fitting (diamonds), in vivo studies (square) and the
original model (cross), and (cB) steady-state fluxes from fitting (dia-
monds), in vivo studies (square) and the original model (cross). Experi-
mental data from [7]. (A) The experimental values lie on the outskirts of
the main fitted cluster, and the main outlier is a fitted model, indicating
that the adjustments made to V
max
values to fit the experimental data
need not be great, largely cluster together, and form a different dis-
tribution to the experimentally determined values. (B) Score 1 explains
over 99% of the total variance, so the gulf between the results of the
original model and the set of fitted and experimental concentrations is
much greater than that which separates the fitted and experimental
concentrations themselves. The clustering of fitted models indicates
that the fit of metabolite concentrations to the in vivo values, though
much better than the original model, is still not exact. (C) The fitted
values can be viewed either as a continuum between two extremes, or
as a cluster with two outliers. By either interpretation the fluxes des-
cribed by the original model are contained within the distribution of
fitted models. The in vivo fluxes, however, are clear outliers to this
distribution. This plot suggests that the model as described in [7] and
herein, is not capable of representing the state of glycolysis determined
experimentally in the Teusink et al. paper.
3898 L. Pritchard and D. B. Kell (Eur. J. Biochem. 269) Ó FEBS 2002
contributions from hexokinase in the circumstances that
bothHXTandHKV
max
values are halved, and
ADH(V
max
) is doubled. Regime III features significant
joint glycolytic flux control by HXT, HK and ADH. This
regime is characterized by low ADH(V
max
) and high
Gra3PDH(V
max
) and is similar to a sub regime of extreme
PFK flux control in which C
JðglycolysisÞ
ADH
approaches 0.2, in
that it is correlated with reduced ADH(V
max
) and that an
exponential increase in FCCs is seen (Figs 4 and 5). Each of
the three major flux control regimes contains several sub
regimes, but the gross features of each remain as stated.
DISCUSSION
Model fitting
The original fitting procedure employed in [7] algebraically
fitted the V
max
values for individual steps to experimentally
determined mean metabolite concentrations and pathway
fluxes. With such mathematical precision available, it may
be argued that the computationally expensive stochastic
fitting procedure we employed is unnecessary. However,
individual algebraic fitting of the model steps has the
advantage of providing exact solutions only with this
caveat: that the solutions so found fit exactly to mean
experimental values, which themselves contain some
uncertainty. Each such solution represents only one
possible experimental state that may not actually have
been observed. Multiple fits for individual steps compound
this problem, and may produce the illusion of an absolute
and unambiguous fit of the whole model to experimental
data where this is not, in fact, the case. Indeed, in [7] an
exact fit proved not to be possible for all model steps
within the constraints of the Haldane equation, so the
model as a whole could not be fit absolutely to the
experimentally determined means. For this work, we
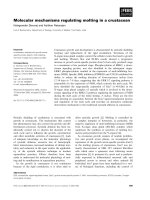
Fig. 3. Significant correlations (two-tailed Spearman’s Rank, P < 0.05) between flux control coefficients for glycolytic fluxes across all fitted models.
Positive correlations are indicated by heavy shading, negative by light shading. The sets of fluxes are grouped into (A) upper glycolysis (PGI, PFK,
ALD), (B) lower glycolysis (Gra3PDH-PDC), (C) ADH, and (D) succinate and glycerol branches.
Table 3. Eigenvalues from PCA of fitted models. Eigenvalues, and the percentage of total variance explained by each eigenvalue, for the first five
principal components in PCA of the fitted V
max
values, steady-state glycolytic fluxes and steady-state metabolite concentrations of the fitted models
and the corresponding experimentally derived values. Most variance is explained in the first two principal components (PCs) in each case.
V
max
Flux Metabolite conc
PC Abs % Abs % Abs %
1.00 2.77 · 10
6
42.49 1525.74 90.73 63.08 99.10
2.00 2.31 · 10
6
35.38 125.51 7.46 0.26 0.41
3.00 6.24 · 10
5
9.57 30.40 1.81 0.13 0.21
4.00 4.44 · 10
5
6.81 0.00 0.00 0.08 0.13
5.00 2.54 · 10
5
3.90 0.00 0.00 0.06 0.10
Total 6.52 · 10
6
1681.65 63.65
Ó FEBS 2002 Flux control in yeast glycolysis (Eur. J. Biochem. 269) 3899
employed a stochastic fitting procedure to estimate optimal
values for the V
max
values of the glycolytic steps. This
procedure attempts to minimize the difference between the
model and an experimental steady state and, though an
exact fit was not obtained, several close fits were. This
approach possesses the twin advantages of simultaneously
fitting all steps in the model, and providing a population
of candidate fits that, if the fitness landscape of the model
resembles that of the experimental system, may itself be
considered to describe the population of the experimental
system.
Although kinetic parameters (K
m
, K
eq
, k
cat
, etc.) of each
step were used in the fitting procedure of [7], we chose not to
employ them as parameters for evolutionary optimization in
this paper in order to avoid underdetermination. We were
initially concerned that in ignoring kinetic parameters for
fitting, we could be ignoring critical factors for model
performance. However, other work suggests that the
important control properties of biochemical pathways are
quite robust to small changes in the kinetic parameters of
their constituent enzymes [29], consistent with the expecta-
tions of metabolic control analysis [30]. This would seem to
imply that the differences in K
m
between the determined and
in vivo values for the model enzymes, except where large, are
of only minor importance. Furthermore the values of
kinetic constants over a series of experiments are usually
consistent, and the error over all experiments can be much
greater than that seen in any single experiment [31]. We
therefore reasoned that, for the fitting procedure, there was
little need to account for the experimental error in the
evaluation of Michaelis constants. We thus considered that,
for fitting the model, the best representation of the likely
origins of the difference between in vivo and in vitro
performance of individual enzymes was the difference
between the effective enzyme activities as described by V
max
.
The failure of the fitting procedure to match in vivo
performance may be problematic, but we believe the results
still to be of value. Experimental values of metabolite
concentration and flux are obtained from populations of
yeast cells and so reflect an aggregate of the states of many
individual organisms. Although no fitted model in this
paper individually replicates the in vivo glycolytic system
investigated in [7] exactly, it is arguable whether the majority
of yeast cells (as represented by the model of glycolysis) in
the studied cultures would correspond to the experimental
results either [32,33]. Systematic variations within such a
population are of interest because they may reveal certain
global characteristics of the system, such as unified or
distributed coresponse to perturbation. Linkage between
the responses of subgroups of enzymes in the pathway can
provide useful information for metabolic engineering, in
terms of which steps are ÔlumpedÕ together, and so respond
as a unit [34]. For the fitting experiments described herein,
perturbations to the system are made through varying
in silico the expression levels of these enzymes; thus linkage
between control coefficients might imply a physiological
Fig. 4. Plots of flux control coefficients for (A) upper and (B) lower
glycolytic enzymes against simulation number. The control regimes are
divided into the three main groups I, II and III, and further subdivided
by the level of secondary flux control exerted by each enzyme. PFK has
dominating control under regime I, while HXT has dominating control
under regimes II and III. Regime III can be distinguished from regime
II by the significant flux control exerted by ADH.
Fig. 5. Score plot for PCA of the flux control coefficients for all steps in
all the models resulting from parameter scanning (see text). The labelled
clusters are readily distinguished correspond to flux control regimes I,
II and III in Fig. 4. Subdivision of the major clusters as shown in Fig. 4
canalsobeseeninthisplot.
3900 L. Pritchard and D. B. Kell (Eur. J. Biochem. 269) Ó FEBS 2002
method of controlling glycolytic response achievable by
coordinated regulation of enzyme expression.
Control of glycolytic flux in the model systems
All the models that were fitted to in vivo steady-state
metabolite concentration were found to operate under a
single regime for glycolytic flux control, in which hexose
transport has more-or-less complete control of flux, with a
secondary role for hexokinase and the remainder of main-
chain glycolysis having only minimal relevance. This pattern
has previously been observed in a study of glycolytic flux
control in rat heart perfused with glucose [35]. PFK, which
has traditionally been considered the ÔkeyÕ enzyme in the
control of glycolysis [2,36,37], was seen to play no significant
role in terms of flux control in these models.
Flux-control coefficients represent the extent to which the
flux through one step of a pathway responds to a change in
flux through another step [21]. For variations in enzyme
limiting rates, correlations between FCCs may reveal
whether the control of pathway flux through a step operates
under only one, or one of several rival schemes depending
on the precise pattern of enzyme expression. The correla-
tions observed in this study suggest that the flux control is
partitioned between HXT and a coherent unit of flux
control formed from main chain glycolysis and the branch-
ing steps. As the control exerted by the hexose transport step
on fluxes through the rest of glycolysis increases, the
combined flux control by the branching steps and by the
main-chain glycolytic enzymes is relaxed.
Even though there is some partitioning of flux control
between sections of yeast glycolysis, and a (potentially
unreachable) region of parameter space in which PFK
dominates flux control it is clear that, at least in these
models, hexose transport can be considered to be a Ôpace
makingÕ step for glycolysis under a wide range of conditions.
This role for hexose transport is not a new proposal, and
this property of the glycolysis pathway has been observed in
other models [4,38]. Neither HXT nor HK is insensitive to
the levels of its own product, and therefore the glycolytic
pathway is not a ÔslaveÕ pathway to either of those steps [39].
S. cerevisiae possesses 20 genes that encode proteins
homologous to HXTs, though not all of them are
transporters, nor are they all specific for glucose [39–41].
The variety of transporters not only allows the organism to
grow on substrates other than glucose, but it also provides
for at least two modes of glucose uptake: a high-affinity
mode that operates at low glucose concentrations and a
low-affinity mode that is used when the environmental
glucose concentration rises. The membrane-spanning trans-
porters operate by facilitated diffusion, but they are not
constitutively expressed for either affinity mode. Instead, the
transporters are transcriptionally regulated by at least three
known modes of induction, which operate in different
combinations dependent on the prevailing concentration of
glucose [40]. Hexose transport is thus expected to take an
active role in the regulation of glycolytic flux, and evolu-
tionary selection for the intricate control of function and
regulation observed in its hexose transport system
[39,40,42,43] appears to be aimed at regulating glycolysis
and ATP supply.
Glucose is also known to regulate gene expression,
facilitating its own use by inducing expression of genes for
its own metabolism and repressing those involved in
processing other carbon sources [44]. It has been postulated
that there are multiple such regulatory systems, some direct,
and some indirectly operating through glucose-dependent
cues [41]. It has also been noted that there is a more-or-less
linear relationship between regulation of glucose transport
capacity in S. cerevisiae and residual substrate concentra-
tion in chemostat cultures [45]. It was noted in the same
study that at low dilution rates (i.e. low glucose levels) where
the high affinity transport system dominates, the relation-
ship breaks down such that HK activity is constant. This
has the implication that the high affinity glucose transport
system (unlike the low affinity system) acts so as to maintain
a constant intracellular supply of glucose, and constant
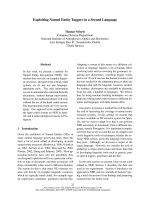
Fig. 6. A plot of C
PFK
HXT
and C
PFK
PFK
against limiting rates for hexose
transport and PFK, illustrating the switch between PFK and HXT-
dominated flux control regimes. PFK control derives from a reduction
in limiting rate for PFK at high levels of glucose flux across the
membrane. A plot corresponding to the same region of parameter
space in HXT and PFK limiting rate, illustrating the internal steady-
state concentrations of glucose-6-phosphate and fructose-6-phosphate.
The concentrations of both these metabolites can be seen to rise rapidly
as the system enters PFK control. The concentration of G6P in par-
ticular rises quickly to pathological levels (> 100 m
M
).
Ó FEBS 2002 Flux control in yeast glycolysis (Eur. J. Biochem. 269) 3901
glycolytic flux in the face of near-starvation. The hexose
transport system here appears to behave in such a manner
as to maintain glucose flux across the membrane at a higher
level than would otherwise be expected [45,46].
Hexose transport has been shown to exert the bulk of
control over growth rate and glucose repression in mutant
yeast expressing only the HXT7 (high-affinity) glucose
transporter [47], and over the frequency of glycolytic
oscillations in yeast [48]. This latter set of experiments
extends observations of HXT control over glycolytic flux to
nonsteady state systems. Hexose transport has also been
shown to be the major flux-control step in S. bayanus
glycolytic flux control [49]. The evolutionary effort required
to develop and maintain this set of biological checks and
balances is intuitively indicative of some importance to
maintaining consistent rates of glucose transport, which is in
line with the observation in these models that control of
glycolytic flux under normal operating conditions is strongly
dependent on glucose transport flux. The minor role played
by glycolytic enzymes in the control of glycolytic flux
observed here is also consistent with previous observations.
Regime I (Figs 4 and 5), in which PFK is the dominant
control step, is of particular interest given the historical
importance placed on PFK as a Ôrate-limitingÕ enzyme in
yeast glycolysis [2,36,37]. For this model, majority control of
glycolytic flux passes from hexose transport to PFK for a
given glucose influx when the limiting rate through PFK
falls (Fig. 6A). As has been previously suggested, this effect
could derive from such causes as allosteric regulation or
reduced expression level [37,50]. However, reduction of
PFK(V
max
) results in the accumulation of what would be
expected to be pathological levels of Glc6P and Fru6P
(Fig. 6B), reminiscent of the proposed effect of removing
the glycosomal membrane from trypanosomes [11]. How-
ever, for this restrictive model of glucose-derepressed yeast
glycolysis the fluxes to glycogen and trehalose have been set
at constant values, and so the alternative routes for disposal
of these intermediates are somewhat less flexible than might
be expected in vivo.
It has been suggested that this model may represent the
Tps1D phenotype, in which the trehalose phosphate synth-
ase activity that may limit hexokinase (reducing glucose
uptake) is not present [7]. This is also suggested by the
results of our parameter scanning, where only 12.5% of
systems with increased HXT(V
max
) reach steady-state.
Those systems with increased HXT limiting rate that are
able to reach steady-state share the characteristics of
reduced HK(V
max
), consistent with feedback from trehalose
6-phosphate to HKs (absent in this model). Steady-state is
recovered in some model scans by a reduced limiting rate for
PFK, but increased ALD(V
max
). The pathological effect of
accumulating Fru6P and Glc6P may well be alleviated by
different mechanisms in vivo, but for the purposes of this
model of glucose-derepressed yeast glycolysis the PFK
control region is rendered unreachable.
Fivefold overexpression of PFK in S. cerevisiae was also
previously seen not to increase glycolytic flux under
anaerobic conditions, the conditions of the studied model
[51]. Likewise, regulation of PFK by Fru2,6P
2
does not
seem to affect glycolytic flux to any great extent, despite the
implications of models that place PFK central to control of
glycolysis [52,53]. Over-expression of other enzymes in the
pathway, both individually and in various combinations,
has also been seen to have little or no effect on glycolytic
flux, concordant with this model [54].
CONCLUSIONS
Yeast glycolysis is one of a very few metabolic systems for
which comprehensive kinetic data are available. Such
complex, highly integrated systems are difficult and expen-
sive to elucidate by laboratory experiment, and their future
interpretation and analysis will rest heavily on the use of
computational and bioinformatics techniques. We employed
some of these techniques to investigate patterns of flux
control in S. cerevisiae glycolysis. Recent experimental work
suggests that control of glycolytic flux in S. cerevisiae resides
mostly in the transmembrane glucose transport step under a
wide range of conditions, although a role has previously
been suggested for flux control by PFK. We used parameter
scanning of a detailed model of glucose-derepressed yeast
glycolysis, fitted to experimental data, in order to simulate a
much wider scope of variation in enzyme expression levels
than could reasonably be carried out in vitro or in vivo.Our
results suggest that, over a wide range of operational
parameters, control of the glycolytic flux may be classified
into three major regimes, one of which is dominated by
PFK flux control but is perhaps biologically unfeasible,
while the two accessible control regimes operate under
majority hexose transport flux control.
ACKNOWLEDGEMENTS
The authors would like to thank Bas Teusink for supplying the
SCAMP
model of yeast glycolysis, David Broadhurst for HOBBES and
statistical advice, and the referees for their helpful and improving
suggestions.
REFERENCES
1. Dandekar,T.,Schuster,S.,Snel,B.,Huynen,M.&Bork,P.
(1999) Pathway alignment: application to the comparative analysis
of glycolytic enzymes. Biochem. J. 343, 115–124.
2. Boiteux, A. & Hess, B. (1981) Design of glycolysis. Phil. Trans.
Roy. Soc. Lond. B. 293, 5–22.
3. Eschrich, K., Schellenberger, W. & Hofmann, E. (1990) A hys-
teretic cycle in glucose-6-phosphate metabolism observed in a cell-
free yeast extract. Eur. J. Biochem. 188, 697–703.
4. Cortassa, S. & Aon, M.A. (1997) Distributed control of the gly-
colytic flux in wild-type cells and catabolite repression mutants of
Saccharomyces cerevisiae growing in carbon-limited chemostat
cultures. Enzyme Microbial Technol. 16, 761–770.
5. Rizzi, M., Baltes, M., Theobald, U. & Reuss, M. (1997) In vivo
analysis of metabolic dynamics in Saccharomyces cerevisiae 2.
Mathematical model. Biotechnol. Bioengineering 55, 592–608.
6. Bier, M., Bakker, B.M. & Westerhoff, H.V. (2000) How yeast cells
synchronize their glycolytic oscillations: a perturbation analytic
treatment. Biophys. J. 78, 1087–1093.
7. Teusink, B., Passarge, J., Reijenga, C.A., Esgalhado, E., van der
Weijden, C.C., Schepper, M., Walsh, M.C., Bakker, B.M., van
Dam, K., Westerhoff, H.V. & Snoep, J.L. (2000) Can yeast gly-
colysis be understood in terms of in vitro kinetics of the constituent
enzymes? Testing biochemistry. Eur. J. Biochem. 267, 5313–5329.
8. Wolf, J. & Heinrich, R. (2000) Effect of cellular interaction on
glycolytic oscillations in yeast: a theoretical investigation. Bio-
chem. J. 345, 321–334.
9. Bakker, B.M., Walsh, M.C., terKuile, B.H., Mensonides, F.I.C.,
Michels, P.A.M., Opperdoes, F.R. & Westerhoff, H.V. (1999)
3902 L. Pritchard and D. B. Kell (Eur. J. Biochem. 269) Ó FEBS 2002
Contribution of glucose transport to the control of the glycolytic
flux in Trypanosoma brucei. Proc. Natl Acad. Sci. USA 96, 10098–
10103.
10. Bakker, B.M., Michels, P.A.M., Opperdoes, F.R. & Westerhoff,
H.V. (1999) What controls glycolysis in bloodstream form Try-
panosoma brucei? J. Biol. Chem. 274, 14551–14559.
11. Bakker, B.N., Mensonides, F.I.C., Teusink, B., vanHoek, P.,
Michels, P.A.M. & Westerhoff, H.V. (2000) Compartmentation
protects trypanosomes from the dangerous design of glycolysis.
Proc. Natl Acad. Sci. of the USA 97, 2087–2092.
12. Bakker, B.M., Westerhoff, H.V., Opperdoes, F.R. & Michels,
P.A.M. (2000) Metabolic control analysis of glycolysis in trypa-
nosomes as an approach to improve selectivity and effectiveness of
drugs. Mol. Biochem. Parasitol. 106, 1–10.
13. Giersch, C. (2000) Mathematical modelling of metabolism. Curr.
Opin. Plant Biol. 3, 249–253.
14. Mendes, P. (1993) Gepasi – a software package for modelling the
dynamics, steady-states and control of biochemical and other
systems. Comput. Applicat. Biosci. 9, 563–571.
15. Mendes, P. (1997) Biochemistry by numbers: simulation of bio-
chemical pathways with Gepasi 3. Trends Biochem. Sci. 22, 361–
363.
16. Mendes, P. & Kell, D.B. (1998) Non-linear optimization of bio-
chemical pathways: applications to metabolic engineering and
parameter estimation. Bioinformatics 14, 869–883.
17. Kell, D.B. & Mendes, P. (2000) Snapshots of systems: metabolic
control analysis and biotechnology in the post-genomic era.
Technological and Medical Implications of Metabolic Control.
Analysis (Cornish-Bowden, A.J. & Cardenas, M.L., eds), pp. 3–25.
Kluwer Academic, Amsterdam.
18. Kacser, H. & Burns, J.A. (1973) The control of flux. Symposia Soc.
Exp. Biol. 27, 65–104.
19. Kacser, H., Burns, J.A. & Fell, D.A. (1995) The control of flux.
Biochem. Soc. Trans. 23, 341–366.
20. Heinrich, R. & Schuster, S. (1996) The Regulation of Cellular
Systems. Chapman & Hall, New York.
21. Fell, D.A. (1997) Understanding the Control of Metabolism,
Portland, London.
22.Weiss,N.A.&Hassett,M.J.(1991)Introductory Statistics.
Addison-Wesley, Reading, MA.
23. Press, W.H., Teukolsky, S.A., Vetterling, W.T. & Flannery, B.P.
(1992) Numerical Recipes in C, the Art of Scientific Computing,2nd
edn. Cambridge University Press, Cambridge, UK.
24. Otto, M. (1999) Chemometrics: Statistics and Computer Applica-
tion in Analytical Chemistry.Wiley-VCH,Weinhein.
25. Martens, H. & Naes, T. (1989) Multivariate Calibration.John
Wiley, Chichester.
26. Joliffe, L.T. (1986) Principal Component Analysis. Springer-Verlag,
New York.
27. Shaw, A.D., Winson, M.K., Woodward, A.M., McGovern, A.,
Davey, H.M., Kaderbhai, N., Broadhurst, D.I., Gilbert, R.J.,
Taylor, J., Timmins, E.M., Alsberg, B.K., Rowland, J.J.,
Goodacre, R. & Kell, D.B. (1999) Rapid analysis of
high-dimensional bioprocesses using multivariate spectroscopies
and advanced chemometrics. Adv. Biochem. Bioengineering 66,
83–113.
28. Jones, A., Shaw, A.D., Salter, G.J., Bianchi, G. & Kell, D.B.
(1998) The exploitation of chemometric methods in the analysis of
spectroscopic data: application to olive oils. In Lipid Analysis of
Oils and Fats (Hamilton, R.J., ed.), Chapman & Hall, London.
29. Barkai, N. & Leibler, S. (1997) Robustness in simple biochemical
networks. Nature 387, 913–917.
30. Kell, D.B. (1999) Revolutionary Ideas Come Round Again [letter].
Nature 397, 644.
31. Duggleby, R.G. (1991) Analysis of biochemical data by nonlinear
regression: is it a waste of time? Trends Biochem. Sci. 16, 51–52.
32. Davey, H.M. & Kell, D.B. (1996) Flow cytometry and cell sorting
of heterogeneous microbial populations: the importance of single-
cell analysis. Microbiol. Rev. 60, 641–696.
33. Kell, D.B., Ryder, H.M., Kaprelyants, A.S. & Westerhoff, H.V.
(1991) Quantifying heterogeneity: flow cytometry of bacterial
cultures. Antonie van Leeuwenhoek 60, 145–148.
34. Raamsdonk, L.M., Teusink, B., Broadhurst, D., Zhang, N.,
Hayes, A., Walsh, M.C., Berden, J.A., Brindle, K.M., Kell, D.B.
& Rowland, J.J. (2001) A functional genomics strategy that uses
metabolome data to reveal the phenotype of silent mutations. Nat.
Biotechnol. 19, 45–50.
35. Kashiwaya, Y., Sato, K., Tsuchiya, N., Thomas, S., Fell, D.A.,
Veech, R.L. & Passonneau, J.V. (1994) Control of glucose utili-
zation in working perfused rat-heart. J. Biol. Chem. 269, 25502–
25514.
36. Stryer, L. (1995) Biochemistry (Fourth Edition). W.H. Freeman,
New York.
37. Evans, P.R., Farrants, G.W. & Hudson, P.J. (1981) Phospho-
fructokinase: structure and control. Phil. Trans. Roy. Soc. Lond. B.
293, 53–62.
38. Gancedo, C. & Serrano, R. (1989) Energy-yielding metabolism. In
The Yeasts, 2nd edn. (Harrison, J.S., ed.), pp. 205–259. Academic
Press, London.
39. Teusink, B. & Westerhoff, H.V. (2000) ÔSlaveÕ metabolites and
enzymes – a rapid way of delineating metabolic control, Eur. J.
Biochem. 267, 1889–1893.
40. Ozcan, S. & Johnston, K. (1999) Function and regulation of yeast
hexose transporters. Microbiol. Mol. Biol. Rev. 63, 554–569.
41. Vaulont, S., Vasseur-Cognet, M. & Kahn, A. (2000) Glucose
regulation of gene transcription. J. Biol. Chem. 275, 31555–31558.
42. Ciriacy,M.&Reifenberger,E.(1997)Hexosetransport.InYeast
Sugar Metabolism: Biochemistry, Genetics, Biotechnology and
Applications (Entian, K D., ed.), pp. 45–65. Technomic, Lancas-
ter.
43. Reifenberger, E., Boles, E. & Ciriacy, M. (1995) Identification of
novel HXT genes in Saccharomyces cerevisiae reveals the impact
of individual hexose transporters on the glycolytic flux. Mol.
Microbiol. 16, 157–167.
44. Johnston, M. (1999) Feasting, fasting and fermenting – glucose
sensinginyeastandothercells.Trends Genet. 15, 29–33.
45. Postma, E., Scheffers, W.A. & van Dijken, J.P. (1989) Kinetics of
growth and glucose transport in glucose-limited chemostat cul-
tures of Saccharomyces cerevisiae CBS 8066. Yeast 5, 159–165.
46. Walsh, M.C., Smits, H.P., Scholte, M. & Van Dam, K. (1994)
Affinity of glucose transport in Saccharomyces cerevisiae is
modulated during growth on glucose. J. Bacteriol. 176, 953.
47. Ye, L., Kruckeberg, A.L., Berden, J.A. & Van Dam, K. (1999)
Growth and glucose repression are controlled by glucose transport
in Saccharomyces cerevisiae cells containing only one glucose
transporter. J. Bacteriol. 181, 4673–4675.
48. Reijenga, K.A., Snoep, J.L., Diderich, J.A., van Verseveld, H.W.,
Westerhoff,H.V.&Teusink,B.(2001)Controlofglycolytic
dynamics by hexose transport in Saccharomyces cerevisiae.
Biophys. J. 80, 626–634.
49. Diderich, J.A., Teusink, B., Valkier, J., Anjos, J., SpencerMartins,
I., vanDam, K. & Walsh, M.C. (1999) Strategies to determine the
extent of control exerted by glucose transport on glycolytic flux in
the yeast Saccharomyces bayanus. Microbiology-UK. 145, 3447–
3454.
50. Kopperschlager, G. & Heinisch, J. (1997) Phosphofructokinase. In
Yeast Sugar Metabolism: Biochemistry, Genetics, Biotechnology
and Applications (Entian, K D., ed.), pp. 97–118. Technomic,
Lancaster.
51. Davies, S.E.C. & Brindle, K.M. (1992) Effects of overexpression of
phosphofructokinase on glycolysis in the yeast Saccharomyces
cerevisiae. Biochemistry 31, 4729–4735.
Ó FEBS 2002 Flux control in yeast glycolysis (Eur. J. Biochem. 269) 3903
52. Muller, S., Zimmermann, F.K. & Boles, E. (1997) Mutant studies
of phosphofructo-2-kinase do not reveal an essential role of
fructose-2,6-biphosphate in the regulation of carbon fluxes in yeast
cells. Microbiology 143, 3055–3061.
53. Goncalves, P. & Planta, R.J. (1998) Starting up yeast glycolysis.
Trends Microbiol. 6, 314–319.
54. Schaaf, I., Heinisch, J. & Zimmermann, F.K. (1989) Over-
production of glycolytic enzymes in yeast. Yeast 5, 285–290.
APPENDIX 1: DIFFERENTIAL
EQUATIONS
The set of ordinary differential equations that describes
time-dependence of the metabolite concentrations is given
below. This set differs from that in [7] in that it includes
explicit equations for adenosine phosphate and triose
phosphate species (A5, A6, A13–A15), and in that there is
no involvement of the adenosine species in the succinate
branch. Enzyme kinetics are as described previously [7].
d½GLC
i
dt
¼ mHXT À mHK ðA1Þ
d½Glc6P
dt
¼ mHK À mPGI À mglycogen À 2 Â mtrehalose
ðA2Þ
d½Fru6P
dt
¼ mPGI À mPFK ðA3Þ
d½Fru1;6P
2
dt
¼ mPFK À mALD ðA4Þ
d½glycerone phosphate
dt
¼ mALD À mTPI À mGro3PDH
ðA5Þ
d½glycerone phosphate
dt
¼ mALD þ mTPI À mGra3PDH
ðA6Þ
d½Gri1;3P
2
dt
¼ mGra3PDH À mPGK ðA7Þ
d½Gri3P
dt
¼ mPGK À mPGM ðA8Þ
d½Gri2P
dt
¼ mPGM À mENO ðA9Þ
d½phosphoenolpyruvate
dt
¼ mENO À mPYK ðA10Þ
d½pyruvate
dt
¼ mPYK À mPDC ðA11Þ
d½acetaldehyde
dt
¼ mPDC À mADH À msuccinate
ðA12Þ
d½AMP
dt
¼ mAK ðA13Þ
d½ADP
dt
¼ mHK þ mATPase þ mglycogen þ mtrehalose
þ mPFK À mPGK À mPYK À 2 Â mAK
ðA14Þ
d½ATP
dt
¼ mPGK þ mPYK þ mAK À mHK
À mglycogen À mtrehalose À mPFK
À mATPase ðA15Þ
d½NAD
dt
¼ mglycerol þ mADH À 3 Â msuccinate
À mGra3PDH ðA16Þ
d½NADH
dt
¼ mGra3PDH þ 3 Â msuccinate
À mGro3PDH À mADH ðA17Þ
APPENDIX 2: DEVIATION FROM
THE TEUSINK
ET AL.
MODEL
Variations between the model used for this work and the
model published in [7].
The variant parameters for enzyme rate equations are
those that were supplied to us in the model made available
by one of the authors of [7], and the only significant
difference between the performance of our model and that
in [7] is the value for steady state pyruvate concentration
(Table A1).
Table A1. Differences between the current model and that in Teusink
et a l. [7]. Minor differences between this paper and [7] in values of
kinetic parameters for the model are listed. The only significant dif-
ference in model performance is the steady-state concentration of
pyruvate, which in both cases is over four times as large as the reported
experimental concentration.
Item Teusink et al. (2000) [7] This paper
K
eq
(ADH) 1.45 · 10
4
6.9 · 10
)5
K
eq
(PGI) 0.314 0.29
k
ATPase
33.7 39.5
K
m
P2G(PGM) 0.1 0.08
cGra3PDH Not given 1.0
K
i
NAD(ADH) 0.92 Not used
cFru6P(PFK) 0 Not used
gT(PFK) 1 Not used
[pyruvate]
ss
8.52 8.37
3904 L. Pritchard and D. B. Kell (Eur. J. Biochem. 269) Ó FEBS 2002