Analysis of Pesticides in Food and Environmental Samples - Chapter 5 pdf
Bạn đang xem bản rút gọn của tài liệu. Xem và tải ngay bản đầy đủ của tài liệu tại đây (261.43 KB, 26 trang )
5
Quality Assurance
Árpád Ambrus
CONTENTS
5.1 Introduction 125
5.1.1 Quality Systems 126
5.1.2 Characterization of the Uncertainty and Bias of the Methods 127
5.1.2.1 Uncertainty of the Measurement Results 128
5.1.2.2 Systematic Error—Bias of the Measurements 130
5.2 Sampling 132
5.2.1 Quality of Samples 132
5.2.2 Sampling of Commodities of Plant and Animal Origin 134
5.2.3 Estimation of Uncertainty of Sampling 135
5.3 Sample Preparation and Processing 136
5.4 Stability of Residues 138
5.4.1 Stability during Storag e 138
5.4.2 Stability of Residues during Sample Processing 139
5.5 Method Validation 141
5.5.1 Internal Quality Control 142
5.6 Interlaboratory Studies 146
References 147
5.1 INTRODUCTION
The results of measurements should provide reliable information and the laboratory
should be able to prove the correctness of measurements with documented evidence.
Analysts carry serious responsibilities to produce correct and timely analytical
results, and are fully accountable for the quality of their work. The expanding
national and international trade, the responsibility of national registration authorities
permitting the use of various c hemicals required long ago reliable test methods,
which were acceptable by all parties concerned. The accuracy and precision of the
analytical results may be assured by proficient analysts applying properly validated
methods, which are fit for the purpose, in a laboratory accredited according to the
relevant standards or guidelines.
1,2
Several documents and guidelines had been, and
are developed to assist the analysts to apply the relevant analytical quality control
(AQC)
3
quality assur ance (QA) principles in their diverse daily work, and to provide
guidance for accreditation purposes. The Codex Committee on Pesticide Residues
(CCPR) continuously updates the Guidelines on Good Laboratory Practice,
4
ß 2007 by Taylor & Francis Group, LLC.
which also includes detailed information on the minimum criteria for validation of
methods. The EURACEM=CITAC* published additional guidelines on application
of quality assurance in nonroutine laboratories,
5
interpretation of proficiency test
results,
6
and traceability of measurements.
7
These documents and GLs are compli-
mentary to the requirements of the ISO
y
=IEC
z
17025 and OECD
§
GLP Principles,
and can be freely downloaded from the Internet.
5.1.1 QUALITY SYSTEMS
The Good Laboratory Practice (GLP) is a quality system concerned with the organ-
izational processes and the conditions under which nonclinical health and environ-
mental safety studies are planned, performed, monitored, archived, and reported.
The ISO=IEC 17025:2005 Standard, replacing the previous standards (ISO=IEC
Guide25 and EN 45001), contains all the general requirements for the technical
competence to carry out tests, including sampling, that laboratories have to meet
if they wish to demonstrate that they operate a quality system, and are able to generate
technically valid results. It covers analytical tasks performed using standard methods,
nonstandard methods, and laboratory-developed methods, and incorporates all those
requirements of ISO 9001and ISO 9002 that are relevant to the scope of the services
that are covered by the laboratory’s quality system. The OECD GLP GLs and the
ISO=IEC Standard focus on different fields of activities, but they have been developed
simultaneously, an d they are specifying basically the same requirements in terms
of AQC.
The quality assurance (QA) program aimed at achieving the required standard of
analysis. It means a defined system, including personnel, which is independent o f the
study conduct and designed to assure test facility management that the analyses of
samples or conduction of the studies comply with the established procedures.
Measurements of any type contain a certain amount of error. This error com-
ponent may be introduced when samples are collected, transported, stored, and
analyzed or when data are evaluated, reported, stored, or transferred electronically.
It is the responsibility of quality assurance programs to provide a framework for
determining and minimizing these errors through each step of the sample collection,
analysis, and data management processes. The process must ensure that we do the
right experiment as well as doing the experiment right.
8
Systems alone cannot
deliver quality. Staff must be trained, involved with the tasks in such a way that
they can contribute their skills and ideas and must be provided with the necess ary
resources. Accreditation of the laboratory by the appropriate national accreditation
scheme, which itself should conform to accepted standards, indicates that the
laboratory is applying sound quality assurance principles.
The internal quality control (QC) and proficiency testing are important parts
of the quality assurance program, which must also include the staff training,
* Co-operation on International Traceability in Analytical Chemistry.
y
International Standard Organisation.
z
International Electrotechnical Commission.
§
Organization for Economic Co-operation and Development.
ß 2007 by Taylor & Francis Group, LLC.
administrative procedures, management structure, auditing, and so on. The labora-
tory shall document its policies, systems, programs, procedures, and instructions to
the extent necessary to assure the quality of the results. The system’s documentation
shall be communicated to, understood by, available to, and implemented by the
appropriate personnel.
The laboratory shall have quality control procedures* for monitoring the
batch to batch validity, accuracy, and precision of the analyses undertaken. Meas-
urement and recording requirements intended to demonstrate the performance of
the analytical method in routine practice. The resulting data shall be recorded in
such a way that trends are detectable and, where practicable, statistical tech-
niques shall be applied for evaluating the results. This monitoring shall be planned
and reviewed and may include, but not be limited to, the regular use of certified
reference materials and=or internal quality control using secondary reference mater-
ials; participating in inte rlaboratory comparison or proficiency-testing programs;
performing replicate tests using the same or diff erent methods; and retesting of
retained items.
1
The analytical methods must be thoroughly validated before use according to
recognized protocol. These methods must be carefully and fully documented, staff
adequately trained in their use, and control charts should be established to ensure
the procedures are under proper statistical control. Successful participation in profi-
ciency test programs does not replace the establishment of within laboratory
performance of the method. The performance of the method should be fit for the
purpose and fulfill the quality requirements in terms of accuracy, precision, sensi-
tivity, and specificity. Where possible, all reported data should be traceable to
international standards by applying calibrated equipment and analytical standards
with known purity certified by ISO accredited supplier.
Presently, it is definitely more economical to contract out a few samples requir-
ing tests with special met hodology and expertise to well-established and experienced
(preferably accredited) laboratories, than to invest a lot of time, instruments, and so
on to set up and maintain a validated method (and experience to apply it) for
incidental samples in a laboratory.
As an external quality control, participating in proficiency-testing schemes,
provides laboratories with an objective means to demonstrate thei r capability of
producing reliable resul ts.
5.1.2 CHARACTERIZATION OF THE UNCERTAINTY AND BIAS OF THE METHODS
The interpretation of the results and making correct decisions require information on
the accuracy and precision of the measurements. The measurement process is
subjected to a number of influencing factors which may contribute to random,
systematic, and gross errors.
9,10
The quality control of the process aims to monitor
the uncertainty (repeatability, reproducibility) and trueness of the measurement
results.
* Synonymous with the term analytical quality control (AQC) and performance verification.
ß 2007 by Taylor & Francis Group, LLC.
5.1.2.1 Uncertainty of the Measurement Results
The uncertainty of the measurements is mainly due to some random effects. The
uncertainty ‘‘estimate ’’ describes the range around a reported or experimental result
11
within which the true value can be expected to lie within a defined level of probability.
This is a different concept to measurement error (or accuracy of the result) which can
be defined as the difference between an individual result and the true value. It is worth
noting that, while the overall random error cannot be smaller than any of its contrib-
uting sources, the resultant systematic error can be zero even if each step of the
determination of the residues provides biased results. Another important difference
between the random and systematic errors is that once the systematic error is quanti-
fied the results measured can be corrected for the bias of the measurement, while
the random error of a measurement cannot be compensated for, but its effects can be
reduced by increasing the number of observations.
The combined uncertainty is calculated as
10
u(y(x
i, j,
)) ¼
ffiffiffiffiffiffiffiffiffiffiffiffiffiffiffiffiffiffiffiffiffiffiffiffiffiffiffiffiffiffiffiffiffiffiffiffiffiffiffiffiffiffiffiffiffiffiffiffiffiffiffiffi
X
n
i¼1
c
2
i
u
2
i
þ
X
n
i,k¼1
c
i
c
k
u(x
i
,y
k
)
v
u
u
t
, (5:1)
where
u
i
is the standard uncertainty of the ith component
c
i
and c
k
are the sensitivity coefficients
u(x
i
,y
k
) is the covariance between x
i
and y
k
(i 6¼ k)
The covariance can be calculated with the regression correlation coefficient r
i,k
:
u(x
i
,x
k
) ¼u(x
i
) 3 u(x
k
) 3 r
ik
.
The uncertainty components of a residue analytical result may be grouped
according to the major phases of the determination
12
(external operations: sampling
(S
S
), packing, shipping, and storage o f samples; preparation of test portion: sample
preparation and sample processing (S
Sp
); analysis (S
A
): extraction, cleanup, evapor-
ation, derivatiz ation, instrumental determination). The major sources of the random
and systemat ic errors
13
are summari zed in Tab le 5.1. The ir nature and contr ibution to
the combined uncertainty of the results will be discussed in the following sections.
The general equation can be simplified for expression of the combined relative
standard uncertainty (CV
Res
) of the results of pesticide residue analysis.
CV
Res
¼
ffiffiffiffiffiffiffiffiffiffiffiffiffiffiffiffiffiffiffiffiffiffiffiffi
CV
2
S
þ CV
2
L
q
and CV
L
¼
ffiffiffiffiffiffiffiffiffiffiffiffiffiffiffiffiffiffiffiffiffiffiffiffiffiffi
CV
2
Sp
þ CV
2
A
q
, (5:2)
where CV
S
is the uncertainty of sampling and CV
L
is the combined uncertainty of the
laboratory phase including sample processing (Sp) and analysis (A). The preparation
of portion of sample to be analyzed
14
as part of the sample preparation step (such as
gentle rinsing or brushing to remove adhering soil, or taking outer withered loose
leaves from cabbages) cannot be usually validated and its contribution to the uncer-
tainty ofthe results cannot be estimated. If the combined uncertainty iscalculated from
ß 2007 by Taylor & Francis Group, LLC.
TABLE 5.1
Major Sources of Random and Systematic Errors in Pesticide Residue Analysis
a
Sources of Systematic Error Sources of Random Error
Sampling Wrong sampling design or operation Inhomogeneity of analyte in sampled object
Degradation, evaporation of analytes during preparation,
transport and storage
Varying ambient (sample material) temperature during tran spo rt and storage
Varying sample size
Sample
preparation
The portion of sample to be analyzed (analytical sample)
may be incorrectly selected
The a nalytical sample is in contact and contaminated by other portions of the sample
Rinsing, brushing is performed to various extent; s talks and stones may be
differentially removed
Nonhomogeneity of the analyte in single units of the analytical sample
Sample processing Decomposition of analyte during sample processing,
cross-contamination of the samples
Nonhomogeneity of the analyte in the ground=chopped analytical sample
Variation of temperature during the homogenization process
Texture (maturity) of plant materials affecting the efficiency
of homogenization process
Varying chopping time, particle size distribution
Extraction=cleanup
Quantitative
determination
Incomplete recovery of analyte
Interference of coextracted materials (load of the adsorbent)
Interference of coextracted compounds
Incorrectly stated purity of analytical standard
Biased weight=volume measurements
Determination of substance which does not originate
from the sample (e.g., contamination from the
packing material)
Determination of substance differing from the
residue definition
Biased calibration
Variation in t he composition (e.g., water, fat, and sugar content) of sample materials
taken from a commodity
Temperature and composition of sample=solvent matrix
Variation of nominal volume of devices with in the permit ted tolerance interv als
Precision and linearity of balances
Variable derivatization reactions
Varying i njectio n, chromatographic and detection conditions (matrix effect, s ys tem
inertness, detector response, sig nal- to-n oise variation, etc.)
Operator effects (lack of attention)
Calibration
a
Some processes and actions may cause both systematic and random error. They are listed where the contribution is larger.
ß 2007 by Taylor & Francis Group, LLC.
the linear combination of the variances of its components, according to the Welch–
Satterthwaite formula the degree of freedom of the estimated uncertainty is
n
eff
¼
S
4
c(y)
X
N
i¼1
S
4
i(y)
n
i
, (5:3)
with n
eff
P
N
i¼1
n
i
. The S
c(y)
¼u
c(y)
values may be replaced with S
c(y)
=y (CV)
values where the combined uncertainty is calculated from the relative standard
deviations.
11
The CV
L
can be calculated from CV
Sp
and CV
A
obtained during the method
validation, or from the results of reanalysis of replicate test portions of samples
containing field-incurred residues, as part of the internal quality control. Reference
materials are not suitable for this purpose as they are thoroughly homogenized.
If the relative difference of the residues measured in replicate portions is R
Di
¼
2(R
i1
ÀR
i2
)=(R
i1
þR
i2
), then CV
L
is
CV
L
¼
ffiffiffiffiffiffiffiffiffiffiffiffiffi
P
n
i¼1
R
2
Di
2n
v
u
u
u
t
, (5:4)
where n is the number of measurement pairs, and the degree of freedom of the
corresponding standard deviation is equal to n.
The analytical phase may include, for instance, the extraction, cleanup, evapor-
ation, derivatization, and quantitative determination. The ir contribution to the uncer-
tainty of the analysis phase (CV
A
) can only be conveniently determined by applying
14
C-labeled compounds,
15,16
but it is usually sufficient to estimate their combined
effects by the recovery studies. The repeatability of instrumental determination,
which does not take into account the effect of preparation of calibration from
different sets of standard solutions, can be easily quantified. However, the determin-
ation of the total uncertainty of the predicted concentration based on the approxima-
tions described, for instance, by J.N. Miller and J.C. Miller,
9
or Meier and Zünd
17
require special software to avoid tedious manual calculations.
5.1.2.2 Systematic Error — Bias of the Measurements
The systematic errors can occur in all phases of the measurement process. However,
it practically cannot be quantified during the external, field phase of the process.
Once the sample is taken, the most accurate and precise determination of the system-
atic error including that caused by the efficiency of extraction and dispersion of
residues in the treated material can be carried out with radiolabeled compounds.
Unfortunately, routine pesticide residue laboratories very rarely have access to facil-
ities suitable for working with radioisotopes. Nevertheless, very useful information on
stability of residues during storage, efficiency of extraction, and distribution of
residues can be found in the FAO=WHO series of Pesticide Residues—Evaluations,
which are published annually by FAO, and can be freely downloaded from the
ß 2007 by Taylor & Francis Group, LLC.
Web site of the Pesticide Management Group.
18
Another source of information is the
data submitted to support the claim for registration of the pesticides. Though the
whole package is confidential, that part relating to the analysis of residues could be
made accessible for laboratories analyzing pesticide resi dues.
Alternately, laboratories may test the bias of their measurement results with
performing recovery studies usually spiking the test portion of the homogenized
sample with a known amount of the analyte (R
0
) before the extraction. It should be
born in mind that the recovery tests can provide information on the systematic error
and precision of the procedure only from the p oint of spiking. Thus, following the
usual procedure it will not indicate the loss of residues during storage and sample
processing. The recovery studies are normally performed with untreated samples.
Where untreated samples are not available or the final extract of blank sample gives
detectable response, the analyte equivalent of the average instrument signal obtained
from the unspiked sample shall be taken into account. When the average recovery is
statistically significantly different from 100%, based on t-test, the results should
generally be corrected for the average recovery.
10,19
It should be noted, however, that
currently some regulatory authorities require results which are not adjusted for the
recovery. It may lead to a dispute situation when parties testing the same lot applying
methods producing different recoveries. For instance, the shipment may be simply
rejected due to the lower recoveries of analytical method used in the exporting
country. Another area, where reporting the most accurate result is necessary, is
providing data for the estimation of exposure to pesticide residues. In this case the
residues measured should be corrected for the mean recovery, if that is significantly
different from 100%. In order to avoid any ambiguity in reporting results, when a
correction is necessary, the analyst should give the uncorrected as well as the
corrected value, and the reason for and the method of the correction.
20
The uncertainty of the mean recovery, CV
Q
¼
CV
A
ffiffi
n
p
, affects the uncertainty of
the corrected results CV
Acor
¼
ffiffiffiffiffiffiffiffiffiffiffiffiffiffiffiffiffiffiffiffiffiffiffiffiffi
CV
2
A
þ CV
2
Q
q
. On the one hand, the increase of
the uncertainty of the residue values adjusted for the recovery can be practically
eliminated if the mean recovery is determined from !15 measurements (CV
Acor
1.03 CV
A
). On the other hand, if corrections would be made with a single procedural
recovery, the uncertainty of the corrected result would be 1.41 CV
A
. Therefore, such
correction should be avoided as far as practical.
The recovery values obtained from performance verification usually symmetric-
ally fluctuate around their mean, which indicates that the meas ured values are
subjected to random variation. If the procedural recovery performed with an analy-
tical batch is within the expected range, based on the mean recovery and within-
laboratory reproducibility of the method, the analyst demonstrated that the method
was applied with expected performance. Therefore, the correct approach is to use the
typical recovery established from the method validation and the long-term perform-
ance verification (within laboratory reproducibility studies) for correction of the
measured residue values, if necessary.
Under certain circumstances, such as extraction of soil samples, the extraction
conditions cannot be fully reproduced from one batch of samples to the next, leading
occasionally to much higher within laboratory reproducibility than repeatability
ß 2007 by Taylor & Francis Group, LLC.
(3S
r
< S
R
). In this case, the use of concurrent recovery for adjusting the measured
residues may provide more accurate results. Where correlation between the residue
values observed, the uncertainty of the residue value adjusted for the recovery should
be calculated according to Equation 5.1. Where correlation between the results is
quantifiable, it may be necessary to perform at least two recovery tests in one
analytical batch covering the expected residue range, and use their average value
for correction to reduce the uncertainty and improve the accuracy of the results.
5.2 SAMPLING
The analytical results cannot be better than the sample which is analyzed. Even
though the importance of reliable sampling has long been recognized, the majority of
regulatory laboratories concentrated only on the validation and establishing perform-
ance characteristics of the methods. Very little attention was paid to the quality of the
sample as the results of measurements were related only to the sample ‘‘as received ’’
and not to the sampled commodity. The ISO=IEC Standard 17025 has changed the
situation requiring the incorporation of sampling uncertainty in the combined uncer-
tainty when relevant.
Methods of sampling for the analysis of pesticide residues cannot be validated.
Obtaining representative sample which reflects the residue content of the sampled
commodity or object can only be assured by careful planning of the sampling
program, providing clear instructions for the actual sampling operation including
packing and shipping of samples.
The sampling method depends on the objectives of the analys is, and hence the
sampling plan and protocol should be prepared jointly by the managers making
decision based on the results, the analysts, and the sampling officers responsible for
taking the samples. The objectives of the investigation and the corresponding
acceptable uncertainty of the measurement results (CV
Res
), expressed with Equation
5.2, will determine the size, frequency (time or distance), spaci ng, mixing, dividing
of samples, and consequently the time required for sampling and the cost of
sampling, shipping, and analysis of samples. Careful balancing of cost and benefit
is a key component of designing sampling plans.
The information on the uncertainty of sampling, subsampling, and sample
processing is equally important as the information on the uncertainty of analyses.
5.2.1 QUALITY OF SAMPLES
The purpose of sampling is to provide for a specific aim (determine one or some of
the characteristic properties) a part of the object that is representative and suitable for
analysis. The part of the object taken for further examination is the sample which is
usually a very small portion (10
À5
to 10
À6
) of the sampled object (e.g., 1–2kgof
apples taken from an orchard of 2 ha yielding 50,000–60,000 kg fruits, or taking
20 soil cores from 5 ha field). The sample may be a single unit or an increment, or it
may contain a number of primary samples* defined by the sample size in case of a
* One or more units taken from one position in a lot.
ß 2007 by Taylor & Francis Group, LLC.
composite bulk sample, from which the laboratory sample may be prepared. The test
portion (usually 2–50 g) is a representative part of the laboratory sample, which is
extracted.
To prepare such a small fraction of the sampled object providing unbiased
information with quantifiable uncertainty requires well-defined procedures per-
formed by very responsible and technically highly qualified staff. The samples and
the test portions analyzed should satisfy some basic quality requirements:
.
Represent the properties of the object under investigation (composition,
particle size distribution)
.
Be of the size that can be handled by the sampler and the analyst; keep the
properties the object had at the time of sampling; be suitable to give
the required information (e.g., mean composition, composition as a func-
tion of time or place); and keep its identity throughout the whole procedure
of transport and analysis
21
To develop a quality sampling plan, the following actions should be taken and points
may be considered:
.
Purpose of the study (different sampling procedure would be required if we
want to obtain information on the average residue in a commodity or the
distribution of residues in crop units, within one field (or lot) or between
fields)
.
Clear definition of the object, which can usually be properly defined by the
lot=batch number, the space coordinates and the time
.
Collection of information of the properties of the objects before sampling
(it may be necessary to inspect the site to determine the conditions and
equipment required)
.
Selection of suitable sampling method and tools; testing the suitability of
containers to be used to collect, pack, and ship the samples, taking also into
account the health, safety, and security precautions
.
Determination of the time required for reaching the sampling site and
handling the samples
.
Provisions for prevention of contamination and deterioration of samples at
all stages, including size reduction of bulk sample
.
Arrangement for sealing, labeling, delivering the samples and the sampling
record to the laboratory in unchanged conditions, and assuring integrity of
the whole operation
.
Preparation of preprinted sampling record sheet which guides the operator
to collect and record all essential information including deviations from the
sampling protocol
.
Training of sampling personnel to assure that they are aware of the purpose
of the operation and the provisions to be taken for obtaining reliable
samples (e.g., permitted flexibility to adapt the sampling method for
the particular conditions, recording requirements, legal actions, etc.)
ß 2007 by Taylor & Francis Group, LLC.
5.2.2 SAMPLING OF COMMODITIES OF PLANT AND ANIMAL O RIGIN
For testing compliance with maximum residue limits (MRL), the CCPR elaborated a
procedure which became widely accepted and used in many countries.
22
A Codex
MRL for a plant, egg, or dairy product refers to the maximum level permitted to
occur in a composite bulk sample,* whi ch has been derived from multiple units of
the treated product, whereas the MRLs for meat and poultry refers to the maximum
residue concentration in the tissues of individual treated animals or birds. Each
identifiable lot
y
to be checked for compliance must be sampled separately. The
minimum number of primary samples to be taken depends on the size of the lot.
Each primary sample should be taken from a randomly chosen position as far as
practicable. The primary samples must consi st of sufficient materials to provide the
laboratory sample(s) required. The primary samples should be combined and mixed
well, if practicable, to form the bulk sample. Where the bulk sample is larger than is
required for a laboratory sample,
z
it should be divided to provide a representative
portion. A sample divider, quartering, or other appropriate size reduction process
may be used but units of fresh plant products or whole eggs should not be cut or
broken. Where units may be damaged (and thus residues may be affected) by the
processes of mixing or subdivision of the bulk sample, or where large units cannot be
mixed to produce a more uniform residue distribution, replicate laboratory samples
should be withdrawn or the units should be allocated randomly to replicate labora-
tory samples at the time of taking the primary samples. In this case, the result to be
used should be the mean of valid results obtained from the laboratory samples
analyzed.
Further details for the minimum mass and the number of primary samples to be
taken depending on the size of the sampled lot or the targeted (acceptable) violation
rate are given in the guidelines.
Samples taken for residue analysis in supervised trials are usually larger than
specified in the Codex GLs, as the mai n objective is to obtain the best estimate for
the average residues. Sample may be taken from the experimental site randomly, or
following some stratified random sampling design. It was shown that, where samples
should be taken at different time intervals after the application of the pesticide for
establishing decline curves, the least variation can be obtained if the primary
sampling positions are selected randomly and marked before the first sampling,
and the primary samples are collected from the close vicinity of the marked positions
at the various sampling times.
23
* For products other than meat and poultry, the combined and well-mixed aggregate of the primary
samples taken from a lot. For meat and poultry, the primary sample is considered to be equivalent to the
bulk sample.
y
A quantity of a food material delivered at one time and known, or presumed, by the sampling officer to
have uniform characteristics such as origin, producer, variety, packer, type of packing, markings,
consignor, and so on.
z
The sample sent to, or received by, the laboratory. A representative quantity of material removed from
the bulk sample.
ß 2007 by Taylor & Francis Group, LLC.
5.2.3 ESTIMATION OF UNCERTAINTY OF SAMPLING
As it was shown, the average residues and CV of residues in individual crop units in
samples of size 100–120 (that is each sample consists of 100–120 individual crop
units, e.g., oranges) taken repeatedly from the same parent population (e.g., from a
field or a lot) may vary signi ficantly. The best estimate of the uncertainty of sampling
is provided by the average of CV values.
24
The sampling uncertainty depends on the size of composite samples and the
distribution of residues in the sampled commodity. Based on 174 residue data sets
consisted of 22,665 valid residue data derived from specifically designed super-
vised trials
25
and sampling lots from the market,
26
the estimated typical sampling
uncertainty for different kinds of plant commodities and sample sizes specified by
the Codex Standard for sampling
22
are summarized in Table 5.2.
There were nodata for estimation of the uncertainty of sampling cereal grains, eggs,
and processed products. The variation of residues in composite samples taken from
different fields is much larger. The typical CV values of between fields variation of
residues in composite samples ranged between 80% and 120%. The data evaluation
revealed that the coefficients of variation of residues within field and between fields are
practically independent of the pesticide, the preharvest interval, and dosage rate.
27
TABLE 5.2
Typical Sampling Uncertainty for Various Fresh Plant Com modities
with Lower (LC) and Upper (UC) Confidence Intervals
Commodity
Groups
No. of
Sample
Sets
a
SD of
CV
S
Values
Sample
Size
Confidence Limits of CV
Styp
LC
0.99
LC
0.95
CV
Styp
UC
0.95
UC
0.99
Small
commodities
(unit mass
25 g)
18 0.31 1 0.57 0.62 0.78 0.93 0.99
0.10 10
b
0.18 0.20 0.25 0.29 0.31
Medium-size
commodities
(unit mass
25–250 g)
76 0.25 1 0.73 0.75 0.81 0.86 0.88
0.08 10
b
0.23 0.24 0.25 0.27 0.28
Large
commodities
(unit mass
>250 g)
64 0.27 1 0.58 0.60 0.67 0.73 0.76
0.12 5
b
0.26 0.27 0.30 0.33 0.34
0.09 10 0.18 0.19 0.21 0.23 0.24
Brassica leafy
vegetables
17 0.16 1 0.33 0.37 0.45 0.53 0.56
0.07 5
b
0.15 0.16 0.20 0.24 0.25
0.05 10 0.11 0.12 0.14 0.17 0.18
a
Primary samples making up the sample sets were taken from different fi elds=lots.
b
Minimum number of primary samples to be taken for a composite sample for testing compliance with
Codex MRLs.
25
ß 2007 by Taylor & Francis Group, LLC.
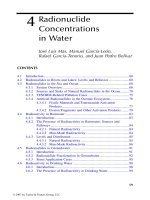
The ISO Standard 11648-1 for sampling bulk materials
28
recommends to apply
fully nested or staggered nested experimental design to obtain information on the
uncertainty of withdrawing the bulk samples from different lots, reducing the sample
size with subsampling (sample preparatio n) and analysis. The procedures are illus-
trated in Figure 5.1. The standard recommends that for obtaining sufficient informa-
tion about the variability of the analyte, ~20 lots should be sampled, preferably
several pairs of samples taken from each lot.
Sampling of the same residue data population by withdrawing random composite
samples with repla cement
24
or applying the fully nested experimental design gave
very similar results for the average residue and the average CV of the residues. For
instance, even if 30 pairs of random composite samples of size 10 were withdrawn
100 times from a data population having a CV of 0.28, the minimum and maximum
CV values observed were 0.205 and 0.365, respective ly, which is in agreement with
the confidence limits shown in Table 5.2.
Concerning the sampling uncertainty, one should always remember that the
MRLs refer to the residues in the bulk sample. Hence, for testing compliance with
an MRL any amount of material satisfying the minimum sample size is sufficient and
the sampling uncertainty need not be taken into accoun t. On the other hand, where
the compliance of a lot before shipment has to be verified, then the sampling
uncertainty must be included in the combined expanded uncertainty of the measured
residue value.
5.3 SAMPLE PREPARATION AND PROCESSING
For food commodities, the Codex MRLs refer to the specified portion of the
commodity which is analyzed.
14
The preparation of the analytical sample* may
require removal of foreign materials and certain parts of the sampled material
(such as shell of nuts, stone of mango or peach, adhering soil, outer withered loose
leaves in case of plant materials, and peddles and remains of plants from soil, etc.).
These procedures may significantly affect the residue level. As they cannot be
Fully nested experiment Staggered nested experiment
1
2
3
4
FIGURE 5.1 Experimental designs for estimation of the uncertainty of sampling steps.
1: Lots; 2: sampling of lots; 3: subsampling; and 4: measurements.
* The material prepared for analysis from the laboratory sample, by separation of the portion of the product
to be analyzed.
ß 2007 by Taylor & Francis Group, LLC.
validated and their contribution to the uncertainty of the results cannot be estimated,
the sample preparation procedure should be clearly written and consistently followed
without any deviation to obtain comparable results.
The residues in individual crop units are not uniformly distributed. Therefore the
whole laboratory sample must be prepared and the entire analytical sample should be
chopped, ground, or mixed to obtain a well-mixed material from which the repre-
sentative test portions can be withdrawn for extraction. The large crops making up
the laboratory sample (e.g., five watermelons) may not be processed together due to
the limited capacity of the equipment. In these cases, representative portions should
be cut from the individua l units in such a way that the ratio of the surface and inner
part remains the same.
The efficiency of the comminuting procedure depends on the equipment, matur-
ity, and variety of the crops, but it is independent of the concentration and nature of
the analyte, and the extraction method. The efficiency of processing is characterized
with CV
Sp
(Equation 5.2). It is more difficult to obtain a well-mixed matrix from
plant materials with hard peal and soft pulp (tomato) than from a soft fruit (orange).
The homogeneity (well-mixed status) of the processed analytical sample cannot be
verified with the usual recovery studies. It should either be tested with samples
treated with pesticides according to the normal practice,
29
or a small part of the
surface of the crops should be treated with suitable test compounds.
30
A third
alternative is to treat a small portion of the sample matrix with the test compound
and then mix it with the rest of the sample.
16
The uncertainty of sample processing can be quantified as part of the method
validation by applying fully nested or staggered neste d
31
experimental design and
evaluating the results with ANOVA. The scheme of the process is very similar to that
shown in Figure 5.1. In this case, uncertaint y infor mation can be obtained only for
the size of the test portion. If the expectable uncertainty should be determined for a
given range of test portion size to optimize the analytical procedure, the concept of
sampling constant
29
can be used. The sampling constant, K
s
,isdefined as
32
K
s
¼ mCV
2
, (5:5)
where m is the mass of a single increment and CV is the relative standard deviation
of the concentration of the analyte in the test portions of size m.
If the analytical sample is well-mixed, the sampling constant should be the same
for small (Sm) and large (Lg) portions, and Equation 5.5 can be written as
m
Sm
S
2
Sm
¼ m
Lg
S
2
Lg
: (5:6)
If the ratio of S
2
Sm
m
Sm
=S
2
Lg
m
Lg
is smaller than the critical F value, the processed
sample can be considered well-mixed, and the expected sample processing uncer-
tainty can be calculated for any test portion size !m
Sm
.
The acceptable variability of sample processing depends on the variability of
the other steps of the determination. When the combined uncertainty of the meas-
urement results should include the sampling uncert ainty, then the CV
Sp
should be
8%–10% depending on the crop analyzed. Where only the CV
L
is taken into
ß 2007 by Taylor & Francis Group, LLC.
acc ount, the CV
Sp
shoul d be less than 0.2 5–0.3 3 CV
A
. Unde r these condition s, the
samp le processing will not signi ficantly contr ibute to the combined uncert ainty of
the meas urement.
The ef fi ciency of samp le proces sing depends on, among others, the type and
varie ty of the samp le a nd the implem entation of the proces s. As it can be a signi ficant
con tributor to the combi ned uncertaint y, it should be tested regul arly as part of
the perfor mance veri fi cation of the labor atory ph ase of the deter minati on of pesticide
resi dues. It can be most econom ically carrie d out wi th the reanal ysis of the replicate
test portions of samp les containing the analyte in a diff erent analytical batch.
The wi thin labor atory reprod ucibili ty of the procedu re (CV
L
) can be calculated
wi th Equati on 5.4. As it was shown in Section 5.2.3, a min imum of 20 meas urement
pairs are needed to obtain a reliable esti mate.
5.4 STABILITY OF RESIDUES
The pesticide resi dues may be subje cted to different ch emical react ions or evapor-
ated after the samp les are taken. The change of concent ration of the residues shoul d
be avoide d as far as possi ble to assur e the repres entat iveness of the samp les and
the results.
5.4.1 S TABILITY DURING STORAGE
The supervised trial samples are usually deep-frozen shortly after the sampling and
shipped deep-frozen to the laboratory within the shortest possible time, where they are
kept deep-frozen until analysis. During this storage period, the concentration of residues
of the pesticides and their metabolites may decline due to processes such as volati-
lization or reaction with enzymes. Storage stability tests are carried out with represen-
tative commodities to demonstrate the stability of residues during frozen storage before
analysis. The storage stability studies are part of the data package submitted to support
registration of a compound. The FAO=WHO Pe st ic id e R es id ue s—Evaluations
18
also
include information on the stability of residues during storage.
Where it is fores een that the samp les have to be stored in the laboratory over
1 month, and appropriate information on the stability of residues is not available
on representative sample matrices under similar conditions as the samples will
be stored, storage stability test should be carried out. The basic principles
20,33
to be considered for planning storage stability studies are briefly summarized later.
Stability data obtained on one commodi ty from a commod ity group (see Se ction
5.5 ) can be extra polated withi n the same group, provi ded that the stor age condition s
are comparable. The study can be performed with sample containing field-
incurred residues, if the suitable homogeneity of the material had been verified
before (CV
Sp
< 0.25–0.3 3 CV
A
). Alternately, the test portions withdrawn from
the homogenized untreated sample matrix should be spiked individually. Untreated
test material should be prepared and stored under the same conditions. The treated
and blank test material should be sufficient for a minimum of 8 3 4 treated as well
as untreated test portions for analyses with some extra material as reserve. The total
number of test portions should be larger, if the extension of the study period may be
ß 2007 by Taylor & Francis Group, LLC.
necessary. The active substance and its metabolites or degradation products included
in the residue definition should be tested separately if spiked test portions are used.
The initial residue concentration should be sufficiently high to enable the accurate
determination of the residues if their concentration decreases during storage. Nor-
mally, analyses at five time points are sufficient. The first test should be performed at
day 0 to verify the initial concentration, and the others selected according to
approximate geometrical progression (e.g., 0, 1, 3, 6, and 12 months or 0, 2, 4, 8,
and 16 weeks if decline of residues are suspected). At each time, two treated test
portions and at least one freshly spiked untreated sample shoul d be analyzed.
The results should be reported in the form of individual residue concentration
(milligram=kilogram) measured in the treated stored samples (survived residues),
the concurrent recoveries expressed in percentage of the spiked amount, and the
standard uncertainty of the measurement determined independently as part of the
validation of the analytical method. The individual recoveries obtained should
preferably be within the warning limits of the established method. If that is not the
case, the analysis of residues in additional test portions of the stored samples should
be repeated together with additional recovery studies.
Where the storage stability study carried out with samples belonging to the
representative commodity groups indicates that the residue is stable, then it can be
assumed that the residues would be stable in other matrices stored under similar
conditions.
5.4.2 STABILITY OF RESIDUES DURING SAMPLE PROCESSING
The laboratory s ample processing re ceived u nproportionally little attention i n the past,
though its contribution to the uncertainty and the bias of the results can be quite large. In
general, supervised trial samples are transported, stored, and processed under deep-
frozen conditions, whereas monitoring laboratories usually receive and process the
samples at ambient temperature. The analysts were aware of the rapid decomposition
of dithiocarbamates or daminozide if they were in contact with the macerated samples
and eliminated the homogenization step from the method, but did not test the stability of
other residues or associate the loss of residues with their potential decomposition, until
some publications indicated the substantial decomposition (50%–90%) of certain com-
pounds (chlorothalonil, phthalimides, thiabendazole, dichlofluanid).
15,34
Further studies
revealed that processing in the presence of dry ice (cryogenic milling) at or below
À208C reduced or practically eliminated the loss of all pesticides which decomposed at
ambient temperature.
35
Furthermore, cryogenic processing may provide more homoge-
neous sample matrix and reduce the uncertainty of sample processing. Notable that the
decomposition of pesticides in test portions spiked after the homogenization of the
sample is much smaller and does not affect the recovery of most of the compounds
substantially. It may probably be attributed to the inactivation of the enzymes by the
extracting solvent and the different concentration of the chemicals in the diluted extract.
The decomposition of the residues depends on the composition of the sample
material and the homogenization process. When intensive and extended comminu-
tion in high-speed blender is carried out to reduce the sample processing uncertainty,
a significant bias can be introduced due to the decomposition of the residues.
ß 2007 by Taylor & Francis Group, LLC.
Bec ause the rate of decom position may depend on the labor atory equipment , the
varie ty and maturity of the proces sed crop, a nd many other facto rs, curren tly there is
no suffi cient know ledge to extrapolat e findings from one laboratory to anothe r.
Con sequent ly the laboratori es, analyz ing wide range of pesticide s in large numbe r
of various comm odities, shoul d apply cryogen ic proces sing as stand ard procedu re to
reduce the chance of produci ng biase d resul ts. Furthermor e, the labor atories shoul d
verif y the suitabil ity of thei r procedu res as part of the method validati on with testing
the stabili ty of those compo unds, which are known to rapid ly decom pose under
un favorable condition s.
The cryogen ic proces sing applied succes sfully in some laboratori es
35
includes:
prepar atio n of the portion of samp le to which the MR L applie s (anal ytical samp le) on
recei ving the fresh sample in the labor atory; placing the analytical samp le into the
dee p-freezer withi n the shortest possible time; choppi ng, grinding the sample in
the presenc e of suf ficient amoun t of dry ice (about 1:1 sample=dry ice ratio) to keep
the tem perature below À 20 8C (this proces s requi res robust chopper s with stainles s
steel bowl and lid); wi thdrawi ng the test portions needed for various extra ctions and
con firmation of resi dues into app ropriate un sealed containers and placing them in
dee p-freezer for a min imum of 16 h to allow the carbon dioxi de to evapora te;
wei ghing the mass of the test portion, adding ex traction solve nt and warmi ng the
test porti on u p to room tem perature before proceed ing with the extra ction.
The stabi lity of residues ca n be tested with a mixture of pestic ides, whi ch
con tains a refere nce compo und (R) know n to be stabl e (e.g., chlorpyrif os), at least
on e compo und decom posing rapid ly (chlo rothaloni l, dichlo fl uanid, captan ) a nd the
other compo unds to b e tested. The test mixture shoul d be ca refully applie d on the
surfa ce of the plant mat erial avoidi ng runoff . The treated samp le shoul d be kept in
fume cupboar d until the solve nt completel y evapora tes. The proces sing under
ambi ent temperat ure can now be started, while the treate d samp le should be placed
in deep-f reezer before cryogen ic milli ng for a minim um of 16 h.
A minim um of three test portions shoul d be withdr awn from the comminu ted
mat erial, an d the extract shoul d be analyz ed in duplicate. The numbe r of test portions
and the repli cate analys es depend on the CV
A
of the analytical met hod and the
percent age decom position , whi ch shoul d be qua nti fied with a selec ted probabi lity.
The result of the analysis is evaluated by comparing the measured residues to the
expected ones.
The significance of the difference between the expected and survived residues
(A
11
–A
0
11
,A
12
–A
0
12
, etc.) can be calculated with the one-tail Student’s t-test for
differences.
t
calc
¼
D
S
d
=
ffiffiffi
n
p
where S
d
¼
ffiffiffiffiffiffiffiffiffiffiffiffiffiffiffiffiffiffiffiffiffiffiffiffi
P
(d
i
À D)
2
n À 1
s
, (5:7)
where D is the average of the differences and n is the number of measurement pairs.
Before the start of the study, one can also calculate with Equation 5.6 the
min imum diff erence between the expect ed and survi ved resi dues (Table 5.3),
which can be considered statistically significant, and decide on the number of test
portions and replicate analysis to be performed in the study depending on the
ß 2007 by Taylor & Francis Group, LLC.
percentage of the decomposition which should be quantified. The acceptable
decrease of residues during sample processing has not been officially specified. As
a guidance value 5%–10% may be used, as it is considered acceptable difference
between two standard solutions.
3
5.5 METHOD VALIDATION
The concepts of method validation have been developed simultaneously by AOAC
International, EURACHEM, IUPAC Working Party, and several national organiza-
tions. The general criteria set by the different guidelines are similar and provide the
basis for assuring reliability of the methods validated for one or a few analyte–samp le
matrix combinations. However, these general guidelines are not directly applicable to
the methods used in pesticide residue analysis as they cannot address the specific
requirements and limitations. To provide guidance on in-house method validation to
analysts, national authorities, and accreditation bodies, a Guideline for Single-labora-
tory Method Validation was developed and discussed at an International Workshop.
36
The Guidelines were included in the GLP GLs ofCCPR.
4
The Guidelines also provide
specific information for extension of the method to a new analyte and=or new sample
matrix, and adaptation of a fully validated met hod in another laboratory.
According to the Guidelines the method validation is not a one-time, but
continuous operation including the performance verification during the use of the
method. Information essential for the characterization of a method may be gathered
during the development or adaptation of an analytical procedure; establishment of
acceptable perfor mance; regular perfor mance verification of methods applied in the
laboratory, demonstration of acceptable performance in second or third laboratory
TABLE 5.3
Examples for the Quantifiable Differences between the Expected
and Survived Residues
Residue
a
n
b
CV
A
c
CV
qR
d
CV
d
e
SD
f
x
d
g
Rel. dif. %
h
0.5 6 0.1 0.1 0.141 0.071 0.058 11.6
0.5 10 0.1 0.1 0.141 0.071 0.041 8.2
0.5 15 0.1 0.1 0.141 0.071 0.032 6.4
0.5 6 0.15 0.1 0.180 0.090 0.074 14.8
0.5 10 0.15 0.15 0.212 0.106 0.061 12.3
0.5 6 0.08 0.08 0.113 0.057 0.047 9.3
a
Expected residue concentration.
b
Number of valid residue values determined in analytical portions.
c
Repeatability of the recovery of the analyte (A, B, C, . . . , X).
d
Repeatability of the recovery of reference compound.
e
Relative uncertainty of the calculated difference.
f
Standard deviation of the difference.
g
Quantifiable significant difference between the expected and survived residues is >x
d
.
h
Quantifiable relative difference.
ß 2007 by Taylor & Francis Group, LLC.
(AOA C Pe er-Veri fied Meth od), and participa tion in profi ciency test or inte rlabora-
tory collaborat ive study .
Before va lidation of a met hod co mmences, the meth od must be optimi zed,
stand ard op eration procedu re (SOP) describing the method in suf ficient detail shoul d
be prepared, a nd the staf f performi ng the validatio n should be expe rienced with the
met hod. Pa rameters to be studied are: stability of residues d uring sample stor age,
samp le proces sing, and in analytical stand ards; ef ficiency of extra ction ; homoge neity
of analyt e in proces sed samples; selectivity of separa tion; speci ficity of ana lyte
detect ion; c alibration funct ion; matrix effect; analytical range, limit of detection,
lim it of quanti tation (LOQ), and ruggedn ess of the method.
The vali dation shoul d be performed in case of indi vidual met hods with the
speci fied analyte(s) and samp le materials, or using samp le matrices repres entative of
those to be tested by the labor atory ; group speci fic methods with representat ive
comm odity(ies )* (T able 5.4) and a min imum of two repres entative analytes
y
selected
from the group; MR Ms with representat ive comm odities and a minimu m of 10 rep-
resent ative analytes. For metho d validati on purpos es, comm odities shoul d be differ-
enti ated suffi ciently but not unneces sarily. The co ncentrati on of the analyt es used to
cha racterize a met hod should be selected to cover the analytical ranges of all analytes.
Fu ll met hod validati on shall be perfor med in all mat rices and for all compo unds
speci fied, if required by relev ant legislation.
The met hod is consi dered appli cable for an an alyte if its perfor mance satis fies
the basic requireme nts summ arized in Tab le 5.5. The repeatabil ity and reprod ucibil-
ity criteria given in the table are based on the Horwitz equation: RSD ¼2C
(À0.1505)
.
In the equation, the concentration C is expressed in dimensionless mass ratios (e.g.,
1mg=kg 10
À6
). Recent studies indicated that the Horwitz equation would probably
overestimate the variability of the results at low concentrations (<0.1 mg=kg).
37
Therefore, the tabulated data should be considered as the upper limit of the accept-
able reproducibility.
5.5.1 INTERNAL QUALITY CONTROL
Based on the validation and optimization data generated, a QC scheme should be
designed.
The performance of the method shall be regularly verified during its use as part
of the internal quality control program of the laboratory.
The internal quality control=performance verification is carried out to: monitor
the performance of the method under the actual conditions prevailing during its use,
and take into account the effect of inevitable variations caused by, for instance, the
composition of samples, performance of instruments, quality of chemicals, varying
performance of analysts, and laboratory environmental conditions; demonstrate that
* Single food or feed used to represent a commodity group for method validation purposes. A commodity
may be considered representative on the basis of proximate sample composition, such as water, fat=oil,
acid, sugar and chlorophyll contents, or biological similarities of tissues, and so on.
y
Analyte chosen to represent a group of analytes which are likely to be similar in their behavior through a
multiresidue analytical method, as judged by their physicochemical properties, for example, structure,
water solubility, K
ow
, polarity, volatility, hydrolytic stability, pK
a
, and so on.
ß 2007 by Taylor & Francis Group, LLC.
the performance characteristics of the method are similar to those obtained during
method validation, the application of the method is under ‘‘statistical control,’’ and
the accuracy and uncertainty of the results are comparable to the performance
characteristics estab lished during method validation.
The results of internal quality control provide essential information for the con-
firmation and refinement of performance characteristics established during the initial
validation, and extension of the scope of the method. Some key components of the QC
scheme are summarized late r.
The correct preparation of analytical standards should be verified by comparing
its analyte content to the old standard, or preparing the new standard in duplicate at
TABLE 5.4
Representative Commodities for Multiresidue Methods
a
and Storage Stability Tests
Group Common Properties Commodity Group Representative Species
Plant products
I High water and chlorophyll
content
Leafy vegetables
Brassica leafy vegetables
Legume vegetables
Fodder crops
Spinach or lettuce
Broccoli, cabbage, kale
Green beans, green peas
II High water and low or no
chlorophyll content
Pome fruits Apple, pear, peach, cherry
Stone fruits Strawberry
Berries, small fruits
Fruiting vegetables
Grape
Tomato, bell pepper, melon
Root vegetables Potato, carrot, parsley
Fungi Mushroom
III High acid content Citrus fruits
Berries, pineapple
Orange, lemon
Blueberry, current
IV High sugar content Raisins, dates
V High oil or fat Oil seeds
Nuts
Avocado, sunflower seed
Walnut, nuts, pistachios,
peanut
VI Dry materials Cereals Wheat, rice, or maize grains
Cereal products Wheat bran, wheat flour
Commodities requiring
individual test
e.g., Garlic, hops, tea,
spices, cranberry
Commodities of animal origin
Mammalian meat (muscle) Any of the major species
Poultry meat, edible offals, fat
Eggs
Milk
a
For storage stability tests groups I and II may be combined, and crops of high protein or starch content
should be considered separately.
ß 2007 by Taylor & Francis Group, LLC.
the first time. A balanc e with 0.01 mg sensitiv ity shoul d not be used to wei gh
< 10 mg stand ard mat erial. The dilutions of stand ard solut ions shoul d be made
indepe ndentl y based on weight measu rement except the last step for whi ch an
A-g rade volumetr ic flask shoul d be used.
12
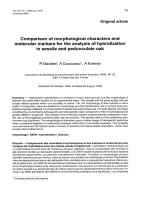
Weighted regres sion (WLR) shoul d be applied for evalua tion of the line ar cali-
brati on function for GLC and HPLC meas uremen ts especi ally at the lowe r thir d of the
cali brated concentrati on range. The con fidence limit s a t the mid dle and upper cali-
brate d range are about the same with the weighte d and ordin ary (OLR) regression
calcul ation (Figur e 5.2).
The goodnes s of the calibratio n shoul d be characteri zed with the stand ard
dev iation of the relative resi duals ( S
rr
), as it is much more sensi tive indicator than
the regression coef ficient (see Figure 5.2 and Table 5. 6). The relative resi duals ’
(residuals=predicted response Dy
i
¼y
i
À
^
y;
Y
rel,i
¼Dy
i
=
^
y) standard deviation (S
rr
)is
calculated as
S
rr
¼
ffiffiffiffiffiffiffiffiffiffiffiffiffiffiffiffiffiffiffiffiffiffiffiffiffiffiffiffiffiffiffiffi
P
Y
rel,i
À
Y
rel
ðÞ
2
n À 2
s
, (5:8)
where y
i
is the response of standard x
i
and
^
y is the corresponding response on the
regression line. Where the calibration points are spread over the analytical sequence,
an S
rr
of 0.1 and 0.6 may be considered acceptable for GC and HPLC methods,
respectively.
TABLE 5.5
Acceptable within Laboratory Performance Characteristics of a Method
a
Concentration
Repeatability Reproducibility Trueness
b
mg=kg CV
A
%
c
CV
L
%
d
CV
A
%
c
CV
L
%
d
Range of Mean Recovery, %
0.001 35 36 53 54 50 –120
>0.001 to 0.01 30 32 45 46 60–120
>0.01 to 0.1 20 22 32 34 70–120
>0.1 to 1 15182325 70–110
>1 10141619 70–110
a
With multiresidue methods, there may be certain analytes where these quantitative performance criteria
cannot be strictly met. The acceptability of data produced under these conditions will depend on the
purpose of the analyses, for example, when checking for MRL compliance the indicated criteria should
be fulfilled as far as technically possible, while any data well below the MRL may be acceptable with
the higher uncertainty.
b
These recovery ranges are appropriate for multiresidue methods, but strict criteria may be necessary for
some purposes, for example, methods for single analyte.
c
CV
A
: Coefficient of variation of analysis excluding sample processing.
d
CV
L
: Overall coefficient of variation of a laboratory result, allowing up to 10% variability of sample
processing.
ß 2007 by Taylor & Francis Group, LLC.
For the most effective internal quality control, analyze samples concurrently
with quality control check samples. For checking acceptability of individual recov-
ery results, the initial control charts is constructed with the average recovery (Q) of
representative analytes in representative matrices and the typical within laboratory
reproducibility coefficient of variation (CV
typ
) of analysis. The warning and action
limits are Q Æ2 3 CV
Atyp
3 Q and Q Æ3 3 CV
Atyp
3 Q, respectively. At the time of
the use of the method, the recoveries obtained for individual analyte=sample matrices
are plotted in the chart.
Based on the results of internal quality control tests, refine the control charts at
regular intervals if necessary. If the analyte content measured in the quality control
check samples is outside the action limits, the analytical batch (or at least the analysis
of critical samples in which residues found are !0.7 MRL and 0.5 MRL for regularly
and occasionally detected analytes, respectively) may have to be repeated. When the
WLR
y = 48,383x Ϫ 50,583
R
2
= 1 R
2
= 1
0
100,000
200,000
300,000
400,000
500,000
0 5 10 15 0 5 10 15
Injected amount [p
g
]
Response
Y
i
CLl
CLU
Alphametrin
Linear (Y
i
)
OLR
y = 52,203x Ϫ 67,737
0
100,000
200,000
300,000
400,000
500,000
Injected amount [pg]
Response
Y
i
CLl
CLU
Alphametrin
Linear (Y
i
)
S
rr
= 0.06 S
rr
= 0.1
FIGURE 5.2 Evaluation of calibration with weighted (WLR) and ordinary (OLR) linear
regression.
TABLE 5.6
Comparison of the Standard
Deviation of the Relative
Residuals and the Regression
Coefficient
S
rr
R
2
0.042 0.9937
0.061 0.9976
0.062 0.9882
0.085 0.9988
ß 2007 by Taylor & Francis Group, LLC.
results of quality control check samples fall repeatedly outside the warning limits
(1 in 20 measurements outside the limit is acceptable), the application conditions of
the method have to be checked, the sources of error(s) have to be identified, and the
necessary corrective actions have to be taken before the use of the method is
continued.
The differences of the replicate measurements of test portions of positive sam-
ples can be used to calcul ate the overall within laboratory reproducibility of the
method (CV
Ltyp
calculated with Equation 5.4). The CV
Ltyp
will also include
the uncertainty of sample processing, but will not indicate if the analyte is lost
during the process.
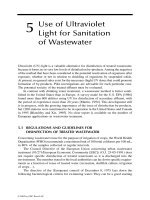
The long-term reproducibility of the MRM can be demonstrated by plotting on
the control chart all recovery values of compounds, that can be characterized with the
same typical average recovery and CV
A
, obtained during the use of the method.
Figure 5.3 shows the quality control chart including 394 recoveries of 35 GC
amenable residues in 21 commodities at spiking levels of 0.01–1mg=kg over 1
year (F. Zakar, personal communication, 2000).
The applicability of the method for the additional analytes and commodities shall
be verified as part of the internal quality control program. All reported data for a
specific pesticide matrix combination should be supported with either validation or
performance verification performed on that particular combination.
5.6 INTERLABORATORY STUDIES
Regular participation in interlaboratory studies and proficiency tests is an important part
of the quality assurance programs and a basic requirement for accreditation, as it
provides the opportunity for the laboratories to prove the suitability of their methods
0
20
40
60
80
100
120
140
160
Pesticides
Recovery %
0 5 10 15 20 25 30 35 40
FIGURE 5.3 Illustration of long-term reproducibility of a MRM with different pesticide
sample combinations.
ß 2007 by Taylor & Francis Group, LLC.
and proficiency of the staff in their application. Good results obtained in these studies are
only showing the capability of the laboratory, but they do not verify similar performance
during the daily work, which must be shown with the results of internal quality control.
The harmonized criteria for testing the proficiency of laboratories had been jointly
elaborated by ISO, AOAC, and IUPAC.
38,39
The current proficiency test programs
40,41
organized by several organizations are based on the revised version of the harmonized
criteria.
42
Before the samp les issue d the participa nts are norm ally infor med about the
list of pesticide s that may be present in the samp le. The careful ly homog enized and
tested material
43
may contain field-incurr ed resi dues or spike d with mixtures of
analytes, which are known to be stable durin g the expect ed d uration of the study.
The reported results are fi rst screen ed for obviou s errone ous data, then statistical ly
evalua ted for analytical outliers with Cochran test and robust stat istics.
44
The assigned
value for the mean (
^
x ) is established by calculati on of the robust mean, the median,
or the mode depe nding on the dist ribution of the resul ts after remo val of spurious
and outl ier values. The target stand ard deviat ion, s, should refl ect the best pract ice
or ‘‘fi t for purpos e ’’ for the given analyte, which may be derived from the resul ts
of collaborat ive studi es
40
or predi cted based on Horwitz equation or those sugges ted
by Thomps on.
37
The z -scor e is calcul ated from the assi gned and reported value
z ¼ ( x
i
–
^
x )=s. The interpret ation of the z -score is based on the normal statist ics.
Laborato ries performi ng as expected shoul d produce resul ts withi n the 2 3 z in most
of the cases, but 1 result out of 20 may be between 2–3 3 z. Result s above 3 3 z should
occur very rarely (the probabili ty is 0.3%) and ‘‘requi res action. ’’ In order to evalua te
each labor atory ’s ov erall perfor mance , and taki ng into account all pesticide s analyz ed,
the EU pro ficiency test progra m
41
used three methods to combi ne the z -scor es: RSZ ¼
( S j z
i
j)=n; SSZ ¼ Sz
2
, and the ‘‘ weighte d sum of z -scores ¼ ( S j z
i
j v
zi
)=n (the v
zi
is
assigned as v
zi
¼ 1if z 2; v
zi
¼ 3if2< z 3; and v
zi
¼ 5if z > 3).
Pro ficiency scheme providers, participa nts, and end users should avoid class ifi-
cation and rankin g of labora tories on the basis of thei r z -scor es.
REFERENCES
1. International Standard Organization, ISO=IEC 17025:2005 General requirements for the
competence of testing and calibration laboratories, 2005.
2. OECD Series on Principles of good laboratory practice and compliance monitoring
No. 1-11, OECD Environmental Directorate, Paris, 1998, http:==www.oecd.org=document=
63=0 , 2 3 40 ,e n _ 2 64 9 _3 43 65 _2 34 61 75 _1 _1 _1 _1 ,0 0 . h t ml
3. European Commission, Quality control procedures for pesticide residues analysis, Docu-
ment No. SANCO=10232=2006, 2006.
4. Codex Committee on Pesticide Residues (CCPR), Guidelines on good laboratory practice
in residue analysis, CAC=GL 40-1993, Rev. 1-2003, 2003. www.codexalimentarius
.net=download=report=655=al29_24e.pdf
5. EURACHEM=CITAC, Quality assurance for research and development and non-routine
analysis, 1998.
6. EURACHEM=CITAC, Selection, use and interpretation of proficiency testing (PT)
schemes by laboratories—2000, 2000.
ß 2007 by Taylor & Francis Group, LLC.
7. EURACHEM=CITAC, Traceability in Chemical Measurement . A guide to achieving
comparable results in chemical measurement, 2003.
8. King, B., Quality in the analytical laboratory, in 6th International Symposium on Quality
Assurance and TQM for Analytical Laboratories, ed. Parkany, M., Royal Society of
Chemistry, Cambridge, UK, 1995, pp. 8–18.
9. Miller, J.N. and Miller, J.C., Statistics and Chemometrics for Analytical Chemistry ,
4th edn, Pearson Education Limited, Harrow, UK, 2000, chap. 1.
10. EURACHEM, EURACHEM=CITAC Guide Quantifying Uncertainty in Analytical Meas-
urements, 2nd edn, 2000, http:==www.measurementuncertainty.org
11. International Standard Organisation, Guide to the Expression of Uncertainty of Measure-
ment, 1995.
12. Ambrus, A., Reliability of measurement of pesticide residues in food, Accred. Qual.
Assur., 9, 288, 2004.
13. Codex Committee on Pesticide Residues (CCPR), Proposed draft guidelines on estima-
tion of uncertainty of results, in Report of the 38th Session of the Codex Committee on
Pesticide Residues, 2006, http:==www.codexalimentarius.net=web=archives.jsp?year ¼ 06
14. Food and Agriculture Organisation, Portion of commodities to which codex maximum
residue limits apply and which is analyzed, in Joint FAO=WHO Food Standards Pro-
gramme Codex Alimentarius V. 2, Pesticide Residues in Food , 2nd edn, FAO, Rome,
1993, p. 391.
15. El-Bidaoui, M., et al., Testing the effect of sample processing and storage on stability of
residues, in Principles and Practices of Method Validation , eds. Fajgelj, A. and Ambrus,
A., Royal Society of Chemistry, Cambridge, UK, 2000, pp. 75.
16. Suszter, G., et al., Estimation of effi ciency of processing soil samples, J. Environ. Sci.
Health Part B , 41, 1, 2006.
17. Meier, P.C. and Zünd, R.E., Statistical Methods in Analytical Chemistry , John Wiley &
Sons, New York, 1993, chap. 2.
18. FA=WHO Pesticide Residues —Evaluations, http:==www.fao.org=AG=AGP=AGPP=
Pesticid=
19. Thompson, M., et al., Harmonised guidelines for the use of recovery information in
analytical measurement, Pure Appl. Chem ., 71, 337, 1999.
20. Food and Agriculture Organisation, FAO, Manual on submission and evaluation of
pesticide residue data for the estimation of maximum residue levels in food and feed,
FAO Plant Production and Protection Paper 170, 2002.
21. Kateman, G. and Buydens, L., Quality Control in Analytical Chemistry , 2nd edn, John
Wiley & Sons, New York, 1993, chap. 2.
22. Codex Secretariat, Recommended method of sampling for the determination of pesticide
residues for compliance with MRLs, CAC GL 33-1999. www.codexalimentarius.
net=download=standards
=361=CXG_033e.pdf
23. Ambrus, A. and Lantos, J., Evaluation of the studies on decline of pesticide residues,
J. Agric. Food Chem., 50, 4846, 2002.
24. Ambrus, A. and Soboleva, E., Contribution of sampling to the variability of pesticide
residue data, JAOAC Int., 87, 1368, 2004.
25. Ambrus, Á., Variability of pesticide residues in crop units, Pest Manag. Sci., 62,
693–714, 2006.
26. Hill, A.R.C. and Reynolds, S.L., Unit-to-unit variability of pesticides residues in fruit and
vegetables, Food Addit. Contam., 19, 733, 2002.
27. Ambrus, A., Within and between field variability of residue data and sampling implica-
tions, Food Addit. Contam., 17(7), 519, 2000.
ß 2007 by Taylor & Francis Group, LLC.
28. International Standard Organization, ISO 11648-1 Statistical aspects of sampling from
bulk materials —Part 1: General principles, 2003.
29. Ambrus, Á., Solymosné, M.E., and Korsós, I., Estimation of uncertainty of sample
preparation for the analysis of pesticide residues, J. Environ. Sci. Health Part B, 31,
443, 1996.
30. Maestroni, B., et al., Testing the efficiency and uncertainty of sample processing using
14
C labelled chlorpyrifos —Part I, in Principles of Method Validation , eds. Fajgelj, A. and
Ambrus, A., Royal Society of Chemistry, Cambridge, UK, 2000, p. 49.
31. Lyn, J.A., et al., Measurement uncertainty from physical sample preparation: estimation
including systematic error, Analyst, 1391, 2003.
32. Wallace, D. and Kratochvil, B., Visman equations in the design of sampling plans for
chemical analysis of segregated bulk materials, Anal. Chem., 59, 226, 1987.
33. Food and Agriculture Organization, Guidelines on pesticide residue trials to provide data
for the registration of pesticides and the establishment of maximum residue limits —Part
1—Crops and Crop Products, 1986.
34. Hill, A.R.C., Harris, C.A., and Warburton, A.G., Effects of sample processing on pesticide
residues in fruits and vegetables, in Principles and Practices of Method Validation , eds.
Fajgelj, A. and Ambrus, A., Royal Society of Chemistry, Cambridge, UK, 2000, p. 41.
35. Fussell, R.J., et al., Assessment of the stability of pesticides during cryogenic sample
processing. 1. Apples, J. Agric. Food Chem., 441, 2002.
36. Fajgelj, A. and Ambrus, A., eds., Principles and Practices of Method Validation , Royal
Society of Chemistry, Cambridge, UK, 2000.
37. Thompson, M., Recent trends in inter-laboratory precision at ppb and sub-ppb concen-
trations in relations to fitness for purpose criteria in proficiency testing, Analyst, 385,
2000.
38. Thompson, M. and Wood, R., The international harmonized protocol for the pro ficiency
testing of (chemical) analytical laboratories, JAOAC Int ., 926, 1993.
39. Thompson, M. and Wood, R., Harmonised guidelines for internal quality control in
analytical chemistry laboratories, Pure Appl. Chem., 649, 1995.
40. FAPAS, Protocol for the organisation and analysis of data, 2002, http:==www.fapas
.com=pdfpub=FAPASProtocol.pdf
41. Fernandez-Alba, A.R., CRL Proficiency Test 8, Pesticide residues in augberine homo-
genate, Final Report, 2006.
42. Thompson, M., Ellison, S.L.R., and Wood, R., International harmonised protocol for the
proficiency testing of analytical laboratories, IUPAC Technical Report, Pure Appl.
Chem., 145, 2006.
43. Fearn, T. and Thompson, M., A new test for ‘ sufficient homogeneity ’, Analyst , 1414,
2001.
44. Analytical Methods Committee, Robust statistics: a method of coping with outliers,
Technical Brief No. 6, 2001, http:==www.rsc.org=pdf=amc=brief6.pdf
ß 2007 by Taylor & Francis Group, LLC.