Analysis of Pesticides in Food and Environmental Samples - Chapter 11 pot
Bạn đang xem bản rút gọn của tài liệu. Xem và tải ngay bản đầy đủ của tài liệu tại đây (301.57 KB, 32 trang )
11
Levels of Pesticides
in Food and Food
Safety Aspects
Kit Granby, Annette Petersen,
Susan S. Herrmann, and
Mette Erecius Poulsen
CONTENTS
11.1 Introduction 287
11.2 Monitoring Programs; Residue Levels in Food 288
11.2.1 Legislation 288
11.2.2 Monitoring Programs; General Aspects 289
11.2.3 Results from Monitoring Programs 290
11.2.3.1 Fruits and Vegetables 291
11.2.3.2 Processed Fruits and Vegetables Including
Processing Studies 293
11.2.3.3 Cereals 296
11.2.3.4 Food of Animal Origin 300
11.2.3.5 Infant and Baby Food 302
11.3 Consumer Exposure and Risk Assessment 306
11.3.1 Dietary Intake Estimation 306
11.3.1.1 Deterministic Approach (Chronic and Acute Intake) 307
11.3.1.2 Probabilistic Approach 308
11.3.1.3 Cumulative Exposure 309
11.3.2 Intake Calculations of Pesticide Residues 309
11.3.2.1 Deterministic Approach 310
11.3.2.2 Total Diet and Duplicate Diet Studies 310
11.3.2.3 Cumulative Exposure 311
References 314
11.1 INTRODUCTION
Monitoring programs for pesticide residues in food are performed in many countries
around the world to ensure that consumers are not exposed to unacceptable levels of
pesticides and that only pesticides approved by the authority are used and for the
ß 2007 by Taylor & Francis Group, LLC.
right applications with respect to crop, application dose, time, and inte rvals. The food
products are permitted as long as they comply with the maximum residue levels
(MRLs) set by the authorities. Another purpos e with the pesticide residue monitoring
in food may be to assess the food safety risk due to the dietary exposure of the
population to pesticides.
The present chapter deals with monitoring programs for pesticide residues in
food in gene ral. It also covers monitoring results in fruits, vegetables, cereals, food of
animal origin, and processed food like drink, infant and baby food. In addition, risk
assessments of consumer exposure based on dietary intake estimates are described
and examples of exposure assessments from studies worldwide are shown.
11.2 MONITORING PROGRAMS; RESIDUE LEVELS IN FOOD
11.2.1 L
EGISLATION
In many countries, there is national legislation regulation on which pesticides are
authorized. Many countries also have national legislation on the maximum amounts
of pesticide residuesin different food commodities. Such upper limits are also referred to
as MRLs or tolerances (in the United States). In countries with no national legislation,
the MRLs set by the Codex system are often used. MRLs are normally set for raw
agricultural commodities (RAC), for example, banana with peel, lettuce, and apples.
The Codex Alimentarius Comm ission (CAC) is an international body that aims
to protect the health of consumers, ensure fair trade practices in the food trade, and
promote coordination of all food standards work undertaken by international govern-
mental and nongovernmental organizati ons. CAC also set MRLs, which are indicative
and not statutory. The Codex MRLs are to be used as guidance on acceptable levels
when there is no other legislation in place; for examp le, in countries without their
own national MRLs or they can be used if national MRLs have not been set for a
particular compound.
MRLs set by Codex are evaluated and negotiated through a stepwise procedure.
Initially, the Joint FAO=WHO Meeting on Pesticide Residues (JMPR)
1
considers
recognized use patterns of good agricultural practice (GAP) and evaluates the fate of
residues, animal and plant metabolism data, and analytical methodology as well as
residue data from supervised trials conducted according to GAP. Based on these
data, MRLs are proposed for individual pesticides. Toxicologists evaluate the toxico-
logical data related to the pesticides and propose acceptable daily intakes (ADI)
and acute referenc e doses (ARfD). The toxicolog ical data originate from animal
studies and include both studies on the short-term and long-term effects. The ADI is
a measure of the amount of specific substance (in this case, a pesticide ) in foods and
drinks that can be consumed over a lifetime without any appreciable health risk.
ADIs are expressed as milligram=kilogram body weight=day. The ARfD of a sub-
stance (here pesticide) is an estimate of the amount a substance in food or drinks,
normally expressed on a body weight basis that can be ingested in a period of 24 h or
less without appreciable health risks to the consumer on the basis of all known facts
at the time of the evaluation. ARfD apply only to pesticides that cause acute effects,
for example, phosphorus pesticides that are cholinesterase inhibitors.
ß 2007 by Taylor & Francis Group, LLC.
The Codex Committee on Pesticide Residues (CCPR) considers at their annual
meetings the MRLs proposed by the JMPR. CCPR is an intergovernmental meeting
with the prime objective to reach agreement on proposed MRLs. The MRLs are
discussed in an eight-step procedure and after the final step the CCPR recommends
MRLs to CAC, for adoption as Codex MRLs. To protect the health of the consumers,
the intake calculated using the proposed MRLs is compared with the ADI or the
ARfD and if the calculated intake exceeds one of these two values the MRL cannot
be accepted.
Often when national MRLs are set, an evaluation is performed on a national
level, that in many ways are similar to the evaluation performed by JMPR.
Some countries also set their own ADIs or ARfDs. As part of the evaluation of
pesticides within the European Union (EU) ADIs and ARfDs are set on the EU level
which then apply in all Member States. These values can differ from the values set
by Codex.
The Member States within the EU, which includes 27 countries, set harmonized
EU MRLs for pesticide s. All harmonized legislation can be found on the Web site of
the EU Commission.
2
At the moment not all pesticides have harmonized MRLs and
for these pesticides nationally MRLs can be set. In April 2005, new legislation
(Regulation 396=2005)
2
entered into force in which only harmonized EU MRLs can
be set and all national legislation are turned into EU legislation. The new regulation
does, however, not apply at the moment, as all the annexes to the regulation are not
yet established.
Some countries publish their MRLs on the Internet, for example, United States,
3
Canada,
4
Australia,
5
New Zealand,
6
India,
7
Japan,
8
South Africa,
9
Thailand,
10
and
Korea.
11
In Australia,
5
New Zealand,
12
and the United States (USDA
13
), authorities
have compiled information about legislation and MRLs worldwide. Other countries
do not have their own legislation and MRLs published on Web sites but the
information can be gathered by contacting the relevant authorities. For countries
that have published MRLs on Web sites be aware that addresses changes and the
most recent legislation is not yet published.
11.2.2 MONITORING PROGRAMS;GENERAL ASPECTS
There is a growing interest in pesticide residues in food from all aspects of the food
chain from ‘‘the farm to the fork.’’ It is the national governments that are responsible
for regular monitoring of pesticide residues in food. Besides the national govern-
ments, monitoring activities or surveillance are also performed by nongovernmental
organizations or by scientists studying the occurrence and fate of pesticides in
relation to environment, agriculture, food, or human health. Food companies may
also monitor pesticide residues in their products to secure and demonstrate good food
safety quality of their products and=or prevent economical losses.
The monitoring sampling may be surveillance sampling where there is no prior
knowledge or evidence that a specific food shipment contain samples exceeding the
MRLs. The surveillance sampling may also include more frequent sampling of food
groups with samples frequently exceeding the MRLs. Com pliance sampling is
defined as a direct follow-up enforcement sampling, where the samples are taken
ß 2007 by Taylor & Francis Group, LLC.
in case of suspicion for previously found violations. The follow-up enforcement may
be direc ted to a specific grower=producer or to a specific consignment. To cover both
the control aspect and the food safety aspect regarding exposure assessments, the
design of a monitoring program may be a mixture of a program where the different
food types are weighted relative to the consumption or sale and one where the food
groups with samples exceeding the MRLs are weighted higher. In order to be able to
have more samples of the same type for comparisons, all sample types may not be
monitored annually as the selection of some (minor) sample types may change from
year to year.
The monitoring programs do often include imported as well as domestically
produced foods. Domestic samples may be collected as close to the point of
production as possible, for food crops the sampling may be at the farm or at
wholesalers or retailers. Imported samples may be collected by the customs author-
ities or at the import firms or retailers. The samples are often raw food, for example,
fruits, vegetables, cereals, or food of animal origin. In addition, different kinds
of processed foods are monitored, for example, dried, extracted, fermented, heated,
milled, peeled, pressed, washed, or otherwise prepared product s. The different
kinds of processing, in most cases, lead to a decrease in levels of pesticides compared
with the contents in the raw food.
An important parameter for a monitoring program is the choice and the number
of pesticides investigated. To cover as many pesticides as possible, both multi-
methods and single residue methods may have to be included in the monitoring
program. In 2003, the U.S. Food and Drug Administration (US FDA) was able to
monitor roughly half of the 400 pesticides for which U.S. Environmental Protection
Agency (EPA) had set tolerances.
14
The same year all states participating in the EU
monitoring progra m together analyzed for 519 different pesticides. However, most of
the individual countries analyzed for a much smaller number of pesticides, for
example, about 100–200.
15
In addition to the selection and number of pesticide s
analyzed for, the detection limits of the pesticides in the different foods are deter-
mining for how frequent findings of pesticide residues are.
On a worldwide scale, two major monitoring programs including many states
exists: the EU moni toring programs and the US FDA program, both programs
publishing their annual results at their respective Web sites. As an example, the
‘‘Monitoring of pesticide Residues in Products of Plant Origin in the European
Union, Norway, Iceland and Liechtenstein 2004’’ included a total of 60,450 samples
of which 92% of the samples were fresh fruits, vegetables, and cereals and 8% were
processed foods.
16
The US FDA program included 7234 samples of fruits, veget-
ables, cereals, and food of animal origin.
14
11.2.3 RESULTS FROM MONITORING PROGRAMS
The results of pesticide residues in different foods were found in internationally
published surveys and monitoring programs on pesticide residues. The results are
attempted to reflect the pesticide residue results in food worldwide. However, many
countries either do not have monitoring results for pesticide residues or do not
publish them so they are not available internationally. The European Commission
ß 2007 by Taylor & Francis Group, LLC.
compiles monitoring data from the 25 member states and Norway, Iceland, and
Liechtenstein in annual reports
15–17
and the US FDA as well publish annual reports
on their monitoring and surveillance program for pesticides in food.
14
11.2.3.1 Fruits and Vegetables
In general, fresh fruits and vegetables account for the largest proportion of samples
analyzed within pesticide monitoring programs. In 2003, the US FDA monitoring
program of vegetables included 1132 domestic samples and 2494 imported samp les,
the major part of the total samples imported from Mexico, China, the Netherlands, and
Chile.
14
Pesticide residues MRL were detected in 30% of the domestic and 21% of
the imported vegetable samp les, whereas violations were detected in 1.9% of the
domestic and 6.7% of the imported vegetable samples. The frequency of fruit samples
with detected pesticide residues MRL is somewhat higher: 49% of 813 domestic
samples and 31% of 1537 imported fruit samples. The violations comprised 2.2% of
the domestic and 5.3% of the imported fruit samples. Pesticide residues were detected
in approximately half of the apple and pears and 60%–70% of the citrus fruits.
The ‘‘EU Monitoring of pesticides in Products of Plant Origin 2004’’ included
50,428 fruit and vegetable samples for surveillance monitoring of which 42%
contained residues MRL and in 5% of the samples the residue concent rations
exceeded the MRL. In addition to the surveillance sampling, in 2004, 4% of all the
samples were follow-up enforcement samp les. The more targeted nature of the follow-
up sampling resulted in a higher percentage of the samples exceeding the MRL, that is,
10.2% of the 2211 fruit and vegetable samples.
The overall trend in the presence of pesticide residues was followed from 1996 to
2004 for fruits, vegetables, and cereals (of which cereals comprise only ~5%). The
percentage of samples with residues below or at the MRL (national or EC-MRL) has
increased from 32% in 1999 to 42% in 2004. The percentage of samples with residues
above the MRL varied from 3% in 1996 to 5.5% in 2002=2003. In 2004, the 5%
violations were slightlylower than the last 2years. Inaddition, the frequency of multiple
residues in samples has increased from 14% in 1998 to 23% in 2004. Different factors
may have contributed to the trend in the results. During that period, the average number
of pesticides detected for increased from ~126 to 169, which may result in more
findings. The legislative situation has also changed in recent years and will continue
to change in direction of more MRLs set at the limit of detection (LOD).
The most frequently found pesticides in the monitoring of frui ts and vegetables
(in descending order) were dithiocarbamates,* chlorpyriphos,
y
imazalil,* procymi-
done,* benomyl group,* iprodione,* thiabendazole,* chlormequat,
z
bromide,
§
and
orthophenylphenol.* Approximately half of the 677 compounds detected for were
actually detected.
Within the EU monitoring program, the Commission has designed a coordinated
program, where eight alternating commodities were analyzed for a certain number of
* Fungicide.
y
Insecticide.
z
Growth regulator.
§
Indicator of bromofumigants.
ß 2007 by Taylor & Francis Group, LLC.
pesticides. In 2004, the program included 47 pesticides and the most frequent detections
of particular pesticide=commodity combinations were cyprodinil,* fenhexamid,* tolyl-
fluanid,* and azoxystrobin,* each found in 13%–34% of the strawberries; iprodione*
and dithiocarbamates* in 22%–23% of the lettuce; benomyl group,* chlorpyriphos,
y
diphenylamine,* and captan (-folpet)* in 15%–20% of the apples. Examples of results
from the EU-coordinated program 2000–2004 are shown in Table 11.1.
Two studies show the pesticide resi dues in Egypti an fruits and ve getables.
In 1997, 2318 samples of diff erent frui ts and vegeta bles were coll ected from
eight Egy ptian mark ets throu ghout the country.
18
The samp les were analyz ed
for 54 pesticide s. The samples of 19% c ontained detect able pesticide resi dues and
1.9 % exceeded the MRLs. Root and leafy vegeta bles showed low contam ination
freque ncies , whereas 29% of the fruit samples contained resi dues — among them
2.3 % violati ng the MR Ls. Di cofol and dim ethoate wer e the most freque ntly found
pesti cides. In anothe r study , 78 veg etable samples and 44 frui t samp les wer e
TABLE 11.1
Ex amples of Frequenci es of Pesticide Residues Foun d in the Fruit
an d Vegetabl e Commodit ies of the EU-Coor dinated Monit oring Program
Commodity Year
No. of Samples
Analyzed
% Samples with
Residues MRL
% Samples with
Residues > MRL
Apples 2004 3133 59 1.8
Apples 2001 2641 47 1.1
Bananas 2002 883 56 1
Grapes 2003 2163 57 5
Grapes 2001 1721 60 1.8
Oranges 2002 2144 78 4
Pears 2002 1330 21 2
Strawberries 2004 2668 63 2.8
Strawberries 2001 1652 51 3.3
Cucumber 2003 1150 24 3
Cucumber 2000 1176 16 1.4
Head cabbage 2004 918 23 2.3
Leek 2004 769 16 1.3
Lettuce 2004 2301 48 3.3
Lettuce 2001 1838 49 3.9
Peas 2003 519 19 2
Peas 2000 730 20 3.0
Peppers 2003 1754 34 6
Tomatoes 2004 2665 36 0.9
Tomatoes 2001 2016 33 1.5
Source: From http:==ec.europa.eu=food=fvo=specialreports=pesticides_index_en.htm
* Fungicide.
y
Insecticide.
ß 2007 by Taylor & Francis Group, LLC.
collected in Alexandria 1997–1998.
19
Cypermethrin, dimethoate, profenofos insecti-
cides, and dithiocarbamate fungicides were analyzed in samples of tomato, eggplant,
cucumber, potato, apple, grape, and orange. The most frequent findings were
dithiocarbamates in 73% of the tomatoes, 80% of the eggplants and cucumbers,
and 50% of the apples and grapes. The concentrations ranged from 0.002 to 0.29
mg=kg. The potatoes of 50% contained fenitrothion at a mean of 0.03 mg=kg.
Profenofos was detected in 70% of the grapes in the range 0.005–0.025 mg=kg.
In Brazil, the dithiocarbamates were found in 61% of 520 food samples with the
highest levels (up to 3.8 mg=kg) in strawberry, papaya, and banana.
20
Pesticide residue monitoring has been performed in different Asian countries.
In Taiwan, 1997–2003, pesticide residues were detected in 14% of 9955 samples
(analyzed for 79 pesticide residues) and 1.2% were violating the MRLs.
21
In India,
60 vegetables were analyzed for organochlorine, pyrethroid, carbam ate, and organo-
phosphorus pesticides during 1996–1997.
22
Among the samples (okra, smooth
gourd, bitter gourd, cucumber, tomato, and brinjal), 92% contained organochlorine
pesticides (OCPs), 80% organophosphorus pesticides, 41% pyrethroides, and 30%
carbamates. p,p
0
-DDT was the most dominant DDT compound, indicating recent use
of the DDT in the fields. SDDT was, for example, 0.28Æ0.41 mg=kg in okra.
Chlorpyriphos in two brinjal samples exceeded the MRL of 0.2 mg=kg and
eight samples of brinjal with triazophos also exceeded the MRL. In 2000–2002,
in Karachi, Pakistan, 206 samples of different vegetables were analyzed for 24
pesticides.
23
63% of the samples contained residues and 46% of them were violating
the MRLs. However, the violations showed a downward trend with 62%, 56%, 37%,
and 31% during the period 2000–2003. The p esticides that contributed to the viola-
tions were methamidophos , cypermethrin, cyhalothrin, carbofuran, and dimethoate.
Of the 27 different vegetables analyzed, the violations were found in, for example, 4 of
7 carrot samples, 4 of 6 garlic samples, and 5 of 10 spinach samples.
The growth regulator chlormequat is an example of a pesticide that has been
regulated during the period 2001–2006 and due to the systemic effect the residues
remained in the pear trees from one year to another, causing residues in the pears
even in harvest seasons without application of chlormequat. Chlormequat was
studied in UK foods.
24
In 2001, the EU MRL of 3 mg=kg for pears was changed
to a temporary MRL of 0.5 mg=kg, which was reduced in two steps to end in 2006 at
the LOD level of 0.05 mg=kg. Surveys in 1997 and 1998 showed chlormequat
contents of 0.05–16 mg=kg (n ¼ 54) and 0.05–11 mg=kg (n ¼ 48), respectively. In
1999, the half of 97 pear samples contained chlormequat and 10% exceeded the
MRL of 3 mg=kg. In 2000, 79% of 136 samples contained chlormequat, but none of
the samples exceeded the MRL of 3 mg=kg. A small survey in 2002 showed that
only 42% of 75 samples contained chlormequat all below the MRL of 0.5 mg=kg.
11.2.3.2 Processed Fruits and Vegetables Including Processing Studies
The MRL is established for residues in the whole commodity. Hence for control
purposes in the monitoring program, the pesticide residues are mostly determined in
raw commodities. However, many foods are eaten after different k inds of processing.
The processing of the food is defined as any operation performed on a food or food
ß 2007 by Taylor & Francis Group, LLC.
product from the point of harves t throu gh consum ptio n. The proces sing may
take place when prepar ing the food at home or be commerci al food proces sing.
Typ ical home proces sing includes washing, peeling, heating, or juicing, whereas
the commerci al food proces sing addit ionally may incl ude dryin g, canning, ferment-
ing, oil extrac tion, re fining, preser ving, jammi ng, mixing with other ingre dients,
and so on.
The proces sing may affect the pesticide residue level s in the food product s
mai nly by reduci ng the levels. The extent to which a pesticide is remo ved durin g
proces sing dep ends on a varie ty of facto rs such as chemi cal proper ties of the
pesti cide, the natur e of the food commodi ty, the processing step, and time of
proces sing.
25
The reduct ions may b e predicted by the solub ility, sensi tivity toward
hy drolysis , octanol –water propor tion ing, and the volat ility; for examp le, lipo philic
pesti cides tend to concentrate in tissues rich in lipids. Exa mples to the contr ary are
incre ased pesticide levels after drying or re fining. The effects of proces sing on
pesti cide residues in food are compiled in a revie w by Holland et al.
25
and severa l
studi es on the effect of proces sing on the pesti cide levels are made related to
comm ercia l or home proces sing. Informat ion on proces sing may also be found in
the annual pesti cide evalua tions reported by JMPR
26
and in the EFSA conclu sions
27
perfor med as part of the overal l evalua tion in the EU. Dur ing these join t meet ings on
pesti cide residues (JMPR) , selec ted pesticide s have been revie wed including the
effect s of processing but the compa ny da ta presen ted here may be in a compiled form
wi thout detailed informat ion.
A majority of the pesticide s applied direc tly to crops are mainly found o n the
surfa ce of the crops,
25
as the crops cuticular wax serves as a trans port barrier for
pesti cides. Hence, the majorit ies of the pesticide resi dues may be found in the peel
and when the peel is not an edibl e part, this will reduce the pesticide level s taken in
throu gh the diet . This is often the case for citr us fruits, where an inves tigatio n
show ed that > 90% of the pesti cide resi dues wer e found in the peel.
28
In a study on apple proces sing, juicing and peeling signi ficantly reduced
the level s of 14 pesti cides inves tigated compa red with the unproce ssed apple.
29
However, none of the pesticide residues were significantly reduced when the apples
were subjected to simple washing or coring. The effect of processing was compared
for two different apple varieties, Discovery and Jonagold, and the pesticides
selected for field application were the most commonly used in the Danish apple
orchards or those most often detected in the national monitoring program. The
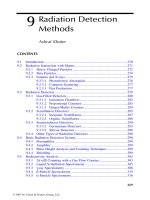
con centratio ns of chlorp yriphos in unproce ssed and processed apples (Figure 11.1)
show, for example, that peeling reduced the chlorpyriphos concentration by 93% and
juicing reduced the chlorpyriphos concentrations by 95% compared with the unpro-
cessed samples.
In a study on commercial processing, samples of tomatoes, peppers, asparagus,
spinach, and peaches were exposed to three insecticides and four dithiocarbamates.
30
In most cases, canning operations gradually decreased the residue levels in the
finished product, particularly through washing, blanching, peeling, and cooking
processes. Washing and blanch ing led to >50% loss in pesticide residues except
for peaches. The total amount of pesticide reduced by all the combined canning
operations ranged from 90% to 100% in most products.
ß 2007 by Taylor & Francis Group, LLC.
The reduction of pesticides are not necessarily beneficial; the pesticide
may be degraded to a metabolite more hazardous like the ethylenethiourea (ETU)
formed during degradation of dithiocarbamates. The formation of ETU was
studied for different food processing steps, for example, 80% of ethylenebisdithio-
carbamate was metabolized to ETU in the drinkable beer.
31
The persistence of the
ETU varies in different matrices and it may be stable for up to 200 days in canned
tomato puree.
32
Both the reduction due to processing of wine and the pesticide residues in wine
were compiled in an Italian study.
33
The different pesticides behaved differently
according to their physicochemical properties and some of the pesticides disappeared
totally or partly during the wine-making either due to degradation in the acidic
environment, degradation during the fermentation process, or adsorp tion by the
lees and the cake. Only a few pesticides passed from the grape to the wine without
showing appreciable reduction among them: dimethoate, omethoate, metalaxyl, and
pyrimethanil. In 1998–1999, 449 wine samples were analyzed for ~120 pesticides.
Only very few pesticides were found in wine and at low levels.
Pesticide residues in processed food are monitored, for example, within EU. In
2004, 6% of the samples or 3678 samples were processed products.
16
The percent-
ages of monitoring samples with residues were significantly lower in processed food
than in fresh products. Residues MRL were found in 24% of the samples, and
residues exceeding the MRL were found in 1.2% of the samples. The processed food
comprise of many kinds of food including vegetable oil, canned products, olives,
cereal products, beverages, juices, and wine. In the EU-coordinated monitoring
program, 704 samples of orange juice were taken. Residues below or at MRL
were detected in 23% of these samples and in 2.3% of the juice samples, the pesticide
concentrations detected exceeded the MRLs.
16
Chlorpyriphos
#
#
#
#
#
0.00 0.20 0.40 0.60 0.80 1.00 1.20 1.40 1.60 1.80 2.00
Unprocessed apple
Washed apple
Washed and wiped apple
Peeled apple
Apple peel
Apple core
Cored apple
Boiled apple
Stored apple
Apple juice
Apple juice pulp
Processing
Pesticide in milli
g
ram/apple in kilo
g
ram
FIGURE 11.1 Concentrations (mg=kg) of chlorpyriphos in apples of the variety Discovery
before and after different kinds of processing. (After Rasmussen, R.R., Poulsen, M.E., and
Hansen, H.C.B., Food Addit. Contam., 20, 1044, 2003.) #: Significant changes at the 95%
confidence level (n ¼ 5).
ß 2007 by Taylor & Francis Group, LLC.
11. 2.3.3 Cereals
Cer eals co ver a range of crops like whea t, rye, barle y, rice, maize, and mil let. Cereals
are spraye d wi th insec ticides, fungi cides, herbi cides , and growth regul ators throu gh
the whol e growing perio d. To prote ct against insec ts, the stor ed cereals are often
po stharvest -treated with insecticides. The refore, the most freque ntly found pesticide s
are the insec ticides mal athion, pyrimip hos-me thyl, chlorpyrif os-methyl , delt ameth-
rine, and dichlorvos .
34
Despite the high use of pesticide s in cereal product ion,
resi dues can be found less freque ntly than, for examp le, in fruits. The reason may
be that the laboratori es do n ot analyze for the whole range of p esticides used in the
product ion. Additi onally the samp les, if coll ected at the mills , can be mix tures from
diff erent produce rs with diff erent usage of pesticide s and the individua l pesticide
resi dues can there fore b e dilu ted to below the analyt ical limit of detection.
Published data on pesticide residues in cereal s are relatively scatt ered. The major
part of the data found and presented later, covering the period from 2000 onwa rd, are
from the United State s and Eur ope. No data were found either from South Ameri ca,
Afr ica, or Aus tralia. Dat a from Asia are from the two biggest natio ns, India and
Chi na, and cover there fore the majority of the popula tion of this regio n.
35 –38
How ever, the results consi st o nly of data on DDTs and HCHs. This re flects most
like ly the usage pattern of these compo unds, whi ch are effect ive and cheap, but also
that the labor atories have not, due to lack of capacity, included the newer develo ped
pesti cides in thei r monitor ing program. From Tab le 11.2 , it is seen that in India and
China, DDTs and HCHs were frequently found in rice and wheat.
Since 1991, the U.S. Department of Agriculture (USDA) has been responsible
for the pesticide residues testing program in cereals produced in the United States.
The data for 2000–2003 for the five major cereal types, barley, corn, oats, rice, and
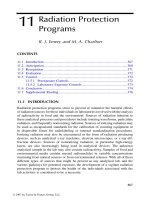
whea t, a re show n in Figure 11.2.
39 –42
TABLE 11.2
Pesticide Residue Results in Cereals from Asia
SDDT
g=kg
SHCH
mg=kg
Other
Pesticides
mg=kg
Number
of Samples
Year
of Sampling References
India—rice 0.023 0.066 30 [35]
India—rice 0.01
(57.7%)
0.013
(64.4%)
2000 [36]
India—wheat 0.22 2.99 7.9-SHeptachlor,
0.17-Aldrin
150 [37]
China—cereals 0.0045
(5.0%)
0.0011
(53.0%)
60 2002 [38]
China—cereals 0.0252 0.0053 1999 [38]
China—cereals 0.0019 0.0048 1992 [38]
Note: Numbers in brackets are percentage of samples with residues.
ß 2007 by Taylor & Francis Group, LLC.
Approx imately 200 (ranging from 132 to 245) samples are analyz ed each year;
most of them are wheat and corn. Res idues above the MR Ls were found in 2.3 % o f
the rice samples in 2001 and in 5.7 % of the corn samp les in 2002. Figure 11.2 shows
that sample type with the highes t freque ncy of residue s was whea t and that barley
had the low est freque ncy of resi dues. For corn, rice, and whea t, a decreas e has been
detected from 2001 to 2003. No informat ion is given on the speci fic pesti cides found
in the cereal s as only a common list for all the comm odities is given. Neverthel ess,
the grow th regul ator, chlormequa t, and the herbi cide, glyphosate, were not included
in the list and wer e probabl y freque ntly used. Therefor e, the numbe r of samp les wi th
residues may hav e been higher than reporte d.
Reynolds et al.
24
inves tigated the levels of chlor mequa t in UK-pr oduced
cereals from 1997 to 2002 and found residues in 50% of 59 wheat samp les at
0.05 –0.7 mg=kg and in 41% of 45 barle y samp les at 0.06 –1.1 mg=kg; no ne of the
samples exceeded the UK MRL s for grain. A simil ar study from Denmark showed
that chlor mequat was found in whea t, rye, and oat in 71%, 60%, and 100%,
respec tively.
43
Glyphosa te was found in more than half of the moni tored cereal
samples produce d in Denmark from 1988 to 199 9.
44
In 2004, the numbe r of cereal samp les analyzed and compiled by the European
Comm ission were 2719 and the percent ages of samples with resi dues MR L
and e xceeding the MR L (national or EC-MR L) wer e 2 9% and 1.1%, respec tive ly.
The data do not include informat ion on the type of cereal s analyzed. In 2004,
the most freque ntly found pesti cides wer e pirimi phos-meth yl,* mal athion,*
140
23
38
10
9
94
44
9
11
64
115
39
4
70
17
69
22
6
24
11
0
10
20
30
40
50
60
70
Barley Corn Oats Rice Wheat
% Samples with residues
2000
2001
2002
2003
FIGURE 11.2 Frequencies of samples with residues from 2000 to 2004 in barley, corn, rice,
and wheat produced in the United States. The values above the bars are the numbers of samples
analyzed. (Data from US FDA, http:==www.cfsan.fda.gov=~dms=pes00rep.html#table_1; http:==
www.cfsan.fda.gov=~dms=pes01rep.html#table_1; http:==www.cfsan.fda.gov=~dms=pes02rep.
html#table_1; http:==www.cfsan.fda.gov=~dms=pes03rep.html#table_1).
* Insecticide.
ß 2007 by Taylor & Francis Group, LLC.
chlor pyrip hos-methy l,* chlormequa t,
§
deltamet hrin,* c hlorpyriph os,* glypho sate,
y
brom ides,
z
dichl orvos,* and mepi quat.
§
The pesti cides found were mai nly insec ti-
cides and the list con firms the findings of previo us years.
Apart from the na tional moni toring p rogram, the Comm ission conduc ts a coord-
inat ed moni toring progra m, where cereal s are included regul arly. Wheat has been
incl uded in 1999 and 2003, rice in 2000 and 2003, and rye=oats in 2004. The data show
that resi dues wer e found in 21% –22% of the whea t samp les (Table 11.3) and the three
most freque ntly found pesti cides were the insecticides pirimi phos-meth yl, chlorpyr-
iphos -methyl, and deltamet hrin. For rice, the samp les with resi dues wer e 8.7% –12%
and the three most freque nt p esticides were the insec ticides pirimi phos-meth yl, delta-
met hrin, and the dithiocar bamate fungi cides . The resul ts for 2004 do no t dist inguish
betw een oats and rye, but all together resi dues were found in 19% of the samples.
Table 11.4 shows detai ls from the coordinated progra m of residues found in
cereal s from the two maj or cereal -produ cing countries in the EU, France , and
Ger many.
15,16
The resi dues found in o at=rye and whea t were mai nly organop hos-
ph orus insecticides such as malathi on, piri miphos-me thyl, and chlorpyrip hos-methy l.
How ever, the pyrethroid insec ticide delt amethrin and diff erent fungicides like imaza-
lil, dith iocarbamat es, and thiabendazol were also present. Since chlormequa t and
glypho sate wer e not incl uded in the monitor ing progra m, the freque ncy of samples
wi th residues was, like in the samples from the Uni ted States, probably higher . In
Ger many, exceedanc es of MRL were found for pirimiphos- meth yl, thiabendazol e,
and met alaxyl.
Storage may have only very smal l e ffect on the degrada tion of pe sticide residues.
How ever, the temperat ure and humidity influence the degradation during storage
and malathion residues can be decreased by 30%–40% over 32 weeks at 308.
45
TABLE 11.3
Res ults from the EU-Coor dinated Monit oring Pro gram in Relation
to Cere als
Year of Sample
Collection
Number
of Samples
% Samples
with Residues
below MRL
% Samples
above MRL
Number
of Pesticides
Included in the
Analytical Program
Wheat 1999 1159 21 0.5 20
Wheat 2003 1021 22 0.3 41
Rice 2000 869 8.7 1.7 20
Rice 2003 635 12 1 41
Oats=rye 2004 775 19 0.6 47
Source: From http:==ec.europa.eu=food=fvo=specialreports=pesticides_index_en.htm
* Insecticide.
y
Herbicide.
z
Indicator of bromofumigants.
§
Growth regulator.
ß 2007 by Taylor & Francis Group, LLC.
TABLE 11.4
Residues in Wh eat (20 03) and Oat=Rye (200 4) Fo und in Samples
from F rance an d Germany
Pesticide
No. of
Samples
With
Residues
MRL (%)
Residues >
MRL (%)
Highest
Concentration
mg=kg
MRL
mg=kg
Oat=rye
France Chlorpyriphos-
methyl
106 8 0.02 3
Malathion 106 22 2.4 8
Parathion 106 1 0.01 0.05
Pirimiphos-methyl 106 2 0.26 5
Total 106 26
Germany Chlorpyriphos 180 1 0.012 0.05
Imazalil 155 1 0.01 0.02
Dithiocarbamates 103 7 0.46 1
Pirimiphos-methyl 180 18 0.6 7.9 5
Thiabendazol 132 1 0.8 0.056 0.05
Tolylfl uanid 180 1 0.051 0.1
Total 180 23
Wheat
France Chlorpyriphos 131 12 0.04 0.05
Chlorpyriphos-
methyl
131 18 0.15 3
Deltamethrin 131 23 0.12 1
Malathion 131 28 3.1 8
Pirimiphos-
methyl
131 43 2.45
Total 131 59
Germany Benomyl 159 1 0.034 0.1
Chlorpyriphos 234 0 0.03 0.05
Dimethoate 238 0 0.007 0.3
Imazalil 230 3 0.014 0.02
Malathion 231 1 0.018 8
Dithiocarbamates 110 5 0.03 1
Metalaxyl 196 1 0.5 0.02 0.01
Parathion 198 1 0.005 0.1
Pirimiphos-
methyl
235 11 0.76 5
Procymidone 195 1 0.013 0.02
Propyzamide 192 1 0.018 0.02
Total 238 16
Sources: From EU, Monitoring of Pesticide Residues in Products of Plant Origin in the European Union,
Norway, Iceland and Liechtenstein 2003, Report Summary, 2005. Available at http:==www
.Europa.eu.int=comm=food=pl ant=protection; EC, Monitoring of Pesticide Residues in Products
of Plant Origin in the European Union, Norway, Iceland and Liechthenstein 2004. Report from
the European Commission, SEC(2006)1416, 2006. Available at http:==ec.europa.eu=food=fvo=
specialreports=pesticide_residues=report_ 2004_en.pdf
ß 2007 by Taylor & Francis Group, LLC.
Fo r wheat, Uygu n et al.
46
have report ed 50% degrada tion over 127 days of mala thion
and 30% of fenitrot hion over 55 days. Residue s of pesticide s are greatly reduced by
mil ling. Most resi dues are presen t in the outer part of the grain , an d consequ en tly
the reduct ion, for examp le, from wheat to sifte d flour can be as high as 90%, whereas
the concent ration in the bran increase compa red wi th the whole grain. Furthe r
coo king reduced malathi on and its degrada tion compou nds if the grain s wer e bo iled
in water.
47
11. 2.3.4 Food of Animal Ori gin
Pe sticide resi dues occur in animals as a result of both previ ous and presen t uses of
pesti cides for agric ultural purposes. The residue levels in product s of animal origin
are, howe ver, general ly low or nondetectabl e ( < 0.01 mg=kg). The residues ingested
by , for example, livestock via the feed are met abolized by the animals and for most
pesti cides, in parti cular, in the case of the more moder n pesticide s the major part of
the pesti cides=metaboli tes is excret ed. The highes t levels of pesticide resi dues (includ-
ing metaboli tes) are most often o bserved in organs involved in the metaboli sm and
exc retion of the pesti cides, for examp le, live r and kidney.
In refere nce to product s o f animal origin, the focus has mai nly been on persi stent
pesti cides, author ized and used in large amounts and for a wi de range of purpos es
from the 1950s to 1970s. The very effi cient pesticide s such as OCPs were also later
found to be very stabl e in the environmen t, to bioaccumul ate throu gh the food chain,
and to pose a risk of causin g advers e human he alth effects.
In most parts of the world, the use of the environmen tally persi stent pesticide s
has been reduced dram atically durin g the last decades . The use of, for examp le, DD T
was restricted in the Uni ted State s, Canada, and most European countr ies in the early
19 70s. In severa l develo ping countries with the need for malaria contr ol, DD T has
bee n used until the end of the 1990s. Other OCPs like dicofol were still in use in
20 03 in, for examp le, China, and DDT is still author ized in different parts of the
wor ld for, for examp le, malaria contr ol.
48,49
OCPs are detectable in most mat rices of anim al origin especi ally matrices with
high fat c ontent like butt er
50
(Tab le 11.5), cheese,
55
milk,
54,56,57
an d meat .
58 –60
The
levels are dependent on the age of the animals at the time of slaughter
58
and the fat
content of the product,
59
that is, the older the animal and the higher the fat content,
the higher is in general the residue level of OCPs. In areas where the organochlorine
compounds were recently or are still in use, legally or illegally, the residue levels are
in some cases at or above the MRLs (Table 11.5).
Results from the Danish Monitoring program (1995 – 1996
43
and 1998–2003
51
)
have shown that OCPs are detectable, but below the MRL, in more than half of
the animal product samples analyzed (n ¼ 1408). The animal products include meat,
fish, butter, mixed products of butter and vegetable oils, cheese, animal fat, and eggs.
In animal fat, SDDT was detected in the majority of the samples (about 65%) but
at low levels (mean levels 15 mg=kg fat). a-HCH was detected in <1% of
the samples of animal origin (excluding sea food) and at mean levels 0.5 mg=kg
fat. Dieldrin was detected in <10% of the samples of animal origin at mean levels
ß 2007 by Taylor & Francis Group, LLC.
6 mg=kg fat. None of six organophosphor us pesticides included in the analysis
were detected in the 231 analyzed samples of pork and bovine meat.
The frequencies of DDT, HCH, and dieldrin found in Japanese samples during
2000–2004
61
are higher compared with the Danish data. SDDT was detected in
64%, 90%, and 90% of beef (n ¼ 25), pork (n ¼ 30), and poultry (n ¼ 20) samples.
SHCH was detected in 24%, 23%, and 20% of the Japanese samples, respectively.
Dieldrin was detected in 24%, 23%, and 45% of the samples.
In several studies, butter has been analyzed as a representative of animal
products with high fat contents and the levels found can be used as an indicator of
the general OCP levels in animal products. The results show that the levels found in
butter originating from countries like India and Mexico are higher compared
with butter originating from countries such as Denmark and Germany. The results
are in good agreement with the fact that the persistent OCPs were banned earlier in
the latter countries than they were in the former countries.
TABLE 11.5
Residue Levels (mg=kg Fat Unless Otherwise Stated) of the Sum of DDT
and Its Degradation Produ cts DDE and DDD (SDDT) and Sum of
HCH Isomers (SHCH) in Bovine Butter
Country
(Year of Sampling) SDDT SHCH
Number
of Samples=
Number
of Samples
with Detectable
Residues References
Denmark
(1998–2003)
2 a-HCH: n.d. DDT: 126=26 [51]
HCH: 126=0
Spain ( 2000) p,p
0
-DDE: 7.3
(0.02–52.5) mg=kg
wet weight
g-HCH: 10.8
(0.0039–19.59)
g-HCH: 36=36 [52]
b-HCH: 3.2
(0.01–9.1)
mg=kg wet weight
b-HCH: 36=34
p,p
0
-DDE:
36=35 HCB:
36=32
Turkey (~2000) p,p
0
-DDT, p,p
0
-DDE,
and p,p
0
-DDD all
<0.001 mg=kg
g-HCH < 0.001
mg=kg
100=0 [53]
Canada ( 2000) 5.77 (0.38–16.92) 1.21 (0.13–2.10) 6 [50]
United States
( 2000)
23.61 (0.41–141.26) 1.33 (0 –2.17) 18 [50]
Australia ( 2000) 5.96 (1.44–13.78) 0.31 (0–0.86) 5 [50]
India (~2004) 120 mg=kg 0.132 mg=kg 46 [54]
Note: Mean values are presented and minimum and maximum values are presented in brackets.
ß 2007 by Taylor & Francis Group, LLC.
Weiss et al.
49
have pe rformed a wor ldwide survey of, among other compo unds,
DD T and HCB. One samp le of butt er was samp led from 39 Europ ean countries and
from 25 non-Euro pean countries. It was found that the average level of SDDT in
bu tter from all the participa ting countr ies was 10.8 m g=kg fat. The average level of
HCB in butter from all the participa ting countr ies was 3.5 mg=kg fat.
11. 2.3.4.1 Organo chlorin e pesti cides in fi sh
The residue levels of OCPs in fish vary great ly d epending on the origin. In general ,
higher level s are observed in seafoo d caught in waters close to po llution source s, for
exa mple, some coastal waters. The level s are also, in general , positive ly correlated
wi th the age and the fat conten t of the organi sm.
OCPs can be found in large fractions of seafood even from waters of countries,
wher e the compo unds have been banned for severa l decades . Tab le 11.6 presents
some reported levels of DDT, HCH, and dieldrin in different seafood samples caught
in different parts of the world. A large study has been performed on the levels of
OCPs in seafood from Taiwan, showing that OCPs were detectable in 24% of the
fish samples and organophosphorus compounds in 11% of the fish samples
(n ¼ 607). The detection rate was lower in shellfish, that is, OCPs in 6% and
organophosphorus compounds in none (n ¼ 62). The mean residue level of SDDT
in all of the sampled seafoo ds with detected residues was 32.5 mg=kg fresh weight.
OCPs occur in seafood samples from all over the world but the residue level of
DDE, DDD, and HCHs has been reported to decrease with time. The level of, for
example, DDE and DDD in cod liver from the Arctic has been reported to decrease
from a level of 60 and 45 mg=kg fat in 1987=1988 to levels of 40 and 15 mg=kg fat in
1995=1998, respectively.
67
11.2.3.5 Infant and Baby Food
Infants and children consume more foods per kilo body weight per day than adults
do. Furthermore, the detoxification systems of the infants are not fully developed.
These are some of the factors that make infants and young children a sensitive group
of consumers. The primary food intake for infants (0–6 months of age) is accounted
for by either human breast milk or formulae. As the child gets older, an increasing
proportion of the daily food intake is accounted for by vegetables, fruits, and cereals
and to some extent also food of animal origin, either prepared at home from raw
products or as preprocessed products. Different preferences are expected in regard to
which types of foods are introduced to young children and at what age, depending on
the different traditions in different population groups and different countries.
Special attention has been directed toward pesticide resi dues in infant and
weaning foods marketed as such. In 1999, Directive (99=39=EC)
68
was adopted by
the European Commission to insure low residues of pesticides in these products. By
this directive, the MRLs for individua l pesticides in baby foods were set at 0.01
mg=kg (in many cases, corresponding to the detection level) and the use of certain
pesticides for treatment of crops intended for the production of baby foods were
banned. The directive only applies to infant and baby food products on the European
market.
ß 2007 by Taylor & Francis Group, LLC.
TABLE 11.6
Examples of Reported Residue Levels (mg=kg Fresh Weight) of the Sum of DDT and Its Degradation Products DDE and DDD
(SDDT) and Sum of HCH Isomers (SHCH) in Fish and Seafood Samples (Unless Otherwise Stated)
Place and Year
of Sampling Matrix SDDT mg=kg
SHCH mg=kg
Fresh Weight Dieldrin
Number of Samples=
with Detectable
Residues References
Greenland (1994–1995) Polar cod liver 44 (16–122) 33 (13–55) 16 [62]
Greenland (1994) Polar cod liver (12–83) (6–16) 77 [63]
Cod liver (60–98) (7–9) 25
Danish waters
(1995–1996)
Cod liver (12–918) mg=kg fat (3–33) (a-HCH) (4–51) 40 [43]
Herring (2–61) (2–4) (a-HCH) (2–9) 66
Mackerel (2–5) (2–3) (a-HCH) (2–3) 41
Danish waters
(1998–2003)
Cod liver 260 mg=kg fat 2 (a-HCH) 18 111
a
[51]
Herring 8 0.4 (a-HCH) 3 219
b
Mackerel 4 0.6 (a-HCH) 3 20
c
Adriatic Sea (1997) Mackerel (19–33) mg=kg fat (0.20–0.83) (g -HCH) mg=kg fat (0.6–1.2) 52 [64]
Cod (281–399) mg=kg fat 6 (g-HCH) mg=kg fat (10–12) 49
China (1995=1996) Shellfish 138 (4–479)
d
4.6 (ND-17.2)
e
12 sites and 50–80
specimens per site
[65]
Taiwan (2001–2003) Fish, shellfish, bivalve,
crustacean, and cephalopod
32.5 (0.6–169.1) 0.9 (0.6–31)
f
920
g
[66]
Note: Mean values are presented and minimum and maximum values are presented in brackets.
a
DDT, HCH, and dieldrin were detectable in 100%, 70%, and 95% of the cod liver samples, respectively.
b
DDT, HCH, and dieldrin were detectable in 100%, 41%, and 94% of the herring samples, respectively.
c
DDT, HCH, and dieldrin were detectable in 100%, 75%, and 100% of the mackerel samples, respectively.
d
The levels were presented in microgram per kilogram dry weight (692 (22–2396)) and has therefore for comparison been divided by five, assuming a water content of 80%.
e
The levels were presented in microgram per kilogram dry weight (23 (ND-85.9)) and has therefore for comparison been divided by five, assuming a water content of 80%.
f
Dieldrin was detectable in 9 of 920 samples.
g
Residues were detectable in 176 of 920 samples.
ß 2007 by Taylor & Francis Group, LLC.
11.2.3.5.1 Residues in human breast milk
Human breast milk has a high fat content and for that reason a major concern in
relation to pesticide residues in human breast milk worldwide is the environmentally
stable pesticides, for example, OCPs. During breast-feeding, OCPs from the mother
are excreted via the milk to the baby.
The levels of OCPs vary and depend on the age of the mother,
69,70
whether the
mother has been breast-feeding before,
70
her eating habits (e.g., the amount of fatty
fish),
70,71
and place of livi ng, that is, whether there are OCPs in the local environ-
ment including the food.
71
The OCPs are of concern since they are under suspicion
for having the potential to affect, for example, the birth weight of infants, the risk of
cancer, and the neurodevelopment of infants.
The levels of OCPs have been shown to be higher in human breast milk from the
population of Asian countries such as China, India, Cambodia, and Indonesia
compared with European=North American countries such as UK, Germany, Sweden,
Spain, and Canada.
69
Wong
69
have reported that the levels of DDT, DDE, and
b-HCH in human breast milk are 2–15-fold higher in samples from China compared
with samples from several European countries.
69
Examples of residue level s of
SDDT and SHCH are shown in Table 11.7.
TABLE 11.7
Examples of Reported Residue Levels (mg=kg Fat) of the Sum of DDT
and Its Degradation Pr oducts DDE and DDD (SDDT) an d Sum of HCH
Isomers (SHCH) in Human Breast Milk
Origin of Samples
(Year of Sampling)
Level of SDDT
mg=kg Fat Unless
Other Ways Stated Level of SHCH
Number of
Samples
Analyzed References
Industrialized countries
Finland and Denmark
(1997–2001)
129 (31–443) b-HCH: 13
(2.7–66) mg=kg fat
130 [72]
Germany (1995–1997) DDT: 240 (27–1,540) b-HCH: 40 (4–50) 246 [73]
UK (1997–1998) DDT: 40, DDE: 430 168 [69]
Developing countries
China (1999–2000) DDT: 545 b-HCH: 1,030 169 [74]
DDE: 2,665
Vietnam (2000–2001) DDT: 218 (34–6,900) b-HCH: 36 (4–160) 86 [70]
DDE: 1,950
(340–16,000)
SDDT: 2,200
(440–17,000)
Zimbabwe (1999) p,p
0
-DDE: 4,863 b-HCH: 216 116 [75]
p,p
0
-DDT: 1,149 g-HCH: 99
SDDT: 6,314 SHCH: 383
Note: Mean values are presented and minimum and maximum values are presented in brackets.
ß 2007 by Taylor & Francis Group, LLC.
The levels of OCPs in breast milk are, in general, decreasing as a result
of the banning of the compounds and=or the restrictions on the uses.
71,73,74
The
SDDT levels in breast milk from women in Taiwan sampled in 2001 have,
for example, been found on average to contain 333 mg=kg milk fat (36 samples),
whereas the levels of SDDT in breast milk sampled in Taiwan in the previous
two decades on average amounted to 3595 mg=kg milk fat.
48
In breast milk from
German women, the level of DDT has been found to be ~81% lower in 1995=1997
(240 mg=kg milk fat) than it was 10 years earlier.
73
In milk from women in Indonesia (sampled 2001–2003), great differences in the
levels of SDDT and SHCH have been observed. The higher levels were observed in
suburban and rural areas and the lower levels in the urban areas.
Even though OCPs occur in human breast milk and therefore is consumed by
infants, a literature search and Web search do not reveal any authorities or
researchers that recommend avoiding breast-feeding. Thus the benefits counter-
balance any possible health risk in connection with pesticide residues.
11.2.3.5.2 Residues in formulae and weaning products
Formulae and weaning foods are highly processed foods and processing most often
reduces the levels of the pesticides. Especially, thermolabile pesticides are not
expected to be detectable in infant formulae or weaning foods, since these products
have been heat-treated during processing and for preservation. Furthermore, raw
products for the production of weaning foods are washed and perhaps also peeled.
The formulae available on the market are based on cow’s milk or soya or a
combination of the two. Weaning foods are, for example, fruit and vegetable
puree, fruit juices, cereal-based meals, complete meal s composed of, for example,
vegetables, pasta and meat, and biscuits.
Formulae has a relatively high fat content (~25 g=100 g) and OCPs are therefore
of relevance in reference to pesticide residues also in these products. Pesticides such
as the organophosphorus, carbamates, and pyrethroids have not been found to
accumulate in fat and milk of livestock to any significant degree and no residues
of these pesticides have been detected in 10 08 samples of U.S. manufactured milk-
based infant formulae samples.
76
Lackmann et al.
77
have shown that the intake of organochlorine compounds, for
example, DDT and DDE is significantly higher for breast-fed infants than for bottle-
fed infants in Germany. The serum concentration of DDE in breast-fed infants were
about 6 times higher after 6 week s of feeding compared with the serum concentration
in bottle-fed infants. Whether this relatively large difference is maintained, also after
a longer period of breast-fee ding, has not yet been reported.
Higher levels of OCPs are, in general, found in formulae and weaning products
produced in developing countries and lower levels in product s from developed
countries. In infant formulae collected from the Indian marked during 1989 residues
of SDDT and SHCH were found in 94% and 70% of the samples, respectively. A total
of 186 samples of 20 different brands were analyzed. The mean level of SDDT was
found to be 300 mg=kg fat and the mean level of SHCH was found to be 490 mg=kg fat.
In weaning foods, it is likely to detect pesticide residues due to use of pesticides
during cultivation of the raw products. In the U.S. Total Diet Studies (2000), a total
ß 2007 by Taylor & Francis Group, LLC.
of 78 items of different baby foods were analyzed. The most frequently found
pesticide residues were the insecticides carbaryl (18%), endosulfan (17%), malathion
(12%), and chlorpyriphos-methyl (10%) and the fungicide iprodione (12%). The
highest level of 0.096 mg=kg was found for iprodione.
78
Residues were only detected in one of a total of 181 samples of baby food
collected within the Danish Food Monitoring Programme 1998–2003.
79
The sample
with a residue of chlormequat (0.025 mg=kg) and mepiquat (0.019 mg=kg) was a
cereal powder.
Cressey and Vannoort
80
analyzed 25 infant formulae and 30 weaning foods,
commercially available in New Zealand in 1996. Soy-based formulae and weaning
products were screened for about 140 pesticides and the milk-based formulae for
OCPs (p,p
0
-DDE, p,p
0
-DDT, and dieldrin). p,p
0
-DDE was found in 7 of 20 milk-
based infant formulae and residues of p,p
0
-DDT were found in one milk-based infant
formulae. Dieldrin was detected in four of five soy-ba sed formulae. Dithiocarba-
mates (LOD of 100 mg=kg) were not found in any of the soy-based formulae or any
of the weaning foods. Cressey and Vannoort did not analyze for ETU, the degrad-
ation product of dithiocarbamates. Two organophosphorus pesticides, azinphos-
methyl and pirimiphos-methyl, were detected in one soy-based formulae and in
two out of nine cereal-based weaning foods, respectively.
In the Australian 19th total diet survey, residues were found in cereal-based
infant foods but not in formulae, infant desserts, or dinners. The pesticides detected
in the cereal-based products were chlorpyrifos-methyl (4 mg=kg), fenitrothion
(2 mg=kg), iprodione (4 mg=kg), and piperonyl butoxide (8 mg=kg). The residue
levels (nine samples) were low and the mean level ranged from 2 to 8 mg=kg. Thus,
no residues of DDT, DDE, or other OCPs were detected in formulae or infant foods
but some organophosphorus pesticides were found in cereal-based products.
81
11.3 CONSUMER EXPOSURE AND RISK ASSESSMENT
11.3.1 D
IETARY INTAKE ESTIMATION
To perform a dietary intake estimation is basically easy. The consumption is
multiplied with the content:
Intake ¼ consumption  content:
The question is, however, what consumption an d which content should be used.
Should it be mean values? Should it be high values, a kind of worst-case situation?
And how is the consumption respectively the content estimated? There is not one
way of performing dietary intake estimations and in the literature different ways of
performing the estimations have been used and in addition the data collection has
been very diverse. Therefore, it is also often very difficult to compare the dietary
estimations directly.
Dietary surveys can be performed in many ways. In some surveys, participants
are asked to fill out a diary about what they have been eating and the amounts; in
others, people are interviewed about what they have been eating, for example,
ß 2007 by Taylor & Francis Group, LLC.
yesterday. In some surveys, the food bought in the household is used for the
estimation of the consumption. Here, the total amount of, for example, potatoes is
divided by the number of people in the household and number of meals, where the
potatoes are eaten. Both number of participants, number of days, and the details
concerning the food eaten differ between dietary surveys. In many circumstances, the
food as eaten are calculated back by using recipes to ingredients or RAC; for
example, an apple pie is divi ded into flour (grain), apple, and other ingredients.
For total diet studies and duplicate diet studies, however, the content is directly
determined in the food eaten. In total diet studies, a certain number of raw and
prepared foods are chosen to represent the total diet of the population. The foods are
then bought and prepared according to recipes and the content of the pesticides or
other substances are directly determined in the foods. In the duplicate diet studies,
the participants collect exactly the same amount of food as they eat and the pesticides
are then determined in the collected foods.
Data concerning the content of the pesticides often comes from monitoring
or surveillance. These studies differ widely in regard to which pesticides that
are included, the number of pesticides included, and the number of commodities
included.
In the calculation of the dietary exposure, other factors such as correction for
undetectable residues or processing also influence the result. Although a pesticide is
not detected in a commodity, this d oes not necessarily mean that it is not present;
just that the level could be lower than the analytical LOD. In some calculations, the
undetectable residues are set at, for example,
1
2
LOD or another factor. It is known
that for examples peeling or boiling can reduce the amount of pesticides, whereas
drying (e.g., grapes to raisins) can increase the content of the pesticides. To perform
the most reliable estimation of the dietary exposure, processing factors should be
included if available.
Dietary exposure calculations can be performed with different approaches,
deterministic or probabilistic, and for both chronic and acute intake. The chronic
intake or the long-term intake is the possible intake over a long time, for example, a
whole life and in the risk assessment this intake is compared with the ADI. The acute
intake or the short-term intake, on the other hand, is the intake within 24 h or less, for
example, a meal. The acute intake is compared with the ARfD in the risk assessment.
11.3.1.1 Deterministic Approach (Chronic and Acute Intake)
A calculation of the chronic intake by the deterministic approach yields only a
single value for the intake and is also called a point estimate. In this approach,
a single value of the consumption of a commodity is multiplied with a single value of
the concentrations of residues. Often consumption and concentrations are average
values, but they can also be high percentiles if a worst-case calculation is performed.
If the chronic intake for a certain pesticide from all commodities is calculated, the
single intakes for each possible commodity are summed.
The acute intake in the determin istic approach is always calculated for a single
commodity. Depending on the commodity, different equations defined by JMPR
82
are used for calculation of the acute intake. In the two most often used equations,
ß 2007 by Taylor & Francis Group, LLC.
the so-called variability factor is included. This factor is based on the variation of the
residues in a composite sample. In monitoring, usually analyzed samples are com-
posite samples, while all the content of a pesticide found can b e from just one
sample. In an estimation of the acute intake, the intake from this one sample is of
interest and the variability factor is an expression used to estimate the content in a
single sample from the content in a composite sample.
The deterministic approach is the absolute most often used method for
the calculations of pesticide intakes. The advantages of the approach are that the
approach is easy and simple to perform and the results are easy to interpret. The
drawback of the approach is that the exposure is expressed as single values because
single values are used for both consumption and content regardless of the variability
in both variables. Thus, intakes determined by the deterministic approach are
generally highly overestimated.
11.3.1.2 Probabilistic Approach
Probabilistic modeling is called so because this approach yields the probability for an
intake. In this approach, the whole distribution of consumption data and concentra-
tions are used in the calculations, resulting in a new distribution for the intake; a
consumption of a commodity is chosen; and a residue in this commodity is chosen;
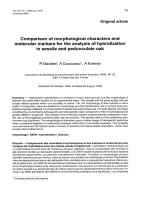
and the two values are multiplied to yield an intake. Then a new consumption value
and a new residue value are chosen. This is done several times, for example 100,000
times, resulting in a distribution of intakes
83
(Figure 11.3). In this way, percentiles of
the intake can be determined. The probabilistic modeling determines the acute or
short-term intake, if it is the consumption for a meal or a day that is used in the
calculation. Algorithms to calculate the chroni c intake have become a part of some
programs and the chronic intake can be compared with the ADI. The advantage of
this approach is that all data of both consumptions and concentrations are used, the
whole distribution of the intake is shown, and the uncertainties in the calculation can
be estimated.
Probabilistic modeling is, at the moment, not widely used. In connection with
authorization of pesticides, EPA in the United State s use probabilistic modeling as
00
ϫϭ
51015 0 5 10 1551015
FIGURE 11.3 How a distribution of intake is performed from a distribution of consump-
tion and of contents. (From Pieters, M.N. et al., Probabilistic Modelling of Dietary Intake
of Substances, The Risk Management Question Governs the Method, RIVM, Report
3200110012005, 2005. With permission.)
ß 2007 by Taylor & Francis Group, LLC.
part of their evaluations of the pesticides and have published guidelines for the
work.
84
Both in Codex and in the EU, the use of probabilistic modeling is discussed
and projects concerning the subject have been initiated.
85–87
11.3.1.3 Cumulative Exposure
The term ‘‘cumulative exposure’’ can be used in different ways. Some use it as the total
intake of a single pesticide from all commodities. The most often applied definition of
the term, and the definition used in this book, is that the cumulative exposure is the
total intake of all pesticides or a group of pesticides from all commodities. Several
approaches can be used
88
but at the moment there is no common agreement on which
approach to use to calculate the cumulative exposure for pesticides in our food.
Examples using two different approaches are summarized here, namely the
so-called TEF approach for the Danish and Brazilian population and the margin of
exposure (MOE) for the U.S. population. In both examples, the cumulative dietary
exposure is calculated for choline esterase inhibiting substances (organophosphates
and carbamates).
Using the TEF approach, exposures of a group of common mechanism chem-
icals with different potencies are normalized to yield a total equivalent exposure to
one of the chemicals, the so-called index compound (IC). TEFs are obtained as the
ratio of the toxic potency at the chosen toxicological end point of the IC to that of
each of the other members in the group. This means that a substance with a toxic
potency 10 times the IC is assigned a TEF value of 10. The exposure to each
chemical is then multiplied by the appropriate TEF for example, 10 to express all
exposures in terms of the IC. Summation of these values provides a total combined
exposure to all chemicals in terms of the IC.
To assess the cumulative risk of the exposure in the United States, the total
MOE
75
is used. MOE for a single chemical is the ratio of the effect dose level (ED) at
the chosen toxicological end point to the level of dietary exposure.
MOE ¼
ED
exposure
:
The combined MOE is
Combined MOE ¼
1
1=MOE1 þ 1MOE2 þ 1=MOE3
, etc:
The greater the MOE, the lesser is the risk. In the assessments, a target value of 100
is acceptable. MOEs <100 are undesirable.
11.3.2 INTAKE CALCULATIONS OF PESTICIDE RESIDUES
In this section, intake calculations or dietary exposure from different parts of the
world using different approaches are presented.
ß 2007 by Taylor & Francis Group, LLC.
11.3.2.1 Deterministic Approach
The results from the EU-coordinated monitoring program are used to calculate both
the chronic and acute intake every year.
16
For the chronic intake, the 90th percentiles
of all the results was used as concentration giving a worst-case situation. Consump-
tion figures were taken from the WHO Standar d European Diet, using 60 kg as body
weight. The exposure remains well below the ADI for all combinations of pesticide
and commodity, ranging from 0.009% of ADI for fenhexamid in strawberry to
5.36% of the ADI for the dithiocarbamates in lettuce. For the acute intake, the data
for the high or acute consumption from UK were used and the calculation was
performed wi th the highest residue found. For eight pesticides (deltamethrin,
dimethoate, lambda-cyhalothrin, dithiocarbamates, methamidophos, methidation,
methomyl, and oxydemeton-methyl), this gave results exceeding the ARfD. The
highest intake was 47 times the ARfD for oxydemeton-methyl in apples.
Using different figures for the residue contents, for example, MRLs or data from
monitoring programs can have a great impact on the intake, which are shown by an
example from a Korean intake estimate.
89
Data for consumption was from a 1998,
Nation Nutrition Survey and data for residue levels were found analyzing 6164
samples representing 107 different kinds of food commodities. All the samples were
collected at the same commercial market in 2001. Using MRLs as residues caused
that for 16% of the analyzed pesticides the intake exceeded the ADIs (Codex values).
When residue levels from the analyzed samples were used, the intake decreased
dramatically to <0.15% of ADI.
For some studies, the pesticide intakes are limited to include the OCPs that
bioaccumulate. From Uzbekistan, estimated monthly intake for the different isomers
of HCH were 1–60 mg=month for a-HCH; 2–140 mg=month for b-HCH depending
on food type.
90
The samples used for analyses were collected from three towns in
February 2001. Twelve different food types were collected among them: animal
products, fish, oils, vegetables, and cereals. The consum ption data were collected in
one city and comprised of 101 households. Information was gathered about the food
consumption in the previous month.
11.3.2.2 Total Diet and Duplicate Diet Studies
In India, during 1999–2002, a kind of duplicate diet study was performed for
men aged 19–24 years.
91
Every month vegetarian and nonvegetarian total diet
samples comprising breakfast, lunch, and dinner were collected. Lindane was the
pesticide most widely found, but the freque ncy decreased throughout the study
from about 90% in 1999 to about 25% in 2002. The Cod ex ADI for lindane of
0.008 mg=kg body weight was exceeded in 1999 for the vegetarian diet and in 1999
and 2000 for the nonvegetarian diet. An explanation for the high contribution from
lindane could be that about 21% of the consumption in the study came from milk
and milk products, which another study showed could be highly contaminated
with lindane.
In Kuwait, the dietary exposure to organophosphate pesticides was determined in
the total diet and the food consumption survey was conducted as a 24 h dietary recall
ß 2007 by Taylor & Francis Group, LLC.
study.
92
The 6700 participants were interviewed about what they had consumed
the previous day. All together 140 food items, divided into 11 food categories,
were selected to represent the list of the Kuwaiti total diet study. The Kuwaiti diet
is characterized by a high intake of cereals (grain), vegetables, and fruits and >90%
of the food is imported. Intakes for 19 different age groups were calculated and
all amoun ted to <6% of the ADIs. For males 15–19 years, diazinon contributed
most to the intake. Grain and vegetables were the food groups that contributed most
to the intake.
In the period 1986–199 1, the US FDA has performed a Total Diet Study.
93
The consumption data were based on two nationwide surveys covering about 50,000
participants. In the studies, over 5000 types of foods were identified but to the
Total Diet Study 234 foods were selected to represent all 5000 foods. The dietary
intakes of pesticide residues were estimated for eight age=sex groups. In Table 11.8,
the daily intakes per kilogram body weight for males 14–16 years are compared
with the relevant ADI (Codex values). The six pesticides that contributed most to
the daily intake and the pesticides that contribute most to the ADI are shown. The
overall conclusion was that the intakes of pesti cides are well below the ADI for all
age groups.
11.3.2.3 Cumulative Exposure
EPA has performed cumulative risk assessment for four groups of pesticides
94
namely organophosphates, N-methylcarbamates, triazines, and chloroacetanilides.
In these assessments, not only the dietary exposure is calculated but also the
exposure from water and residential uses. For triazines , exposure through food was
not considered as relevant and for chloroacetanilides only two pesticides were
included so these assessments are not summarized.
TABLE 11.8
Six Pesticides That Contribute Most to the Intake (mg=kg bw) and ADI (%)
for Males 14–16 Years in the U.S. Total Diet Study
a
Pesticides That
Contribute Most
to the Intake Intake mg=kg bw
Pesticides
That Contribute
Most to the ADI % of ADI
Chlorpropham (no ADI given) 0.2899 Dieldrin 3
Thiabendazole 0.1655 Heptachlor 1
Malathion 0.0965 Omethoate 0.53
Dichloran, total 0.0505 Malathion 0.48
Permethrin, total 0.0415 Dicofol (sum) 0.40
Carbaryl 0.0306 Carbaryl 0.31
a
Values taken from the published paper.
ß 2007 by Taylor & Francis Group, LLC.