Biodiesel Quality Emissions and By Products Part 5 ppt
Bạn đang xem bản rút gọn của tài liệu. Xem và tải ngay bản đầy đủ của tài liệu tại đây (492.62 KB, 25 trang )
6
Analysis of FAME in Diesel and Heating Oil
Vladimir Purghart
Intertek (Switzerland) AG, Schlieren
Switzerland
1. Introduction
Fossil fuel repository is decreasing worldwide very quickly and finding new sources
becomes more and more difficult. Experts are expecting that the fossil fuel will end in a
few decades. This is the reason for researchers to find alternatives. Many technical
improvements have already been made for car engines and also many developments have
been made in the area of fuel. FAME (fatty acid methyl esters) was found as an equivalent
fuel to diesel. It is also known as “Biodiesel”. In Europe, it is mostly prepared from rape,
palm or soy oil. In the process of biodiesel production, the glyceride bondages are broken
and methyl esters of the long chained fatty acids are formed (FAME = fatty acid methyl
ester). In recent years, car engines have been developed, which run with both fossil diesel
and FAME.
At a time of growing globalisation and increasing financial pressure on logistics and
transport companies, cross contamination is an increasing issue. It needs extensive actions
to clean a tank or a truck after having loaded FAME. Very often, traces of FAME can be
found in other fuels. This was the reason, why a limit for FAME in Jet A-1 fuel needed to
be defined and was set at 5 ppm (mg/kg) for aircrafts (Ministry of Defence (2008).
Defence Standard 91-91 and Joint Inspection Group (2011). Aviation Fuel Quality
Requirements for Jointly operated System (AFQRJOS) Bulletin No. 45).
As diesel and FAME are used in one and the same engine, one would think that cross
contamination is not critical. This is correct for car drivers. However, it is well known that
FAME cannot be stored for more than a couple of years. The reason for this is it’s
hydroscopic properties and it is also a very good alimentary for fungi.
Pure fossil diesel can be stored for decades without any problems. However, when fossil diesel
is stored over several years, containing small quantities of FAME, fungi growth starts quickly
and the characteristics of the diesel can change drastically. First, the odour of such
contaminated diesel changes, second, FAME causes sticky deposits with water on the bottom
of the containers and tanks, and third, fungi which grow in the fuel cause filter clogging.
A method was developed for sample preparation and quantification of FAME in diesel.
There is a difficulty when diesel or heating oil is analysed using a gas chromatograph
connected to a mass spectrometer (GC-MS). A diesel sample contains compounds, which
evaporate at high temperature. The temperature limit for the analysis using GC-MS is given
by the chromatographic column. As it was found that HP-Innowax
1
shows the best
1
HP-Innowax 50m, I.D. 0.200mm, Film 0.40 µm (by Agilent J&W); as an alternative column the
following can be used: TBR-WAX 50m, I.D. 0.200mm, Film 0.40 µm (by Teknokroma)
Biodiesel – Quality, Emissions and By-Products
90
separation for FAME and the temperature limit of this column is 260°C, a solution to
separate the high volatile compounds from the diesel and heating oil sample needed to be
found. The highly volatile compounds, as they are found in diesel, would contaminate a
GC-MS injector in standard application rapidly, and cleaning would be needed too
frequently. A solid phase extraction was found to be a solution for extracting FAME from
diesel or heating oil samples.
2. Preparation of standards and samples
2.1 Preparation of standards
6 fatty acid methyl esters (FAME) were used to prepare the standards. The selection of these
6 FAME was already published earlier (Institute of Petroleum (2009). Norm draft document
IP PM-DY/09). These are: methyl palmiate (C16:0), methyl margarate (C17:0), methyl
stearate (C18:0), methyl oleate (C18:1), methyl linoleate (C18:2), and methyl linolenate
(C18:3). A stock solution was prepared of approximately 50 mg of each FAME dissolved in
50 g Jet A-1
2
. From this stock solution, standard dilutions were prepared at the following
concentration levels: 0.1, 0.5, 1.2, 3.0, 5.0, 12, 50, and 100 mg/kg (ppm) of each fatty acid
methyl ester (FAME).
2.2 Preparation of samples
FAME free diesel and heating oil samples were used for the preparation of the samples. For
the method development, they were fortified by the same stock solution as used for the
preparation of standards as described above. The fortified samples were prepared at the
following levels: 0.2, 2.0, 10, and 100 mg/kg of each FAME.
Later, natural mixture of FAME was used for fortification. The levels of total FAME were
1.20, 7.55, and 115 mg/kg.
3. Sample treatment
Highly volatile compounds, as they are found in diesel, contaminate a GC-MS injector when
used with a HP-Innowax
3
column due to temperature limits.
3.1 Solid phase extraction
The solid phase extraction cartridge (SPE) which was found to fit the best, is a Strata SI-1
Silica (55 µm, 70A)
4
. A 12-port vacuum manifold by Supelco connected to a small vacuum
pump was used for the SPE sample preparation.
3.1.1 SPE column washing and conditioning
The SPE cartridges were pre-washed with approximately 10 mL diethyl ether at a speed
of approximately 2 drops per second. Right after all the diethyl ether had passed the
column, it was conditioned with 10 mL n-hexane at the same flow speed. Thereafter the
2
When using Jet A-1 as a solvent, it needs to be checked to be free of FAME. Other solvents such as
octane or dodecane can be used as well. It is essential, that the same solvent is used for the preparation
of standards as used for the sample dilution as described in section 3.1.3.
3
See footnote 1
4
Strata SI-1 Silica (55 µm, 70A), 1000 mg/6 mL Part Number 8B-S012-JHC by Phenomenex.
Analysis of FAME in Diesel and Heating Oil
91
SPE cartridge was dried by vacuum for approximately 30 to 60 seconds. Then, the
vacuum was stopped and the sample was applied. Both solvents, diethyl ether and n-
hexane, were discarded.
3.1.2 Application of the sample
1 mL of the diesel sample or heating oil sample was passed through the cartridge at a speed
of 1 drop per second. Thereafter, the diesel residue of the sample on the SPE cartridge was
washed using 10 mL n-hexane. Also here, the n-Hexane from washing was discarded as
well as the diesel sample which passed the column.
3.1.3 Elution and further treatment of the sample
After the n-hexane passed the SPE cartridge, it was dried for approximately 1 minute by
vacuum. Thereafter, the vacuum was stopped and the adsorbed FAME were eluted with 10
mL of diethyl ether at a speed of 1 drop per second into a test tube.
The diethyl ether was evaporated by a gentle stream of nitrogen blown via a glass pipette
into the test tube. Thereafter, the sample was diluted in 1 mL of FAME free Jet A-1 fuel
5
.
The walls of the test tube were washed with a pipette and all of the solution was
transferred into a sample vial as quantitatively as possible, closed with a crimped lid and
analysed using GC-MS.
4. Analytical method
The analytical method is very similar to the one described in Literature (Institute of
Petroleum (2009). Norm draft document IP PM-DY/09 and IP 585/10). However, the
measuring range was extended down to 0.1 mg/kg for each FAME as the lowest standard.
The preparation of standards was thus modified in terms of solvent and calibration levels.
For maximum precision, the calibration curve was split into two segments as described in
section 5 of this chapter.
4.1 Instrumentation
A gas chromatograph (Trace GC Ultra) connected to a mass spectrometer (DSQ II) by
Thermo Scientific was used as GC-MS System.
4.1.1 GC method
Injector: PTV
Injection: Split
Split Flow: 20 mL/minute
Injection volume: 1.0 µL
Injector temperature: 260°C
Carrier gas: Helium
Analytical column: HP-Innowax 50m, I.D. 0.200mm, Film 0.40 µm (by
Agilent J&W)
5
When using Jet A-1 as a solvent, it needs to be checked whether the solvent is really free of FAME.
Other solvents such
as octane or dodecane can be used as well. It is essential, that the same solvent is
used for the sample dilution as used for the preparation of standards as described in section 2.1.
Biodiesel – Quality, Emissions and By-Products
92
Oven temperature:
Start temperature: 150°C (for 5 minutes)
Heating rate: 17°C/minute up to 200°C, hold time for 17 minutes,
thereafter with 3°C/minute up to 252°C
End temperature: 252°C (isotherm for 3 minute)
4.1.2 MS method
Measuring mode: Selected Ion Monitoring (SIM)
Measuring ranges: 20.00 – 27.69 minutes: SIM of 227, 239, 270, 271 Da
27.70 – 33.49 minutes: SIM of 241, 253, 284 Da
33.50 – 35.99 minutes: SIM of 255, 267, 298 Da
36.00 – 37.29 minutes: SIM of 264, 265, 296 Da
37.30 – 39.49 minutes: SIM of 262, 263, 264, 295 Da
39.50 minutes to end of run: SIM of 236, 263, 292, 293 Da
Polarity: positive
Detector voltage: 1518V
Software used: Xcalibur Version 2.0.7, QuanBrowser Version 2.0.7, and
QualBrowser Version 2.0.7
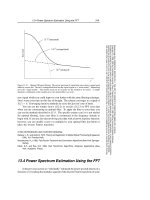
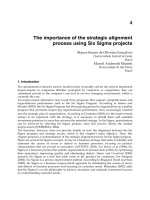
5. Results
The standard measurement showed that it is not possible to calculate one calibration curve
over the entire concentration range. Therefore, two calibration curves were created: one for
the high concentration range, approximately 5 – 100 mg/kg of each FAME and a second for
the range of 0.1 to 5.0 mg/kg of each FAME. An example of the high range calibration curve
is shown in Figure 1 and the low concentration range is depicted in Figure 2.
Fig. 1. Calibration curve for Methyl linolenate in high concentration range.
For each of the 6 FAME, a set of two calibration curves were calculated. Figure 3 shows the
main section of the chromatograms of the standards. The depicted concentrations are 0.1,
Analysis of FAME in Diesel and Heating Oil
93
0.5, 1.2, and 3.5 mg/kg for each FAME. The signal at approximately 26.6 minutes
corresponds to methyl palmiate (C16:0), at 31.4 minutes to methyl margarate (C17:0), at 35.7
minutes to methyl stearate (C18:0), at 36.7 minutes to methyl oleate (C18:1), at 38.6 minutes
to methyl linoleate (C18:2), and at 41.1 minutes to methyl linolenate (C18:3).
Fig. 2. Calibration curve for Methyl linolenate in low concentration range.
The expected retention time ranges are shown in Table 1 as they were also listed in the
literature (Institute of Petroleum (2009). Norm draft document IP PM-DY/09 and in
Purghart V. & Jaeckle H (2010). What Damage Can Biodiesel Cause to Jet Fuel? Chimia,
Volume 64, No 3, Highlights of Analytical Chemistry in Switzerland). In the present study,
slightly longer retention times were observed.
Species to be detected
Significant SIM masses
[Da]
Expected
retention time
[minutes]
Methyl-palmitate C16:0 227, 239, 270, 271 24.9 – 26.4
Methyl-margarate C17:0 241, 253, 284 30.1 – 31.4
Methyl-stearate C18:0 255, 267, 298 34.7 – 35.5
Methyl-oleate C18:1 264, 265, 296 35.5 – 36.5
Methyl-linoleate C18:2 262, 263, 264, 294, 295 37.7 – 38.6
Methyl-linolenate C18:3 236, 263, 292, 293 40.3 – 41.1
Table 1. List of fatty acid methyl esters used as standards with the masses used for SIM
detection and the approximately expected retention time ranges.
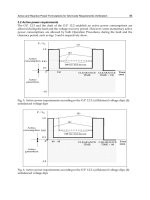
An example chromatogram of a fortified heating oil sample at a level of 2.0 mg/kg of each
FAME is shown in Figure 4, the chromatogram of the one fortified at a level of 100 mg/kg of
each FAME is shown in Figure 5.
A quantification of all signals is summarized in Table 2. The fortification levels were chosen
to show the robustness of the method and also to cover both calibration curves with two
Biodiesel – Quality, Emissions and By-Products
94
samples each. The fortification levels were defined as concentration of each of the 6 FAME,
e.g. a fortification level of 100 mg/kg results in a total FAME concentration of 600 mg/kg as
6 FAME are considered. In later examples, fortification using natural FAME will be
described. The concentration there will be given as total FAME, where the sum of 6
components is the number of interest.
As it was shown that reasonable recovery was found for each level of the fortified heating
oil, samples of fortified diesel were prepared. However, if a cross contamination in a storage
container or a truck occurs, then the detected signals of each fame would correspond to the
FAME mixture as it comes from soy oil, rape oil, palm oil or similar. Therefore, diesel
samples were prepared with natural fatty acid methyl ester mixture as commercially
available. The fortification levels of total FAME were 1.20, 7.55, and 114.5 mg/kg.
An example chromatogram of a fortified diesel sample at a level of 7.55 mg/kg of total
FAME is shown in Figure 6, the chromatogram of one fortified at a level of 115 mg/kg of
total FAME is shown in Figure 7.
C:\XCALIBUR\ \FAME in Diesel\Std4-01 15.12.2009 07:31:21
Std 3 ppm
RT: 19.61 - 45.31
20 25 30 35 40 45
Time (min)
0
50
100
0
50
100
0
50
100
Relative Abundance
0
50
100
24.78
21.19
35.7426.61
31.40
33.11
36.7130.96
43.5442.41
35.73
31.39
26.59
36.72
24.76
38.6221.19
26.86
41.12
33.31
35.71
31.38
26.58
36.69
38.59
24.75 41.07
21.15
26.86
33.29 45.24
30.70
35.72
31.39
26.59
36.70
38.59
41.08
24.74
21.17
27.68
33.46 44.53
30.65
NL:
1.20E6
TIC MS
std1-01
NL:
1.20E6
TIC MS
std2-01
NL:
1.20E6
TIC MS
std3-01
NL:
1.20E6
TIC MS
Std4-01
Fig. 3. Chromatograms of the standards at low concentrations i.e. 0.1, 0.5, 1.2, and 3.5 mg/kg
for each FAME.
The signal at 26.56 minutes corresponds to methyl palmiate (C16:0), the signal at 35.70
minutes to methyl stearate (C18:0), the signal at 36.72 minutes to methyl oleate (C18:1),
the signal at 38.59 minutes to methyl linoleate (C18:2), and the signal at 41.06 minutes
Analysis of FAME in Diesel and Heating Oil
95
corresponds to methyl linolenate (C18:3). There is no signal at approximately 31.4
minutes, which would correspond to methyl margarate (C17:0). Generally, methyl
margarate is not or only very rarely at very low concentrations present in FAME prepared
from rape, palm or soy oil.
C:\XCALIBUR\ \FAME_in_Heizöl_2_ppm-1 17.12.2009 15:47:21
Heizöl spiked with 2 ppm FAME
RT: 19.52 - 45.30
20 22 24 26 28 30 32 34 36 38 40 42 44
Time (mi n)
0
10
20
30
40
50
60
70
80
90
100
Relative Abundance
36.70
38.59
35.72
31.40
40.72
42.42
43.77
26.60
39.04
37.89
34.97
34.25
30.6525.07
27.02
23.71
23.22
NL:
2.37E6
TIC MS
FAME_in_
Heizöl_2_p
pm-1
Fig. 4. Chromatogram of a fortified heating oil sample at a level of 2.0 mg/kg of each FAME.
C:\XCALIBUR\ \FAME_in_Heizöl_100_ppm-1 17.12.2009 19:10:02
Heizöl spiked with 100 ppm FAME
RT: 19.52 - 45.30
20 22 24 26 28 30 32 34 36 38 40 42 44
Time (min)
0
10
20
30
40
50
60
70
80
90
100
Relative Abundance
35.80
31.48
26.68
36.78
38.66
41.12
43.05
40.74
37.90
35.01
31.91
27.04 29.9023.73 25.0720.53 22.86
NL:
4.68E7
TIC MS
FAME_in_
Heizöl_100
_ppm-1
Fig. 5. Chromatogram of a fortified heating oil sample at a level of 100 mg/kg of each
FAME.
Biodiesel – Quality, Emissions and By-Products
96
Fortified
level
[mg/kg]
Methyl
palmiate
[mg/kg]
Methyl
marganate
[mg/kg]
Methyl
stearate
[mg/kg]
Methyl
oleate
[mg/kg]
Methyl
linoleate
[mg/kg]
Methyl
linolenate
[mg/kg]
Sum
[mg/kg]
0.0 0.01 0.00 -0.02 -0.03 0.02 0.08 0.05
0.0 0.01 0.00 -0.02 0.01 0.00 0.03 0.03
0.2 0.19 0.16 0.19 0.24 0.21 0.20 1.19
0.2 0.18 0.17 0.19 0.23 0.24 0.22 1.22
2.0 1.98 2.10 1.95 1.84 2.09 2.02 11.99
2.0 1.99 2.10 1.90 2.06 2.07 1.83 11.94
10.0 9.62 11.16 9.24 9.62 9.90 10.60 60.13
10.0 9.22 10.38 9.76 9.73 9.25 10.39 58.74
100.0 104.73 103.53 94.62 99.78 102.70 105.42 610.78
100.0 104.72 102.92 94.60 99.15 100.97 101.48 603.84
Table 2. Summary of fortified heating oil samples at various levels. Each fortification level
contains approximately the same amount of each FAME.
c:\xcalibur\ \diesel spiked 7.55 ppm 16.12.2009 19:58:49
73979
RT: 19.52 - 45.30
20 22 24 26 28 30 32 34 36 38 40 42 44
Time (min)
0
10
20
30
40
50
60
70
80
90
100
Relative Abundance
36.68
42.45
43.50
43.64
38.57
41.02
40.70
38.12
26.56
35.69
23.68
25.01
21.00
26.98
34.20
32.0729.8427.24
23.18
NL:
8.61E5
TIC MS
diesel
spiked
7.55 ppm
Fig. 6. Chromatogram of a fortified Diesel sample at a level of 7.55 mg/kg of total FAME.
A quantification of all signals of the fortified diesel samples is summarized in the following
Table (Table 3).
Analysis of FAME in Diesel and Heating Oil
97
C:\Xcalibur\ \Diesel spik ed 115 ppm 16.12.2009 21:40:18
73981
RT: 19.67 - 45.29
20 22 24 26 28 30 32 34 36 38 40 42 44
Time (min)
0
10
20
30
40
50
60
70
80
90
100
Relative Abundance
36.72
38.59
26.56
35.70
36.96
41.06
44.11
42.33
40.76
23.67
34.2025.01
26.98 31.36
21.00 29.85
NL:
1.60E7
TIC MS
Diesel
spiked 115
ppm
Fig. 7. Chromatogram of a fortified Diesel sample at a level of 115 mg/kg of total FAME.
Fortified
level
[mg/kg]
Methyl
palmiate
[mg/kg]
Methyl
marganate
[mg/kg]
Methyl
stearate
[mg/kg]
Methyl
oleate
[mg/kg]
Methyl
linoleate
[mg/kg]
Methyl
linolenate
[mg/kg]
Sum
[mg/kg]
1.20 0.11 0.02 0.15 0.30 0.21 0.12 1.01
1.20 0.11 0.04 0.14 0.25 0.23 0.18 1.06
7.55 0.57 0.10 0.42 2.88 1.17 2.43 7.57
7.55 0.57 0.09 0.42 2.91 1.19 2.25 7.43
115 10.88 0.22 3.20 59.66 32.27 7.94 114.19
115 11.14 0.22 3.23 59.09 32.69 8.46 114.83
Table 3. Summary of fortified diesel samples at various levels. Each fortification level
contains the sum of FAME listed in the table.
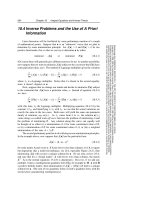
6. Conclusion
The presented analytical method for low concentration of FAME in diesel and heating oil
was shown to be robust and sensitive down to low ppm level. The range of quantification
was extended down to 0.1 mg/kg of each FAME. The robustness of the solid phase
extraction was shown in the range of 1.2 to 600 mg/kg FAME in total. This results in a
maximum total load of 600 µg FAME on the SPE cartridge.
7. References
Institute of Petroleum (2009). Norm draft document IP PM-DY/09
Institute of Petroleum (2010). Norm IP585/10
Biodiesel – Quality, Emissions and By-Products
98
Joint Inspection Group (2011). Aviation Fuel Quality Requirements for Jointly operated
System (AFQRJOS). Bulletin No. 45
Ministry of Defence (2008). Defence Standard 91-91
Purghart V. & Jaeckle H (March 2010). What Damage Can Biodiesel Cause to Jet Fuel?
Chimia, Volume 64, No 3, Highlights of Analytical Chemistry in Switzerland
7
Analytical Methodology for the Determination
of Trace Metals in Biodiesel
Fabiana A. Lobo
1
, Danielle Goveia
2
,
Leonardo F. Fraceto
2
and André H. Rosa
2
1
UFOP - Universidade Federal de Ouro Preto
2
UNESP - Universidade Estadual Paulista
Brazil
1. Introduction
The demand for energy resources by various systems such as production and
transportation, as well as for physical comfort continues to grow apace, intensifying global
dependence on fossil fuels and their derivatives. For this reason, numerous private and
public programs in several countries have established feasible alternatives for the
substitution of petroleum derivatives (Sahin, 2011; Saint´Pierre et al., 2003). These
alternatives are aimed at reducing dependence on imported and non-renewable energy,
mitigating some of the environmental impacts caused by petroleum derivatives, and
developing alternative technologies in the area of energy
(Oliveira et al., 2002).
Biodiesel has emerged as a promising alternative to petroleum, firstly because it promotes a
qualitative and quantitative reduction of the emission of various air pollutants (Agarwai,
2005; López et al., 2005; Ilkilic Behcet, 2010; Silva, 2010;) and secondly, as a strategic
source of renewable energy to substitute diesel oil and other petroleum derivatives (Chaves
et al., 2008; Jesus et al., 2008).
Biodiesel, also known as vegetable diesel, is a fuel obtained from renewable sources, such as
vegetable oils and animal fats, by means of chemical processes such as transesterification,
esterification and thermal cracking (Chaves et al., 2010, Oliveira et al., 2009, Jesus et al., 2010;
Arzamendi et al., 2008; Canakci et al., 1999; Meher et al., 2006).
In chemical terms, biodiesel is defined as a mono-alkyl ester of long-chain fatty acids with
physicochemical characteristics similar to those of mineral diesel. Because it is perfectly
miscible and physicochemically similar to mineral diesel oil, biodiesel can be used pure or
mixed in any proportions with other solvents in diesel cycle engines without the need for
substantial or expensive adaptations (Ma Hanna, 1999; Woods Fryer, 2007). The
literature highlights several important characteristics of biodiesel: (a) its market price is still
relatively high when compared with that of conventional diesel fuel; (b) its content of sulfur
and aromatic compounds is lower; (c) its average oxygen content is approximately 11%; (d)
its viscosity and flashpoint are higher than those of conventional diesel; (e) it has a specific
market niche directly associated with agricultural activities; and lastly, (f) in the case of
biodiesel from used frying oil, it has strong environmental appeal (Nigam et al., 2011). The
qualitative and quantitative reduction in the emissions of various air pollutants such as
sulfur, particulate material, and particularly carbon, point to biodiesel as a promising
Biodiesel – Quality, Emissions and By-Products
100
alternative to reduce the deleterious effects of petroleum and its derivatives. However, some
studies are contradictory about the concentrations of NO
x
emissions, with some of them
reporting a reduction in emissions, while others report marginally higher emissions than
those of mineral diesel (Coronado, 2010; Costa-Neto et al., 2000; Ferrari et al., 2005; López et
al., 2005; Ramadhas et al., 2004).
However, it is nigh impossible for any chemical reaction to be complete, including
transesterification, and therefore the products of a reaction (alky esters) are usually
contaminated with other compounds. Among metals, the ones most strongly controlled are
Na and K because their hydroxides are used as catalysts. These elements, which may be
present as solid abrasives or as soluble soaps, can clog various mechanical parts of a vehicle
(Pohl, 2010; Chaves et al., 2008; Jesus et al., 2008). In addition, other inorganic contaminants
(such as Cu, Pb, Cd, Zn, Ni, etc.) may be present in biodiesel samples due to the plant‘s (raw
material) absorption of metals from soil, and/or be incorporated during the production and
storage process (Lobo et al., 2009; Lobo et al., 2011; Tagliabue et al., 2006).
The quantitative monitoring of metallic elements in fuel samples is of supreme importance in
economic terms, not only for the fuel industry but also in various other sectors of industry and
services. One of the most important applications is the determination of the total concentration
or the monitoring of variations in concentration over time of certain metallic and semi-metallic
elements. This type of analysis is crucial for maintaining quality control (Chaves et al., 2010;
Jesus et al., 2010; Garcia et al., 1999). One of the most relevant aspects to consider is the
phenomenon of corrosion in the combustion chamber of automotive engines, which is caused
by high temperatures and by the fuels themselves (Amorim et al., 2007; Jesus et al., 2008;
Haseeb et al., 2010; Saint´Pierre et al., 2006). The deactivation of catalysts through poisoning,
incrustation or solid-state transformations, which lead to reduced selectivity and loss of
catalytic activity, may also result in economic losses and environmental impacts (Figueiredo
Ribeiro, 1987; Meeravali Kumar, 2001; Saint´Pierre et al., 2004).
The quality of fuels supplied to the consumer, from their production to their distribution
points, can be managed by means of the efficient analytical control of incidental or
accidental inorganic additives (Oliveira et al., 2002).
The metal content in fuels, which is usually low, requires the use of adequate sample preparation
procedures and sensitive analytical techniques (Lobo et al., 2011). Atomic absorption
spectrometry (AAS) can be employed for the quantitative determination of many elements
(metals and semi-metals) in a variety of foods and in biological, environmental, geological and
other types of samples. The AAA technique is widely applied for the determination of different
elements (about 70) due not only to its robustness but also its sensitivity to detect trace elements
in the order of µg L
-1
or even ng L
-1
with high accuracy and precision. The principle of the
technique is based on the absorption of electromagnetic radiation from a radiation source by
gaseous atoms in the fundamental state. The process of formation of gaseous atoms in the
fundamental state, called atomization, can be obtained via flame, electrothermal heating, or by a
specific chemical reaction such as Hg cold-vapor generation.
Graphite furnace atomic absorption spectrometry (GFAAS) with electrothermal atomization
is widely used in routine analyses due to several factors. It requires small volumes of
sample, the atomizer acts as a chemical reactor, excellent limits of detection are attained
after separation of the analyte and matrix in the reactor, it requires no previous
decomposition of the sample (direct analysis), it is multielemental, fast, relatively
inexpensive, simple spectrum, and provides chemical and thermal pretreatment of the
sample, among other advantages (Welz et al., 1992; Jackson, 1999).
Analytical Methodology for the Determination of Trace Metals in Biodiesel
101
The optimization of experimental conditions in GFAAS (chemical modifiers, sample
preparation, pyrolysis temperature and atomization) normally requires numerous time-
consuming and expensive experiments. However, using factorial planning enables one
to extract the maximum possible amount of useful information from a given system
with a minimum number of experiments. When univariate optimization is employed, it
is often impossible to detect interactions among the variables under study. In addition
to this problem, the number of experiments performed is usually higher when
compared with those obtained through factorial design (Pereira-Filho et al., 2002;
Amorim et al., 2006).
The objective of this work was to use 2
4
factorial design for the optimization of experiments
for the determination of metals (Cu, Cd, Zn, Ni and Pb) by GFAAS in biodiesel samples,
using different sample preparation procedures and different chemical modifiers. The
chemical modifiers used were a mixture of Pd + Mg and the W permanent modifier, and the
samples were prepared by microemulsion and focused microwave digestion. The
advantages of applying factorial design to carry out the experiments and to determine the
optimal conditions of pyrolysis and atomization temperatures are discussed.
2. Experimental procedures
2.1 Instruments and accessories
The instruments used in this study were a Zeeman electrothermal atomic absorption
spectrometer (Varian, model Spectra AA240Z) equipped with an autosampler (Varian,
model PSD 120) coupled to a Dell PC. The spectrometer’s graphite tubes were designed with
an integrated platform; Varian hollow cathode lamps (= 283.3 nm, bandwidth 0.5 nm for
Pb; = 327.4 nm, bandwidth 0.5 nm for Cu; = 232.0 nm, bandwidth 0.2 nm for Ni = 228.8
nm and bandwidth 0.5 nm for Cd). The experimental setup included a Milli-Q Plus water
deionizer system (Millipore
®
); automatic micropipettes of different volumes (fixed and
variable); a Sartorius 2432 analytical balance with maximum capacity of 200 g; disposable
polyethylene tubes (Corning); focused microwaves – Rapid Digestion system – SPEX. The
purge gas was argon 99.9% (White Martins, Brazil). All the measurements were based on
integrated absorbance.
2.2 Reagents, solutions and samples
All the solutions were prepared with high purity deionized water (18.2 MΩ.cm) purified in
a deionizer system (Milli-Q Plus, Millipore
®
). Nitric acid (Synth-65% v/v) was used after
sub-boiling of the reference analytical solutions and samples. Fresh analytical solutions of
the analytes were prepared each day using 1000 mg L
-1
of
stock solutions (Normex
®
, Carlo
Erba) in 1.0% (v/v) distilled HNO
3
, Triton X-100 (Tedia), Hydrogen Peroxide (Synth – PA,
29-30% (v/v)), and Vanadium Pentoxide (Riedel-99.5% m/m). The samples biodiesel were
obtained from biodiesel research laboratories in Curitiba (state of Paraná) and Cuiabá (state
of Mato Grosso) and from a commercial gas station in Sorocaba (state of São Paulo).
According to the biodiesel suppliers, all the samples were obtained by transesterification
with ethanol, using NaOH as catalyst. Unfortunately, no additional information was
supplied for sample B10 (10% v/v of biodiesel in diesel), which was obtained from the gas
station in Sorocaba. Table 1 lists the characteristics of the samples and their respective
designations.
Biodiesel – Quality, Emissions and By-Products
102
Samples Origin
A
1
Soybean
A
2
Soybean
A
3
Pure animal fat
(bovine grease)
A
4
Unwashed animal fat
(grease mixtures)
A
5
Washed animal fat
A
6
Sunflower
A
7
Cotton
A
8
10% biodiesel in diesel (B10)
Table 1. Analyzed biodiesel samples and their origins
2.3 Preparation of the chemical modifier
A solution of 1000 mg L
-1
of the Pd (NO
3
)
2
chemical modifier was prepared using a 10000 mg
L
-1
stock solution of Pd(NO
3
)
2
in 15% HNO
3
(Perkin-Elmer, Part Nº BO190635). A solution of
1000 mg L
-1
of the Mg(NO
3
)
2
chemical modifier was prepared using a 10000 mg L
-1
stock
solution of Mg(NO
3
)
2
(Perkin-Elmer, Part Nº BO190634). The Pd + Mg mixture used as
chemical modifier was prepared with 5 µL of a 1000 mg L
-1
Pd(NO
3
)
2
solution + 3 µL of a
1000 mg L
-1
Mg(NO
3
)
2
solution.
The solution of 1.0 g L
-1
of W was prepared by dissolving 0.1794 g of NaWO
4
.2H
2
O (Merck)
in 100 mL of deionized water. The atomizer was coated with the W permanent modifier in
two steps: i) tungsten deposition, ii) thermal treatment of the tungsten deposited in the tube.
Table 2 describes the heating program for this coating procedure.
Steps Actions and Parameters
Deposition of W
1
Introduction of 50 L of a 1.0 g L
-1
W solution into the atomizer
2
Heating program (ramp, hold) for drying and pyrolysis: 120
o
C
(5, 25s); 150
o
C (10, 60s); 600
o
C (20, 15s) and 1000
o
C (10, 15s)
3
Steps 1 and 2 were repeated three times
4
Step 1 was repeated, followed by the heating program (ramp,
hold): 120
o
C (5, 25s); 150
o
C (10, 60s); 600
o
C (20, 15s), 1000
o
C (10,
15s), 1400
o
C (10, 5s), 2000
o
C (3, 2s) and 2100
o
C (1, 1s)
Thermal treatment of W
5
The heating program was repeated four times to condition the W
carbide to the average temperature (ramp, hold): 150
o
C (1, 10s),
600
o
C (10, 15s), 1100
o
C (10, 5s), and 1400
C (10, 10s)
6
The heatin
g
pro
g
ram was repeated four times to condition the W
carbide to high temperatures: 150
o
C (1, 10s), 600
o
C (10, 15s),
1100
o
C (10, 5s), 1400
o
C (10, 10s), 1500
o
C (3, 5s), 1600
o
C (1, 1s),
1700
o
C (1, 1s), 1800
o
C (1, 1s), 1900
o
C (1, 1s) and 2000
o
C (1, 1s)
Table 2. Sequence of the coating program of the atomizer with the W permanent chemical
modifier (Oliveira et al., 2002)
Analytical Methodology for the Determination of Trace Metals in Biodiesel
103
2.4 Preparation of samples
The samples were prepared by two procedures:
a. Microemulsion: Prepared in 50.0 mL volumetric flasks by mixing 0.5 g of biodiesel and
5 g of surfactant (Triton X-100) and completing the volume with HNO
3 dist.
1% (v/v)
under stirring for 20 min (Lobo et al., 2009).
b. Wet digestion: The procedure was carried out as described by Bettinelli et al. (1996), by
weighing approximately 0.5 g of biodiesel, 18 mL of concentrated HNO
3 dist,
and 12 mL
of H
2
O
2
and V
2
O
5
catalyst. The mixture was allowed to rest for 24 h, after which it was
processed in a focused microwave system (Rapid digestion System SPEX) for 1 hour
(Liu et al., 1995). The procedure resulted in efficient and complete digestion, yielding a
clear transparent solution. After this step, the volume was adjusted to 50.0 mL volume
with distilled HNO
3
1.0% (v/v).
2.5 Study of the electrothermal behavior
To evaluate the thermal behavior of the elements, pyrolysis and atomization temperature
curves were built and the transient absorption signals were also analyzed. Table 3 describes
the heating program applied here.
Steps
Temperature
(ºC)
Time (s)
(Ramp; hold)
Gas Flow
(mL min
-1
)
1 85 5.0 300 (Ar)
2 95 40.0 300(Ar)
3 120 10.0 300(Ar)
4 * 5.0, 3.0 300(Ar)
5 ** 1.0, 4.0 0 (read)
6 2250 1.0, 5.0 300(Ar)
* Pyrolysis temperature (Tp); ** Atomization temperature (Ta)
Table 3. Heating program of the graphite tube atomizer
2.5.1 Study of the electrothermal behavior to evaluate atomization and pyrolysis
temperatures based on a univariate procedure
The optimal temperature was established, and only the pyrolysis temperature was varied.
After the optimal pyrolysis temperature was defined, the atomization temperature was
varied. The pyrolysis and atomization curves were obtained with 25 µg L
-1
(because, in the
optimization of the experiments, this concentration fell within the linear range of the
calibration curve) of Cu, Pb, Ni and Cd in the presence of two modifiers (W and Pd + Mg)
for the two sample preparation procedures (microemulsion and wet digestion in a focused
microwave system).
2.5.2 Use of experimental design to optimize pyrolysis and atomization curves
In the process of pyrolysis and atomization temperatures, a 2
4
factorial design was used for
Cu, Pb, Ni and Cd, which involved 16 assays for each analyte, as described in Tables 4 and
5. This factorial design involved two levels, one for the lowest (-1) and the other for the
highest (+1) temperatures, for two variables (pyrolysis and atomization temperatures), two
levels for the type of sample pretreatment procedure, digestion (-1) and microemulsion (+1),
Biodiesel – Quality, Emissions and By-Products
104
and two levels for the type of modifier, Pd + Mg (-1) and W (+1). It should be noted that the
experiments were carried out randomly to avoid systemic errors.
Factors Levels
Low (-1) High (+1)
Pyrolysis temperatures,
º
C * *
Atomization temperatures,
º
C * *
Sample preparation Wet digestion Microemulsion
Modifiers Pd + Mg W
* The pyrolysis (Tp) and atomization (Ta) temperatures at the lowest level (-1) were 100°C below the
values recommended by the manufacturer, while the temperatures at the highest level (1) were 100°C
above the values recommended by the manufacturer. The values recommended by the manufacturer
were: Pb- Tp-600ºC; Ta- 2400 ºC; Cu- Tp-900 ºC; Ta-2300 ºC ; Ni- Tp-900ºC; Ta-2400ºC and Cd- Tp-300ºC;
Ta- 1800 ºC.
Table 4. Factors and levels used in the experimental factorial design
Pyrolysis and atomization curves were obtained for 25 µg L
-1
of Cu, Pb, Ni and Cd in the
presence of two modifiers, W and Pd + Mg, for both sample preparation procedures. A new
factorial procedure was developed for Cd. A 2
2
factorial design involving 4 assays was
developed, as described in Table 4. This factorial design involved two levels relating to the
lowest (-1) and highest (+1) temperatures for the two variables (pyrolysis and atomization
temperatures). The samples were prepared by microwave digestion using the Pd + Mg
chemical modifier.
Experiments Sample preparation
Pyrolysis
Temperature
Atomization
Temperature
Modifier
1 Wet Digestion -1 -1 -1 Pd + Mg -1
2 Microemulsion 1 -1 -1 Pd + Mg -1
3 Wet Digestion -1 1 -1 Pd + Mg -1
4 Microemulsion 1 1 -1 Pd + Mg -1
5 Wet Digestion -1 -1 1 Pd + Mg -1
6 Microemulsion 1 -1 1 Pd + Mg -1
7 Wet Digestion -1 1 1 Pd + Mg -1
8 Microemulsion 1 1 1 Pd + Mg -1
9 Wet Digestion -1 -1 -1 W 1
10 Microemulsion 1 -1 -1 W 1
11 Wet Digestion -1 1 -1 W 1
12 Microemulsion 1 1 -1 W 1
13 Wet Digestion -1 -1 1 W 1
14 Microemulsion 1 -1 1 W 1
15 Wet Digestion -1 1 1 W 1
16 Microemulsion 1 1 1 W 1
Table 5. First factorial design for the optimization of pyrolysis and atomization
Analytical Methodology for the Determination of Trace Metals in Biodiesel
105
2.6 Determination of metals by the calibration procedure using the analyte addition
method
Based on the results obtained with the experimental design, the methods were optimized
using the two sample preparation procedures (Lobo et al., 2009, 2011).
The analyte addition method consists of adding volumes of solutions with known
concentrations of analyte to the sample. This method is especially suitable when the
composition of the sample is unknown or complex, as is the case of biodiesel samples. Thus,
aiming to minimize interferences (since the standards and the sample had the same
composition and physical properties), the analyte was quantified even when present in low
concentrations, to ensure that the measures of the analytic signals would fall within a
suitable interval for the technique (Harris, 2001) in the two different sample preparation
procedures.
For each microemulsified sample, four standards were prepared containing different
concentrations of added Cd and Ni, as shown in Table 6 (the concentration interval was
used based on the manufacturer’s handbook).
Flask Va* (mL)
[Cd]
added
g L
-1
[Ni] added
g L
-1
Final volume
(mL)
1 1.0 0 0 10.0
2 1.0 0.5 5.0 10.0
3 1.0 1.0 10.0 10.0
4 1.0 1.5 15.0 10.0
*Va – volume of sample added in the form of microemulsion.
Table 6. Preparation of the monoelemental standards using the analyte addition method for
the microemulsified samples
For each digested sample, four standards were prepared containing different concentrations
of added Cu, Pb, Cd and Ni, as shown in Table 7 (the concentration interval was used based
on the manufacturer’s handbook).
Flask
Va*
(mL)
[Cu]
added
g L
-1
[Pb]
added
g L
-1
[Ni]
added
g L
-1
[Cd]
added
g L
-1
Final
volume
(mL)
1 1.0 0 0 0 0 10.0
2 1.0 5.0 15.0 5.0 0.5 10.0
3 1.0 10.0 30.0 10.0 1.0 10.0
4 1.0 15.0 45.0 15.0 1.5 10.0
*Va – volume of focused microwave digested sample
Table 7. Preparation of the monoelemental standards using the analyte addition method for the
digested samples
Biodiesel – Quality, Emissions and By-Products
106
2.7 Analytical characteristics
The analytical characteristics of the procedures developed with the limit of detection (LOD),
limit of quantification (LOQ), estimated standard deviation (SD) and relative standard
deviation (RSD) were calculated as described by Harris (2001).
The variances were compared by the F test (Baccan et al., 1985; Vogel, 1992) and the
concurrency between the means was verified by Student’s t-test (Harris, 2001).
3. Results and discussion
3.1 Evaluation of the electrothermal behavior of the analytes by the univariate method
The elements Pb and Cd are relatively volatile, which makes the use of chemical modifiers
indispensable. Therefore, Pd + Mg and W were used as chemical modifiers to thermally
stabilize the analytes, enabling the satisfactory elimination of most of the matrix, and thus
reducing possible interferences.
3.1.1 Determination of pyrolysis and atomization temperatures of the microemulsified
samples by the univariate method
Pyrolysis and atomization curves were obtained for Cu, Pb, Ni and Cd in the presence of
two modifiers, W and Pd + Mg (Lobo et al., 2009). An analysis of the curves revealed a slight
difference in sensitivity when using the Pd + Mg or W modifier. Hence, analyzing solely the
pyrolysis and atomization temperature curves did not allow for conclusions to be drawn
about the optimal chemical modifier for the analytes in question. Table 8 lists the Tp and Ta
chosen for the analytes (according to the curves).
Elements
Tp (ºC)* Ta (ºC)*
Pd + Mg W Pd + Mg W
Cu 900 900 2700 2500
Pb 900 700 2300 1600
Ni 900 1200 3000 3000
Cd 400 300 1700 2000
* Pyrolysis temperatures (Tp) and atomization temperatures (Ta)
Table 8. Values of pyrolysis (Tp) and atomization (Ta) temperatures of the microemulsified
samples for the two modifiers used.
3.1.2 Pyrolysis and atomization temperature curves of focused microwave digested
samples using the univariate method
Pyrolysis and atomization temperature curves were obtained for Cu, Pb, Ni and Cd in the
presence of two modifiers, W and Pd + Mg (LOBO et al., 2009). The results revealed a
certain similarity with the procedure using microemulsion, i.e., there was a minor difference
in sensitivity when using the Pd + Mg or W modifier. Table 9 lists the Tp and Ta chosen for
the analytes.
Analytical Methodology for the Determination of Trace Metals in Biodiesel
107
Elements
Tp (ºC)* Ta (ºC)*
Pd + Mg W Pd + Mg W
Cu 1000 1000 2600 2600
Pb 900 800 2000 1800
Ni 1500 1400 2600 2400
Cd 550 550 2000 1800
* Pyrolysis temperatures (Tp) and atomization temperatures (Ta)
Table 9. Values of pyrolysis (Tp) and atomization (Ta) temperatures of the digested samples
for the two modifiers used
3.2 Evaluation of the electrothermal behavior using experimental design
3.2.1 Results of the optimization of pyrolysis and atomization temperatures using
experimental design
The optimization method using factorial design evaluates the interactions between the
important variables, as well as their simultaneous combination. Table 10 illustrates the
results of absorbance for the elements evaluated using 2
4
factorial design.
Experiments Cu Pb Ni Cd
1 0.0974 0.1562 0.0658 0.3810
2 0.0651 0.0483 0.0912 0.3520
3 0.0988 0.1506 0.0651 0.5010
4 0.0656 0.0555 0.0824 0.5390
5 0.0991 0.1538 0.0744 0.3840
6 0.0701 0.0452 0.0968 0.3520
7 0.0945 0.1406 0.0621 0.4170
8 0.0694 0.0431 0.0908 0.3130
9 0.0971 0.1599 0.632 0.3120
10 0.0636 0.0488 0.0947 0.3310
11 0.1008 0.1597 0.0894 0.4560
12 0.0630 0.0430 0.0626 0.4600
13 0.1033 0.1673 0.0921 0.2720
14 0.0759 0.0356 0.0735 0.3040
15 0.1044 0.1455 0.0905 0.3530
16 0.0706 0.0397 0.0769 0.3950
Note: This factorial design has two levels, (-) for the lower level and (+) for the upper level, related to
the sample preparation (Variable 1), i.e., digestion (-) and microemulsion (+), levels related to the lowest
(-) and highest (+) temperatures for the two variables of pyrolysis temperature (Variable 2) and
atomization temperature (Variable 3), as well as levels related to the type of modifier used (Variable 4)
Pd + Mg (-) and W (+).
Table 10. Analyte absorbance values using factorial design
Biodiesel – Quality, Emissions and By-Products
108
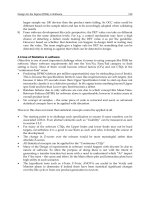
Pareto charts, graphics showing the values of effects and graphics showing special values
are the ones most commonly used to evaluate the interactions between variables and to
pinpoint the significant variables. In this work, values vs. probability graphics were
prepared for the four analytes. In this type of graphic, the effects are calculated as a function
of absorbance values, considering the levels (+ and -) presented in thematrix of the sample.
The graphics of values of the effects vs. the scale of probability are presented in Figure 1
(adapted from Lobo et al., 2009).
-0,12 -0,10 -0,08 -0,06 -0,04 -0,02 0,00 0,02 0,04 0,06 0,08 0,10
0
20
40
60
80
100
1
23
124
14
12
1234
2
134
234
24
123
4
13
34
3
Cu
Probability
Effect
-0,12 -0,10 -0,08 -0,06 -0,04 -0,02 0,00 0,02 0,04 0,06 0,08 0,10
0
20
40
60
80
100
1
14
3
2
23
13
24
134
124
34
234
4
123
1234
12
Pb
Probability
Effect
a) b)
-0,12 -0,10 -0,08 -0,06 -0,04 -0,02 0,00 0,02 0,04 0,06 0,08 0,10
0
20
40
60
80
100
14
12
124
134
2
13
23
34
4
234
24
3
1234
1
123
Ni
Probability
Effect
-0,12 -0,10 -0,08 -0,06 -0,04 -0,02 0,00 0,02 0,04 0,06 0,08 0,10
0
20
40
60
80
100
3
23
4
123
13
1
12
124
34
24
1234
134
234
14
2
Cd
Probability
Effect
c) d)
Fig. 1. Graphic of the value of the effects of the variables on the GFAAS optimization of the
pyrolysis and atomization temperatures of biodiesel samples: a) Cu, b) Pb, c) Ni, d) Cd
On the plot of a graphic of scale of probability vs. value of the effect, the smaller points that
tend to form a straight line are considered insignificant, while the larger (in value of the
effect) and the further apart the points are, the more significant the effect.
In Figures 1a and 1b, the optimization graphic for Cu and Pb shows that variable 1 (sample
preparation) in focused microwave digestion (defined as (-), Table 5) is more important for
the two analytes (higher effect of absorbance), since this point was further away from the
others, while the other variables were indifferent, indicating that any modifier could be
used. The ideal pyrolysis and atomization temperatures were chosen according to the
Analytical Methodology for the Determination of Trace Metals in Biodiesel
109
highest sensitivity, taking into account the lowest temperatures that least degrade the
graphite tube. Thus, the pyrolysis and atomization temperatures chosen were 1000
o
C and
2200
o
C for Cu and 500
o
C and 2000
o
C for Pb, respectively.
Figure 1c shows that none of the evaluated variables were important for Ni. The
pyrolysis and atomization temperatures chosen for Ni were 800
o
C and 2300
o
C. As can
be seen in the optimization graph for Cd in Figure 1d, the variables that were most
distant were variables 2 and 3, indicating that the temperature of pyrolysis must be
increased and that of atomization decreased to ensure greater efficiency in the process.
This finding points to the need to use another factorial design for this element. The
variables medium (1) and modifier (4) were not important, indicating that any medium
or modifier can be used.
3.2.1.1 Results of the evaluation of pyrolysis and atomization temperatures using a second
experimental design for Cd
Table 11 describes the optimization method using factorial design for Cd.
Experiments
Sample
Preparation
Pyrolysis
Temperature
*
Atomization
Temperature
*
Modifier Cd
1 Digestion - - Pd + Mg 0.7622
2 Digestion + - Pd + Mg 0.8427
3 Digestion - + Pd + Mg 0.7274
4 Digestion + + Pd + Mg 0.7707
Table 11. Values of absorbance for the factorial design used for Cd
The values of the effects were too small for the design employed. Therefore, lower
temperatures were chosen, Tp-500ºC and Ta-1400ºC, thereby increasing the service life of the
graphite tube.
The formation of metal carbide (or oxycarbide) deposits on the platform of the graphite tube
or directly on the wall of the tube is an interesting modification strategy to prolong the
service life of the graphite tube when working with aggressive solvents or matrices. In
addition to acting as a coating on the tube and/or as a modifier, these carbides can promote
the decomposition of the matrix through catalytic effects, acting as catalysts and destroying
the concomitants of the matrix prior to atomization of the analyte, thereby minimizing or
eliminating possible interferences (Freschi et al., 2005). The results obtained for all the
metals using the experimental design did not differ when working with either Pd + Mg or
W. Therefore, we decided to work with W since, besides the advantages mentioned earlier,
the heating programs are faster (and thus the determinations are faster), there is less
contamination because purification is done in situ, there are few background-related
problems, and the modifier‘s volatile impurities can be eliminated, thus improving the
limits of detection (Saint´Pierre et al., 2002).
Table 12 summarizes and compares the defined temperatures using the univariate and
multivariate methods.
Biodiesel – Quality, Emissions and By-Products
110
Elements Modifier
Microwave digestion Microemulsion
Conventiona
l Method
M
ultivariate
Method
Conventiona
l Method
M
ultivariate
Method
Tp / Ta* Tp / Ta Tp / Ta Tp / Ta
Cu Pd + Mg 1000 / 2600
1000 / 2200
900 / 2700
-
W 1000 / 2600 900 / 2500
Pb Pd + Mg 900 / 2000
500 / 2000
900 / 2300
-
W 800 / 1800 700 / 1600
Ni Pd + Mg 1500 / 2600
800 / 2300
900 / 3000
800 / 2300
W 1400 / 2400 1200 / 3000
Cd Pd + Mg 550 / 2000
500 / 1400
400 / 1700
500 / 1400
W 550 /1 800 300 / 2000
* Tp – Pyrolysis temperature, ºC / Ta – Atomization temperature, ºC
Table 12. Comparison of the optimal values of pyrolysis and atomization temperatures
using univariate and multivariate methods
An analysis of Table 12 indicates that the values of the temperatures using factorial design
are usually conditions of milder temperatures. Despite a certain difference in sensitivity, the
use of experimental design offers several advantages, such as the definition of suitable
experimental parameters (sample preparation, chemical modifiers), help in the definition of
pyrolysis and atomization temperatures and evaluation of the interactions between the
variables under study.
This emphasizes the importance of the simultaneous optimization of all the factors involved
in the system, with fewer experiments, greater speed, and particularly higher efficiency. The
chosen temperatures were therefore those listed in Table 18 for the multivariate method, for
each specific analyte.
3.3 Evaluation of the influence of standards in the determination of metals
One of the major advantages of systems that use microemulsions is precisely the fact
that they use inorganic standards for the determinations (Aucélio et al., 2004).
Conversely, organic standards have several disadvantages, such as high cost,
instability, they are very dangerous, carcinogenic, and often require the use of special
apparatuses and equipment. However, numerous studies have used emulsified
standards and not aqueous standards (Chaves et al., 2008a, 2008b; Jesus et al., 2008;
Saint´Pierre et al., 2004; Giacomelli et al., 2004), justifying this choice based on the fact
that in most cases emulsified standards are more stable, as well as the difference in
sensitivity compared to aqueous standards.
Figure 2 illustrates the results of the equations adjusted for the seven biodiesel samples
evaluated by the analyte addition method, aiming at a comparison of the behavior of Cd in
the different matrices (emulsified standards) and in aqueous standards. The range of
concentrations used was based on the interval recommended by the manufacturer.
Analytical Methodology for the Determination of Trace Metals in Biodiesel
111
0,0 0,2 0,4 0,6 0,8 1,0 1,2 1,4 1,6
0,00
0,02
0,04
0,06
0,08
0,10
0,12
0,14
0,16
0,18
0,20
0,22
0,0 0,2 0,4 0,6 0,8 1,0 1,2 1,4 1,6
0,00
0,02
0,04
0,06
0,08
0,10
0,12
0,14
0,16
0,18
0,20
0,22
0,0 0,2 0,4 0,6 0,8 1,0 1,2 1,4 1,6
0,00
0,02
0,04
0,06
0,08
0,10
0,12
0,14
0,16
0,18
0,20
0,22
0,0 0,2 0,4 0,6 0,8 1,0 1,2 1,4 1,6
0,00
0,02
0,04
0,06
0,08
0,10
0,12
0,14
0,16
0,18
0,20
0,22
0,0 0,2 0,4 0,6 0,8 1,0 1,2 1,4 1,6
0,00
0,02
0,04
0,06
0,08
0,10
0,12
0,14
0,16
0,18
0,20
0,22
0,0 0,2 0,4 0,6 0,8 1,0 1,2 1,4 1,6
0,00
0,02
0,04
0,06
0,08
0,10
0,12
0,14
0,16
0,18
0,20
0,22
0,0 0,2 0,4 0,6 0,8 1,0 1,2 1,4 1,6
0,00
0,02
0,04
0,06
0,08
0,10
0,12
0,14
0,16
0,18
0,20
0,22
0,0 0,2 0,4 0,6 0,8 1,0 1,2 1,4 1,6
0,00
0,02
0,04
0,06
0,08
0,10
0,12
0,14
0,16
0,18
0,20
0,22
0,0 0,2 0,4 0,6 0,8 1,0 1,2 1,4 1,6
0,00
0,02
0,04
0,06
0,08
0,10
0,12
0,14
0,16
0,18
0,20
0,22
A
2
A
4
A
1
A
5
A
3
A
7
Aqueous Standard
Absorbance
Concentration of Cd, g L
-1
A
6
Fig. 2. Equations adjusted to the analytical curves for the determination of Cd in the 8 samples.
S
1
: A = 0.03017 + 0.0456[Cd], r = 0.99961; S
2
: A = 0.03503 + 0.05386[Cd], r = 0.9995; S
3
: A =
0.01486 + 0.04822[Cd], r = 0.98956; S
4
: A = 0.02971+ 0.05622[Cd], r = 0.9737; S
5
: A =- 0.01386+
0.04042[Cd], r = 0.98695; S
6
: A = 0.00931 + 0.04322[Cd], r = 0.99141; S
7
: A = 0.01088 +
0.05006[Cd], r = 0.99595; r = 0.97394; Aqueous standard: A = 0.01493 + 0.1076[Cd], r = 0.99999.
As can be seen in Figure 2, there is a significant difference between the analyzed standards.
The sensitivities of the analytical curves for pure biodiesel (samples S
1
to S
7
) are consistently
lower for the aqueous standard, confirming the reports of some studies in the literature that
the sensitivities of emulsified standards differ from those of aqueous standards (Cassella et
al., 2004; Reyes Campos, 2005; Saint´Pierre et al., 2002, 2003, 2006).
It was also found that the analytical curves of the biodiesel samples did not exhibit the same
sensitivity, although they were similar. This distinct behavior of the samples‘ analytical
curves can be explained by the differences in the composition of the analyzed samples, i.e.,
fat content, viscosity, source, origins, production processes, etc. Thus, each sample was
determined using emulsified standards.
A curve was also built for sample B10, but because most of this sample consisted of diesel
(90%), it did not show good stabilization and the resulting values were inadequate for the
determination of the analytes in this sample.
3.4 Determination of metals by the calibration procedure using the analyte addition
method
3.4.1 Determination of Ni and Cd in microemulsified samples of biodiesel
The best way to calculate the limits of detection (LOD) and of quantification (LOQ) when
using the analyte addition method is to pass standards of low concentrations until the
Biodiesel – Quality, Emissions and By-Products
112
lowest signals corresponding to the lowest detectable concentration are found. The
estimated standard deviation (SD) is then calculated for 10 measures of the standard with
the lowest concentration, after which the values of LOD and LOQ can be calculated
according to the literature, i.e., LOD = (3sd) / K and LOQ = (10sd) / K, where k is the slope
of the straight line (Baccan et al., 1985; Vogel, 1992). However, due to the experimental
difficulties resulting from the need to conclude this work, the LOD and LOQ were
calculated using the traditional procedure, considering the blank of the samples instead of
the standard with the lowest concentration. Table 13 lists the values of the limits of detection
and quantification, as well as the concentrations of Ni and Cd obtained in the samples.
Sample
LOD
found,
g L
-1
LOQ
found,
g L
-1
[C]*
obtained in the sample,
g g
-1
± sd
Ni Cd Ni Cd Ni Cd
S
1
0.78 0.10 2.67 0.36
LOD
0.66
S
2
0.81 0.10 2.71 0.31
LOD
0.61
S
3
0.85 0.10 2.85 0.34
LOD
0.19
S
4
0.44 0.07 1.47 0.23
LOD
0.33
S
5
0.41 0.12 1.37 0.40
LOD LOD
S
6
0.29 0.12 0.97 0.39
LOD
0.21
S
7
0.46 0.10 1.53 0.33
LOD
0.21
*Concentration of the analyte
Table 13. Concentrations of Ni and Cd, and LOD and LOQ found for the samples
Table 13 indicates that low limits of detection (LOD 0.85 g L
-1
) were obtained for Ni, but
Ni was undetectable in the samples using this method. Many explanations can be
considered, since Ni is usually present in fuels as volatile Ni and low molecular mass Ni
complex (Vale et al., 2004) and may have been lost during the analyses.
Low limits of detection (LOD 0.12 g L
-1
) were obtained for Cd by the analyte addition
method. The concentrations of cadmium found in the samples were low, but were above the
respective limits of detection obtained statistically.
As can be seen in Table 13, sample S
5
(washed animal fat) presented no concentration of Cd,
probably because it was eliminated during the washing step of the biodiesel production
process, rendering it undetectable in the sample analyzed by the proposed method.
Cd values obtained in samples of animal fat are always lower than those found in samples of
vegetable biodiesel. This is probably due to the fact that vegetables can absorb metals from the
soil, which is not the case in samples of animal origin. Moreover, cadystins may also be present,
which are synthesized by the majority of higher plants and are also present in algae and fungi.
The presence of Cd in biodiesel can be attributed to the high mobility of this element in soil
(Costa-Neto et al., 2007; Oliveira, et al., 2001). Another important factor that deserves mention is
that Cd has been used in the form of CdCl
2
as a fungicide, and can be considered a source of soil
contamination (Hernández-Caraballo et al., 2004; Campos et al., 2005).
Analytical Methodology for the Determination of Trace Metals in Biodiesel
113
3.4.2 Analyte addition and recovery test
Due to the lack of certifies reference material for biodiesel, the analyte addition and recovery
test was used to evaluate the accuracy of the method. Table 14 lists the results obtained for
each sample.
Sample
Recovery rates, %
Ni
RSD* Cd
RSD
S
1
108 1.5 100 4.3
S
2
105 0.7 104 3.3
S
3
103 2.9 108 0.6
S
4
102 1.8 99 3.7
S
5
101 3.0 116 3.7
S
6
93 8.2 98 4.7
S
7
97 2.7 102 4.6
S
8
93 0.8 95 1.8
*RSD – relative standard deviation
Table 14. Recovery rates (n=3) and relative standard deviations of the biodiesel samples,
using W as modifier, prepared with 10 g L
-1
of Ni and 1.0 g L
-1
of Cd
The accuracy of an analysis depends on the matrix, on sample processing, and on analyte
concentration. Data in the AOAC handbook (“Peer Verified Methods Program”) indicate
that, for concentrations of 10 g L
-1
, recovery rates of 40% to 120% are acceptable (National
Health Surveillance Agency – ANVISA, 2009).
Table 14 shows that the recovery rates varied from 93% to 108% for Ni and from 95% to
116% for Cd, indicating that the method used here is suitable for the determination of Ni
and Cd in matrices of biodiesel from different sources and origins. Satisfactory RSD values
were obtained, i.e., 8.2% (sample S
7
) and 4.7% (sample S
8
) for 10.0 g L
-1
of Ni and 1.0 g
L
-1
of Cd, respectively.
3.4.3 Determination of Cu, Pb, Ni and Cd in digested biodiesel samples
Due to the difference in sensitivity obtained by the emulsified and aqueous standards, the
analytes were determined here using standards in the presence of digested samples by the
analyte addition method.
After a certain period of storage, the sample of unwashed animal fat (sample S
4
) presented
nodules (like fatty stones), so this sample could not be homogenized and was therefore not
subjected to the digestion procedure.
The sample of cotton origin (S
7
) could not be digested because it presented fatty residues at
the end of the digestion procedure. Although all the samples were similar, samples of cotton
origin should show higher organic loads than other samples, and the amount of acid used
was insufficient for the complete digestion of this sample.
Table 15 lists the concentrations of Cu, Pb, Ni and Cd, and the limits of detection and
quantification found for the digested samples.